Abstract
A naturally secreted Gaussia luciferase (Gluc) has been utilized as a reporter for bioluminescence imaging (BLI) evaluation. However, the potential application of Gluc for in vivo monitoring of systemic protein delivery, as well as its natural biodistribution, has not been studied. To examine Gluc secretion and uptake profile, we injected Gluc-encoding plasmids into mice by hydrodynamic tail-vein injection. Whole-body BLI showed that imaging quantification obtained at pawpad was directly correlated to blood Gluc activities. When gene expression was restricted to the liver by the use of a hepatic promoter, in vivo Gluc biodistribution analysis revealed the kidney/bladder, stomach/intestine and lung as the major uptake organs. Three-dimensional BLI identified liver/stomach and lung as the main internal luminescent sources, demonstrating the feasibility of detecting major uptake organs in live animals by 3D BLI with high background signals in circulation. Notably, Gluc levels in capillary-depleted brain samples from Gluc-injected mice were comparable to controls, suggesting Gluc may not cross the blood-brain barrier. Gluc uptake kinetics and intracellular half-life were assessed in various types of cell lines, implicating the involvement of non-specific pinocytosis. These results suggest that Gluc-based system may provide a useful tool for in vivo evaluation of protein/agent biodistribution following systemic delivery.
Keywords: Gaussia luciferase, 3D bioluminescence imaging, systemic biodistribution, blood-brain barrier, reporter, uptake, pinocytosis, mice
Introduction
Most biopharmaceutical proteins or therapeutic drugs are delivered and/or distributed by blood circulation in humans. The feasibility of real-time monitoring of the spatial and temporal bio-distribution of these agents in animal models can provide invaluable insight into drug screening and targeting, as well as in vivo process/tracking of systemic protein delivery. In vivo bioluminescence imaging (BLI) is emerging as a critical tool for noninvasive detection and quantification of various biological processes in vivo [1–4]. Moreover, it provides the advantage of localizing and quantifying the in vivo delivered agents at multiple time points in the same living subject.
Firefly luciferase (Fluc) and Renilla luciferase (Rluc) are the two most commonly used luciferases for BLI studies. However, the detectability of Fluc is largely limited by the requirement of ATP and Mg+2 as cofactors for the generation of luminescent signals. On the other hand, no need of cofactor or ATP for signal production has made Rluc suitable for imaging cell surface targets, yet it has a significantly lower quantum yield and less enzymatic efficiency compared to Fluc. Recently, Gaussia luciferase (Gluc), a naturally secreted luciferase isolated from a marine copepod, has attracted much attention as a reporter protein for BLI evaluation, because it is both the smallest (19.9 kD) and the brightest known ATP-independent luciferase [5, 6]. Compared to humanized forms of Fluc or Rluc, humanized Gluc can generate over 100-fold higher luminescent intensity from viable cells or cell lysates determined by luminometer [5, 6]. For in vivo imaging analysis, Gluc has shown 200-fold higher signal intensity than Rluc and a comparable level of intensity to that of Fluc. The application of humanized Gluc has been investigated in animals as a marker/reporter for quantification of tumor growth [2], cell-based in vivo imaging [7], immunoliposome delivery [8], and gene transfer efficiency [9]. In addition, the feasibility of dual-reporter assessment of Gluc in combination with Fluc has been reported recently, because these two luciferases utilize different substrates and the half-life of Gluc signals is relatively short [10, 11]. Being the smallest luciferase, Gluc has also been utilized as part of a bi-functional fusion protein that could be secreted in vitro [12], or monitored in vivo by BLI [13]. However, the natural in vivo biodistribution and uptake profile of secreted Gluc in animals have not been well studied.
Due to rapid hepatic clearance, it has been challenging for most of the externally administered agents to maintain a stable level in the circulation for sufficient duration to allow for an adequate examination and accurate quantification of their distribution in organs and tissues. Hydrodynamic tail-vein (HTV) injection of naked plasmid DNA has been proven to introduce a high transgene expression in the liver of small rodents [14]. This method is well tolerated in mice and rats with peak levels of transgene expression predominantly found in hepatocytes (> 90%) at 2–5 days post injection. The convenience and effectiveness of in vivo hydrodynamic gene delivery have provided a unique platform to evaluate the biology, physiology and immune responses of cell- and gene-based therapy approaches in vivo (reviewed in [14, 15]). Compared to conventional synthetic protein injection, the HTV approach we utilized might provide superior and stable plasma protein delivery, and open a practical window for an in vivo evaluation of Gluc biodistribution and uptake profile.
In this study, we evaluated the potential application of Gluc as a BLI reporter for systemic protein delivery through the circulation in vivo, as well as its natural in vivo biodistribution. We report here that Gluc can be robustly expressed in liver and secreted into the blood 24 hrs after HTV injection in mice. Gluc could be taken up by other peripheral organs with the highest level found in the kidney/bladder and stomach/intestine, but failed to cross the blood-brain barrier (BBB) or into the testis. As a reporter protein, we were able to detect Gluc activity above background level in mouse blood 20 days after HTV injection. Among all three regions of interest (ROI) analyzed by bioluminescent imaging, the photon counts in pawpad ROI were consistently correlated with blood Gluc activities as determined by luminometer readings. Three-dimensional (3D) imaging analysis localized internal light sources to liver/stomach and lung areas, demonstrating for the first time the feasibility of 3D BLI with high background levels generated by circulating luciferase. To better understand the mechanism of Gluc uptake and its clearance profile at the cellular level, its kinetics was assessed in non-tumorgenic cell lines. Results suggested the likely involvement of pinocytosis in Gluc internalization into cells. Our data on the natural biodistribution profile of Gluc and its potential uptake route are valuable for the application of Gluc as a reporter for in vivo monitoring of systemic protein delivery, as well as for other in vivo BLI applications. Thus, the Gluc-based system may provide a useful tool for in vivo tracking of temporal changes and biodistribution of agents/proteins in-frame fused with Gluc following systemic delivery.
Materials and Methods
DNA plasmids and vector construction
Two Gluc-expressing plasmids were used in this study. The pCMV-Gluc plasmid was obtained from New England BioLabs (Ipswich, MA). The phAAT-Gluc plasmid was constructed using the pCMV-Gluc and pBS-HCRHPI-A plasmids. The pBS-HCRHPI-A plasmid contains a liver specific human α-antitrypsin-based hybrid promoter (hAAT) as described previously [16]. The Gluc gene was amplified by PCR from the pCMV-Gluc plasmid to introduce flanking Ndel and EcorV restriction sites, followed by Topo-cloning and sub-cloning into the Ndel and EcorV sites of the pBS-HCRHPI-A. The phAAT-Gluc plasmid was verified by sequence analysis.
Cell lines and cultures conditions
Human foreskin fibroblasts (HFF), human embryonic kidney 293 cells (HEK293), murine brain endothelial cells (bEnd.3), and mouse embryonic fibroblasts (NIH3T3) were obtained from American Type Culture Collection (ATCC, Manassas, VA). Cells were maintained in DMEM (high glucose) (Invitrogen, Carlsbad, California) supplemented with 10% fetal bovine serum (Mediatech, Inc; Manassas, VA) plus 1% penicillin/streptomycin (Invitrogen, Carlsbad, California).
NIH3T3 cells stably expressing Gluc (NIH3T3-Gluc) were generated by transfecting NIH3T3 cells with pCMV-Gluc plasmid using TransIT®-3T3 transfection kit (Mirus Bio LLC, Madison, WI). Gluc stably expressing cells were obtained by selection with 400µg/m1 of G418 for 3 weeks. After G418 selection, growth medium from NIH3T3-Gluc was tested for Gluc activity to confirm the expression and secretion of Gluc into the cell medium.
Animals
C57BL/6J and NOD/SCID/β2-microglobulin (SCID/β2) mice (9- to 10-week old) were used in this study. The mice had free access to food and water, and were maintained on a 12-hour dark/light cycle in a room with controlled temperature (24 ± 1 °C) and humidity (55 ± 5%). The studies on animals were approved by the Cincinnati Children's Hospital Institutional Animal Care and Use Committee, and carried out in a pathogen-free facility approved by the Association for Assessment and Accreditation of Laboratory Animal Care.
Gluc luciferase activity assays in intact cells, conditioned culture media, cell/tissue lysates, whole blood and urine
Different numbers of NIH3T3-GLuc cells in 5µl of 1X PBS or 5µl of conditioned cell culture media were transferred to flat solid bottom and opaque-walled white 96 well laminator Costar plates (Fisher Scientific Inc., Pittsburg, PA). Gluc bioluminescence values were measured over 2.5sec immediately after automatic addition of 100 µl of 25 µM colenterazine (Nanolight, Pinetop, AZ) by an injector-equipped Veritas microplate luminometer (Promega, Madison, WI). To minimize bioluminescence signal between wells of each 96 well plate, Gluc activity was measured in every other well of the plate. Each sample was tested twice in duplicate reactions.
10µl of each cell lysate or tissue homogenate in 1X PBS buffer containing 200mM NaC1, 0.1% Triton-X100 and 1X protease inhibitors (Sigma, St. Louis, MO) were transferred to flat solid bottom and opaque-walled white 96 well laminator Costar plates (Fisher Scientific Inc., Pittsburg, PA). Gluc bioluminescence values were measured as described above (2.4.1.). Protein concentration in each sample was determined with the Pierce BCA protein kit assay (Thermo Fisher Scientific Inc., Rockford, IL). Gluc bioluminescence values were normalized to their corresponding protein concentration.
Urine samples were collected by abdominal palpation. Blood samples (50 µl) were obtained from the tail-vein of each mouse into heparinized or EDTA tubes. For plasma isolation, blood samples were centrifuged for 25 min at 1.3×g at 4°C. Then, 5 µl of blood, plasma or urine sample was used to carry out the Gluc luciferase activity assay as described above (2.4.1) after mixing the samples with 100 µl of 50 µM Gluc substrate (Nanolight, Pinetop, AZ).
Transient in vivo gene transfer by hydrodynamic tail vein injection
The expression of Gluc in mice from both Gluc expressing constructs (pCMV- and phAAT-Gluc plasmids) was achieved via the HTV injection method. A total of 40 µg of DNA of each Gluc-expressing plasmid was injected into the mouse tail-vein in a volume of saline equivalent to 10% of the body mass of the mouse (e.g., 2.0 ml for mouse of 20 g). The total volume was delivered within 5–8 seconds using a 26-gauge insulin syringe-needle. Injected mice resumed normal activity within 5 minutes post injection.
In vivo bioluminescence imaging
The in vivo BLI was performed on mice 1–2 days after hydrodynamic injection of Gluc-expressing plasmids using an IVIS Imaging System 200 (Xenogen Corporation, Alameda, CA). Mice were under continuous anesthesia on a heated stage using the XGI-8 Gas Anesthesia System. Bioluminescence imaging was obtained by acquiring photon counts over 5 min immediately after intravenous tail-vein injection of 150 µl coelenterazine (4 µg/g body weight) using a 26 mm square back-thinned CCD camera. Acquired data were analyzed using Living Image Software Version 2.50 (Xenogen) with the overlay on light-view image. Regions of interest (ROI) were created using an automatic signal intensity contour tool and normalized with background subtraction of the same animal. The mean ± SD of the sum of the photon counts in ROIs was calculated as a measurement of BLI luciferase activity.
To localize bioluminescent light sources inside a mouse, we conducted a sequential data acquisition using three filters at the wavelengths of 580, 600 and 620 nm with exposure time 3–10 min. The subject surface topography was generated from a structured bright-light image. The 3D reconstruction of bioluminescent sources was generated by Diffuse Tomography analysis using Living Image 2.1 Software (Xenogen Corporation) according to the manufacture’s user manual.
Tissue collection and protein preparation
Transcardiac perfusion was employed to purge blood vessels and remove residual blood from anesthetized animals as described previously [17]. Under deep anesthesia with sodium pentobarbital (I.P. injection of 40mg/Kg /mouse), each mouse underwent transcardial perfusion with sterile ice cold 1X PBS for at least 3 min. The success of this procedure was confirmed by a loss of color in the liver and the blood vessels that flank the midline of the rib cage. Then, the brain and other tissues were quickly obtained from each mouse and subsequently stored (except brain samples) at −80 °C until further analysis. For protein sample preparation, tissues were weighed and homogenized in 4X (v/w) PBS buffer (1X) containing 200 mM NaC1, 0.1% Triton-X100 and 1X protease inhibitors (Sigma, St. Louis, MO). After homogenization on ice in microcentrifuge tubes with 10 strokes of disposable Kontes pellet pestles (Fisher scientific, Pittsburgh, PA), tissue homogenates were incubated on ice for 30 min, then centrifuged at 14000 rpm for 10 min at 4°C. Supernatants were separated from the pellets for Gluc activity assays.
Brain capillary depletion was carried out using a modified depletion method from Triguero et al. [18]. Briefly, freshly removed mouse brains were homogenized on ice with 10 strokes by disposable Kontes pellet pestles in 2X (v/w) capillary depletion buffer (10 mM HEPES, 141 mM NaC1, 4 mM KCl, 1 mM NaH2PO4, 2.8 mM CaC12, 1.0 mM MgSO4, 10 mM D-glucose, protease inhibitors, pH 7.4). Then, 1.5 volumes of cold 26% dextran were added for a final dextran concentration of 16% and the tissues were homogenized with 3 additional strokes. The tissue homogenates were centrifuged at 5400×g for 15 min at 4°C. The supernatants containing brain tissues and the pellets containing the capillaries were carefully separated and washed three times with 1X PBS. Brain homogenates and capillary isolates were resuspended in Gluc lysis buffer for further analysis.
In vitro Gluc uptake and clearance assays
For Gluc uptake assays, HEK293, HFF, and bEnd.3 cells were subcultured in 12-well culture plates at a density of 200×103, 100×103, and 200×103 cells per well, respectively, overnight at 37 °C in a 5% CO2 incubator. Cells were then treated with various volumes (0, 62.5, 125, 250, 500, or 1000 µl) of NIH3T3-Gluc cell growth medium (with Gluc activity ~3000 relative luminescence units [RLU] per µl) in a 1000 µl total incubation volume. At the end of the incubation period (20, 60, or 180 min), cells were put on ice to stop the uptake process and washed 3–5 times with ice cold 1X PBS. Then, cells were lysed with 200 µl Gluc lysis buffer (1X PBS buffer containing 200 mM NaCl and 0.1% Triton-X100 plus protease inhibitors). Thereafter, lysed cell samples were sonicated in an ice bath by three 10 sec pulses of 40-Watts using an Ultrasonic Processor GE 130PB (Hielscher Systems, Teltow, Germany). The cell lysates were collected by centrifugation at 14000 rpm for 15 min at 4 °C. The Gluc activity of each cell lysate was determined as described above.
For clearance assays, HFF and HEK293 cells were seeded at densities of 100×103, and 200×103 cells per well in 12-well culture plates. The next day, 1 ml of Gluc medium (~3000 RLU/µl) was added to each well. After 1hr of incubation, the Gluc medium was removed and cells were washed 5 times with fresh medium. Thereafter, the cells were returned to the cell culture incubator and allowed to grow for various period of time (0, 10, 20 and 40 min, and 1, 3, 6, and 24 hrs). At the end of each incubation period, cells were put on ice to stop the clearance process, washed 5 times with ice cold 1X PBS, then lysed using the Gluc lysis buffer. Lysed cell samples were sonicated in an ice bath, cell lysates were collected by centrifugation, and luciferase activity was measured as described above. The half-life of Gluc in cells was calculated using Excel software after data were fitted to a first-order exponential model.
Statistical analysis
Results were expressed as mean ± SEM or SD as specified in the figure legends. Comparisons were performed using two-tailed Student's t tests. Probability values of 0.05 were considered to be statistically significant.
Results and Discussion
Gluc transgene could be expressed and secreted in vitro and in vivo by ubiquitous and liver-specific promoters
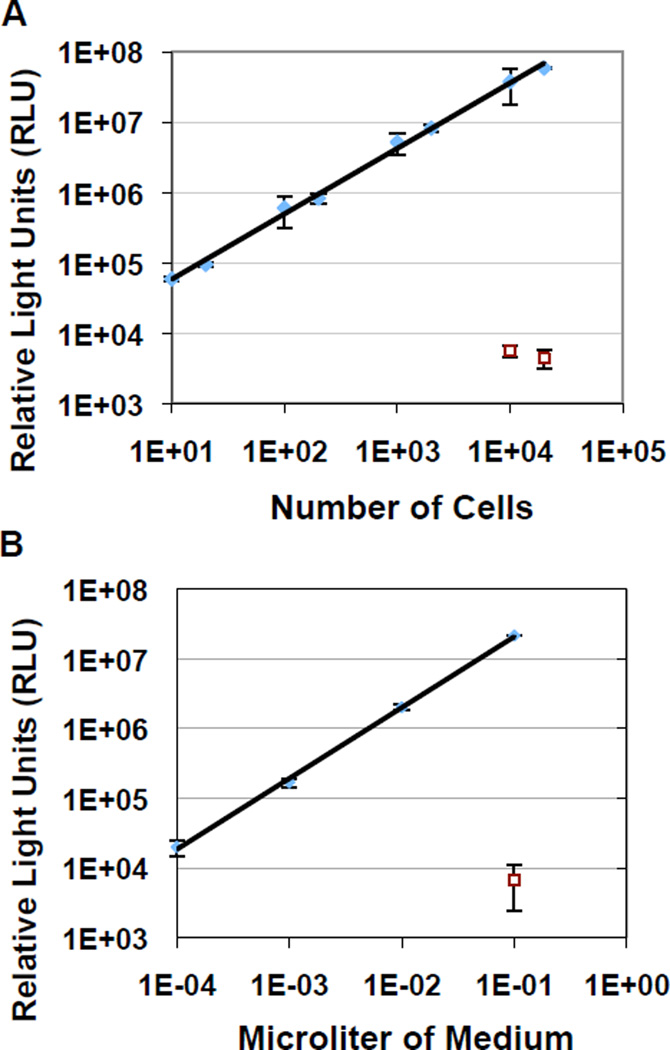
To validate Gluc expression and secretion, we first transduced the pCMV-Gluc plasmid into NIH3T3 cells and generated a stable Gluc-expressing cell line by drug selection. Luciferase activities were determined either in intact cells or in their growth media (Fig.1). Gluc expression in intact cells was high enough to enable detection of as few as 10 cells with an over 3–4 log fold increase on the standard curve and a high correlation coefficient (0.997) (Fig. 1a). In addition, the standard curve (r2= 0.999) derived by serial dilutions of media conditioned by 24-hr culture of NIH3T3-Gluc cells demonstrated that functional Gluc luciferase could be secreted efficiently at a rate of ~ 4×10⁵ RLU/cell (Fig.1b). The results suggest that Gluc can provide sensitive detection, and be efficiently generated and secreted by NIH3T3 cells.
Fig. 1.
Detection of Gluc expression and secretion in vitro. Varying numbers of intact NIH3T3 cells stably overexpressing Gluc (3T3-Gluc) (a), or serial dilutions of Gluc-containing media conditioned by 24-hr culture with 106 3T3-Gluc (b), were analyzed for relative light units (RLU) using a luminometer. Results were derived from two experiments and are presented as mean ± SD with p<0.001 compared to parental cells or medium without Gluc (indicated as symbols □).
The CMV promoter is the immediate-early gene promoter from cytomegalovirus that has been commonly used to introduce strong gene expression in a wide range of cell types in vitro. However, in vivo transcriptional inactivation of CMV has also been observed in animals which may be related to methylation and cytokine-related inhibition of viral promoters [19, 20]. Moreover, ubiquitous expression from the CMV promoter may complicate the evaluation of the in vivo Gluc uptake profile following the systemic gene delivery used in this study. Thus we constructed a phAAT-Gluc vector to introduce hepatocyte-specific Gluc expression using a hybrid promoter that consisted of a human α1-antitrypsin promoter, a hepatic HCR and a portion of intron 1 in hFIX [16].
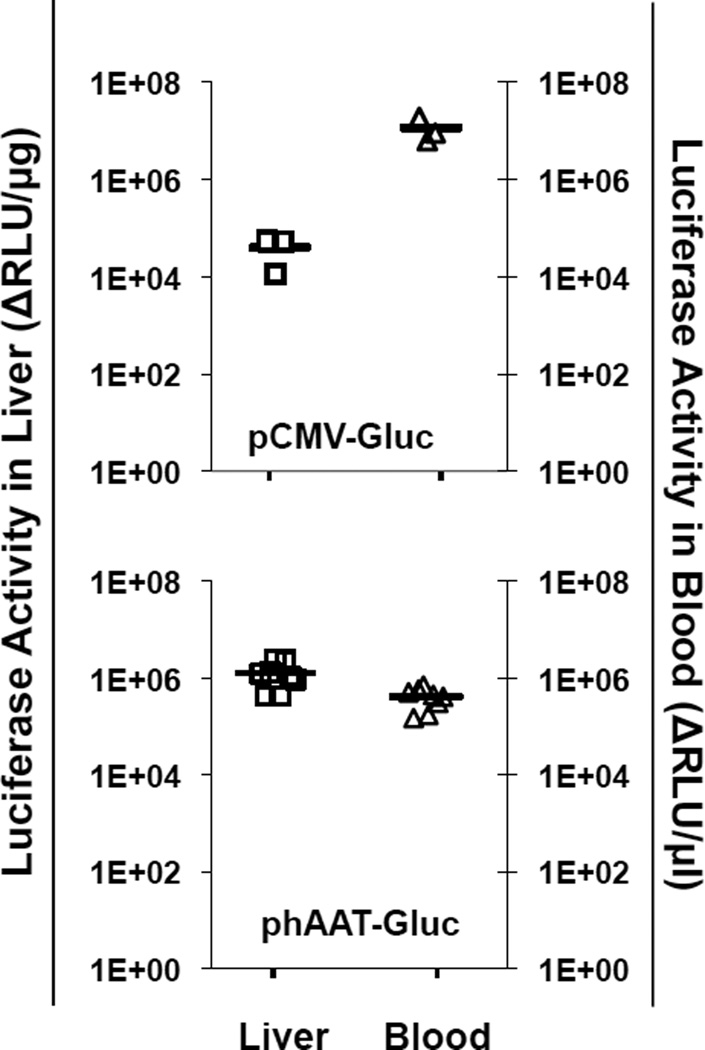
To evaluate Gluc expression and secretion ability in vivo, we utilized the HTV injection method, which has been shown to introduce relatively transient yet robust gene delivery mostly in the liver of small animals [21]. Twenty-four hours after HTV injection of 40µg plasmid DNA of either pCMV-Gluc or phAAT-Gluc into mice, the luciferase activities were determined in blood and the liver of well-perfused animals. Elevated Gluc activities were detected in liver (mean of 5×10⁴ or 1×10⁶ ΔRLU/µg) and blood (mean of 4×10⁵ or 1×10⁷ ΔRLU/µl) in both groups (Fig.2). Interestingly, compared to the CMV promoter, the use of liver-specific hybrid hAAT promoter resulted in approximately 20-fold higher Gluc levels in the liver, although lower activities were observed in the blood stream. It has been reported that the CMV promoter could induce higher transcriptional activity in liver than the hAAT promoter following HTV injection [22]. Our result indicates that the inclusion of HCR of apolipoprotein E and an intron sequence from hFIX in the hybrid hAAT promoter may likely increase the strength of the AAT promoter in addition to sustaining gene expression as has been reported previously [16]. The relatively higher Gluc levels in blood of pCMV-Gluc mice may be due to the contribution of CMV-driven transcriptional activity in other organs because gene transfer by HTV injection has also been reported in lung and spleen [15, 23].
Fig. 2.
In vivo Gluc expression and secretion. Gluc activities were determined in liver homogenates and EDTA-blood of C57 mice 24 hr after HTV injection with either pCMV-Gluc or phAAT-Gluc plasmids. Luciferase activities were normalized by subtracting background signals derived from samples collected from mock-injected animals, and expressed as ΔRLU per µg protein or per µl of blood. The bars represent the mean values.
Temporal Gluc levels in circulation exhibited biphasic reduction
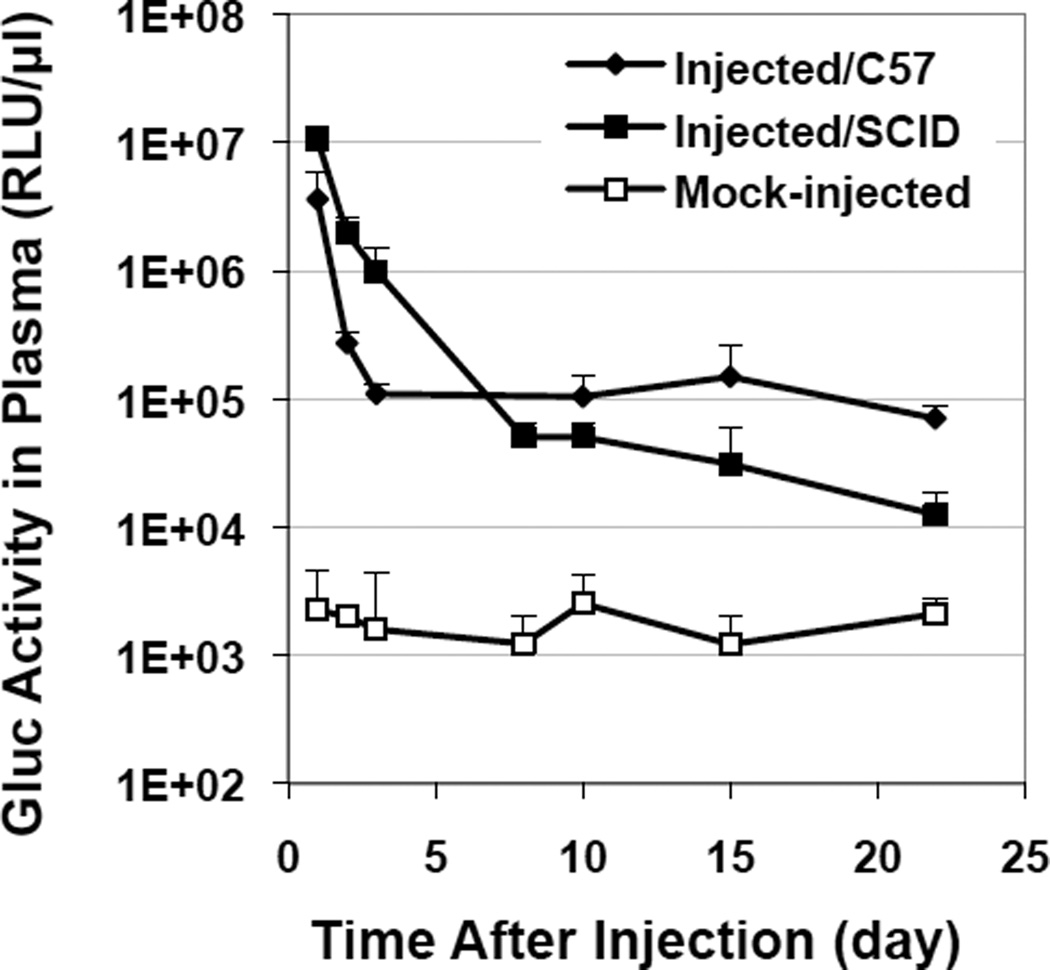
To determine the window of detection for in vivo bioluminescent imaging and uptake profile, blood Gluc levels were monitored for over 20 days post injection in immune-competent C57/Bl6 or immune-deficient SCID-β2 mice (Fig.3). The luciferase activities were the highest 24 hrs after injection (the earliest detection point) in both groups. A rapid initial decline was seen in C57 mice with a drop of more than 40 fold from Day 1 to 3, followed by a plateau stage until the end of the observation period. This biphasic decline of luciferase activity in blood with time was consistent with the pattern of time-dependent Fluc gene expression in the liver as reported by others [22]. A slower decline of blood Gluc (over 10-fold from Day 1 to 3) was observed in SCID mice, although a more continuous reduction led to lower Gluc levels than those of the C57 group by 3 weeks post injection. The decrease in activity is mostly due to the promoter silencing often seen in liver [24], although immune reactivity toward Gluc and/or organ uptake may also play a role in the initial Gluc decline.
Fig. 3.
Time-dependent Gluc activities in the circulation after HTV injection of pCMV-Gluc plasmid. Blood samples were collected and analyzed at various time points from injected mice (n=4) of either the immune-competent C57 strain or the immune-deficient SCID-β2 strain. Data from mock-injected mice of both strains were grouped together as no differences were observed in background luciferase signals (n=4).
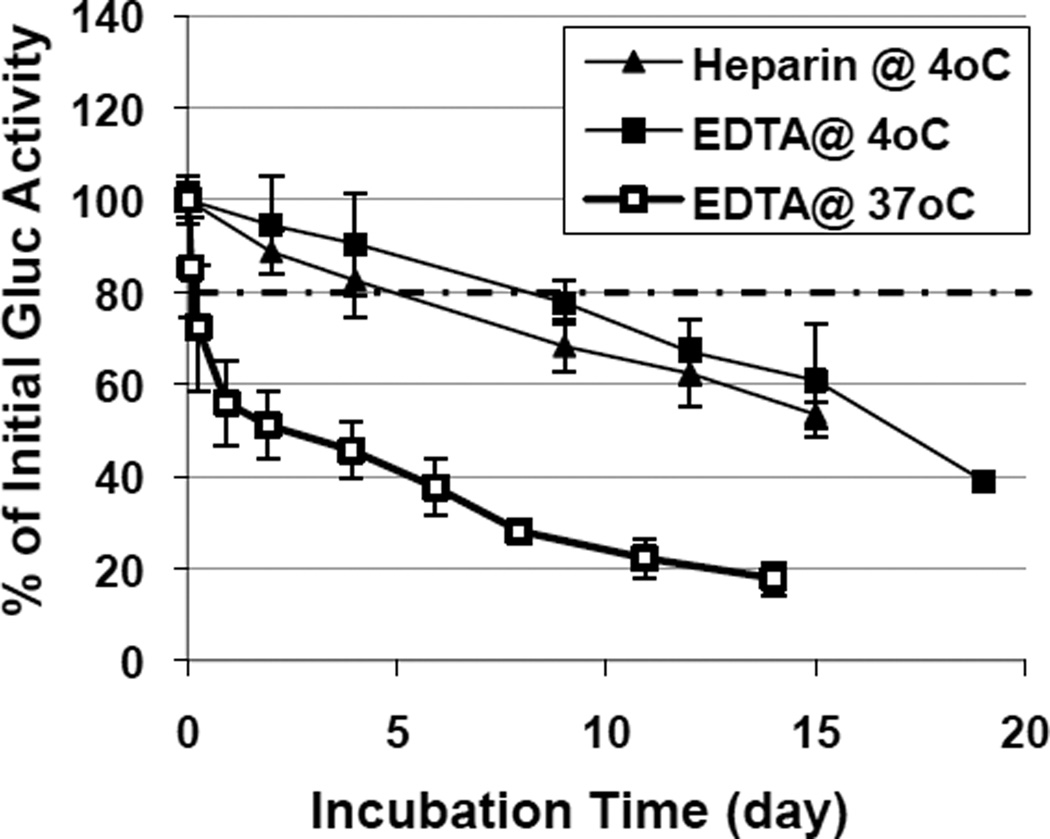
The stability of Gluc in blood may also contribute to the disappearance of Gluc from the circulation and affect the uptake profile in organs. To determine the half-life of GLuc in blood, blood samples were collected using either EDTA or heparin as anti-coagulant from injected C57 or SCID mice, followed by incubation at 4 ° C or physiological 37 ° C with repeated luciferase assays at the indicated times (Fig. 4). A reduction of ~20% in luciferase activity was observed in heparin samples 4 days after incubation at 4° C, yet a similar reduction was seen in EDTA samples 9 days later, suggesting that EDTA may preserve functional Gluc better than heparin. Interestingly, when incubated at 37 ° C, the Gluc activities in EDTA samples decreased rapidly (> 25% reduction within 4-hr incubation), followed by a slower yet continuously reduction at a rate similar to those observed in samples incubated at 4 ° C. This data suggests that an efficient yet transient Gluc inactivation mechanism may be present specifically at 37 ° C, in addition to a much slower Gluc degradation process that is not temperature sensitive. Noticeably, the in vivo disappearance of Gluc activity in circulation was more rapid (>97% lost within 2 days) (Fig.3) than the loss of functional Gluc due to its instability in blood in steady-state (~50% within 2 days), even though Gluc production only occurred in vivo.
Fig. 4.
Stability of Gluc in whole blood. Blood samples were collected (n=28) from 6 injected mice in the presence of anti-coagulant, either heparin or EDTA, at 4° C or 37° C. Aliquots of blood samples were analyzed at various times as indicated post collection. Results are presented as % of Gluc activity of the same sample analyzed on the initial collection day. Dashed line indicates the level of 80% original Gluc activity where maximum differences were observed between the heparin and EDTA sets.
Gluc bioluminescent imaging demonstrated correlation of photon signals in pawpad regions with blood activities
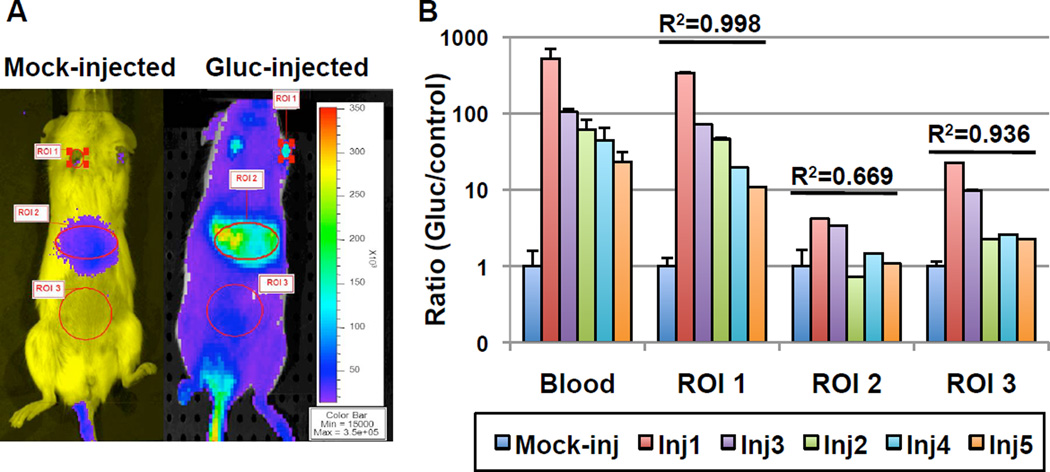
To monitor the relative bio-distribution of Gluc in living animals, bioluminescent imaging analysis was performed in mice 1–2 days after HTV injection of either saline or pCMV-Gluc (Fig. 5). Three regions of interest were identified that exhibited photon signals significantly above background levels that had been elevated due to high Gluc levels in the circulation (Fig.5a). Among them, the pawpad area showed the highest Gluc bioluminescence signals, followed by the liver area and the abdominal area. Moreover, the photon counts in the pawpad ROIs were consistently correlated (R2 =0.998) with blood luciferase activities as determined by luminometer readings in all Gluc-injected animals over the mock-injected controls (Fig.5b). Luminescent imaging signals in liver areas (ROI 2) were not significantly above background controls in Gluc-injected mice when blood luciferase levels were less than 100-fold of control levels. Of note, the correlation pattern among ROIs and blood Gluc activities was derived from both white-fur SCID (Inj1 and Inj2) and black-fur C57 (Inj3-Inj5) mice after the removal of their body hair. This in vivo quantification of ROIs can be complicated by several factors, such as attenuation and scattering of light by tissues [25]. Signal attenuation is largely associated with internal absorption of photons by the presence of hemoglobin, melanin and other pigmented macromolecules [26]. While scattering of signal occurs multiple times at cell and organelle membranes depending on the wavelength and depth of the light source, leading to diffusion of emitted light and reduction of spatial resolution. Thus, the pawpad area has several advantages such as its hairless nature, the simplicity of blood vessels within this small defined area, and proximity of blood vessels to the surface. Therefore photon signals acquired here were most representative of Gluc levels in the circulation. Generation of red-shift variants for Gluc, which can significantly reduce background absorption caused by hemoglobin, may further improve Gluc usage in BLI applications.
Fig. 5.
Bio-imaging of Gluc expression and correlation of in vivo bioluminescence signals with blood luciferase activities. Bioluminescence imaging analysis was performed in mice 1–2 days after HTV injection of either saline (mock-injected, n=3) or pCMV-Gluc (n=5). a Representative BLI images using CCD camera are shown with the color scale indicating luminescent signal intensity. Regions of interest (ROI) are defined as ROI 1 for the pawpad area, ROI 2 for the liver area, and ROI 3 for the abdominal area. b Quantitative analysis of Gluc bioluminescence signals obtained from different ROIs (as indicated in a) of five Gluc injected mice from SCID strain (Inj1 and inj2) or C57/Bl6 stain (Inj3-Inj5) were compared to the Gluc activities in blood samples from the same set of animals determined by luminometer readings. Data are presented as ratio of BLI signals (RLU/s) or blood luciferase activities (RLU/ml) over background levels obtained from control mock-injected mice (n=3). Of note, the background control signals in ROI 2 or ROI 3 were 44- or 10-fold higher than those in ROI 1, respectively. The coefficient of determination (R2) was derived from the linear regression correlation of the underlying data set with the blood luciferase data set.
Uptake of Gluc was observed in major peripheral organs, with confirmation by 3D BLI analysis, but not in the brain or testis
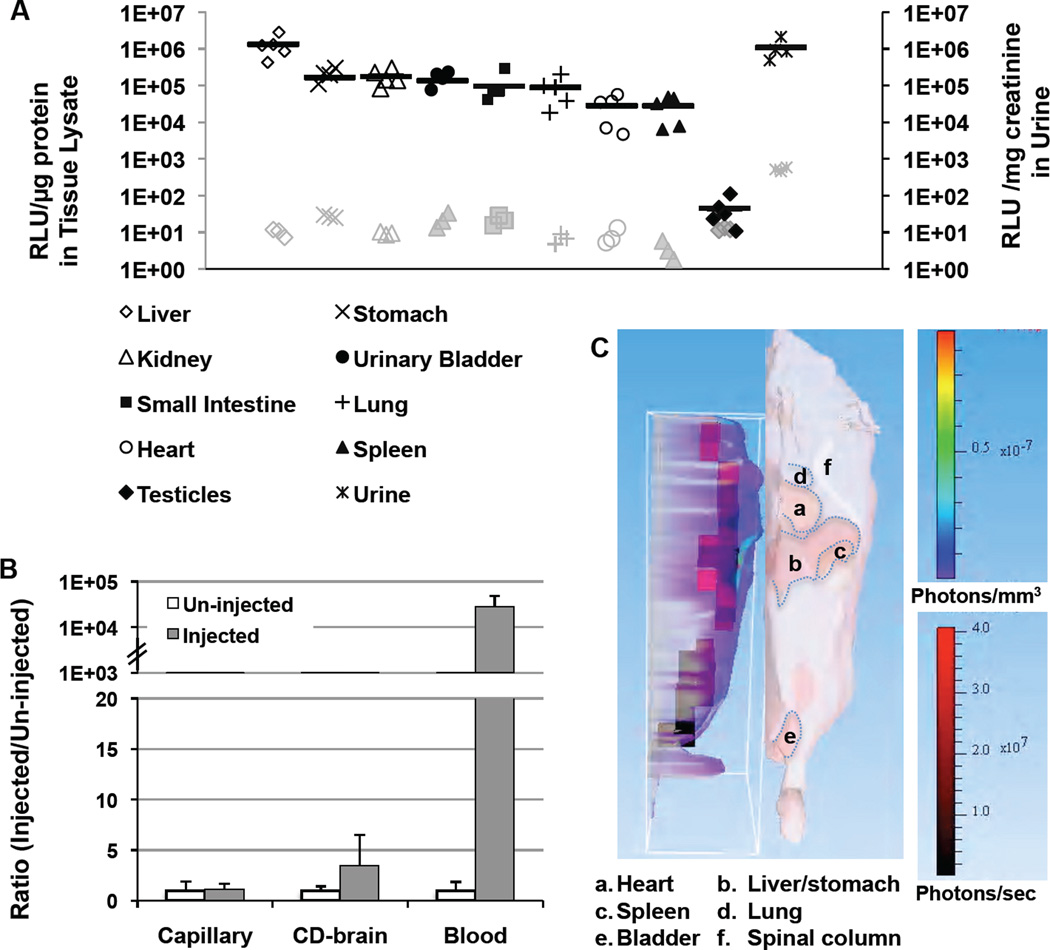
To evaluate the Gluc uptake profile in mice, major organs were harvested, following transcardiac perfusion to eliminate blood Gluc contamination, from mice 24 hr after HTV injection with phAAT-Gluc vector. As expected, Gluc activities were highest in the liver because it was the Gluc-producing organ (Fig.6). The kidney/bladder and stomach/small intestine exhibited similarly high uptake activities, followed by the lung (50% of kidney levels), and lower levels were detected in spleen and heart (~16% of kidney levels) (Fig.6a). Moreover, near background levels of luciferase activities (p=0.22) were observed in the testis of all tested animals, while urine contained higher than blood levels of GLuc. These results suggested that Gluc could be taken up by all peripheral organs tested except the testis. High levels of Gluc found in kidney, bladder and urine were consistent with previous reports of high Gluc levels detected in the urine of animals with Gluc-expressing tumor growth [27]. The active glomerular filtration of blood Gluc with subsequent renal excretion, as well as biliary or fecal excretion implicated by high luciferase levels found in stomach and intestine, may play an important role in the rapid loss of Gluc activity from plasma as described in Fig.3 and the ultimate removal from the body.
Fig. 6.
Gluc biodistribution in peripheral organs and the brain. a Gluc activities were determined in tissue homogenates of nine primary organs of well-perfused animals 24 hrs after HTV injection with phAAT-Gluc plasmid. Each value represents mean luciferase activity of triplicate assays that are normalized by protein contents quantified with BCA kit. Solid lines indicate the average of each group (n=4–5). The background signals derived from corresponding organ homogenates of mock-injected mice were presented in grey color. b The ratios of luciferase activities in brain capillaries, capillary-depleted brain tissues (CD-brain) and blood from injected mice (n=6) to those of un-injected controls (n=5) are shown as mean ± SD. c A 3D reconstruction image of bioluminescent signals (left image) is shown (face-to-face) with a digital mouse atlas (right), to obtain anatomical reference points, in a Gluc-injected mouse 1 day after injection. The colored boxes (voxel) indicate the origin of luminescent light sources in the body (with the highest intensity in red).
It is not clear whether secreted Gluc can cross the intact blood-brain barrier into brain parenchyma, although passage of Gluc across the brain tumor-blood barrier has been demonstrated previously [27]. The unique combination of liver-specific expression and efficient systemic gene delivery by HTV injection resulted in Gluc expression that was more than 4 orders of magnitude higher than background levels in the circulation at 24 hr post injection (Fig.6b), thus providing a superb window of opportunity to evaluate the accessibility of the BBB in vivo to peripheral Gluc. In all injected animals tested, the Gluc levels in capillary depleted brain samples were not significantly higher than those from control mice (p=0.20), although luciferase activity was detectable in some samples due to residual Gluc contaminant from robust levels of peripheral blood (more than 104-fold above controls). Taking together, the data suggested that secreted Gluc was unlikely to cross the BBB.
To explore the feasibility of localizing and quantifying the light sources inside the body of live animals by bioluminescent imaging, we performed in vivo 3D BLI using images taken at 560, 580 and 600 nm with diffuse luminescent image tomography algorism analysis (Fig.6c). Three-dimensional reconstruction images showed that the area with the most condensed and highest intensity of Gluc expression (voxel boxes) coincided with the liver/stomach, followed by the lung area. This was similar to the organ Gluc data obtained from tissue lysates of perfused animals (Fig.6a). However, luciferase activity in the kidney was not identified in the 3D image presumably because its location was too deep below the thoracic surface to contribute to the surface signals, although Gluc expression was detected in the area corresponding to the bladder. In vivo 3D bioluminescent imaging has been more challenging than 2D analysis due to additional complications regarding the depth/penetration of light sources, longer integration time and construction of whole body localization references that often require CT and/or MRI co-registration [28]. Gluc has the advantage of being the brightest among known luciferases, but also has the disadvantage of having the shortest half-life (flash). The rapid signal attenuation limits the sensitivity of Gluc in 3D BLI often requiring longer integration time. In addition, the relatively high background signals derived from secreted Gluc in the circulation of live animals make it more challenging to evaluate localized Gluc. In this study, we were able to identify the liver/stomach area in the abdomen and lung in the thorax as high Gluc-containing organs by 3D BLI, but could not distinguish organs (such as kidney) furthermost from the exposure surface.
Gluc uptake and clearance in different types of cells indicated the involvement of pinocytosis
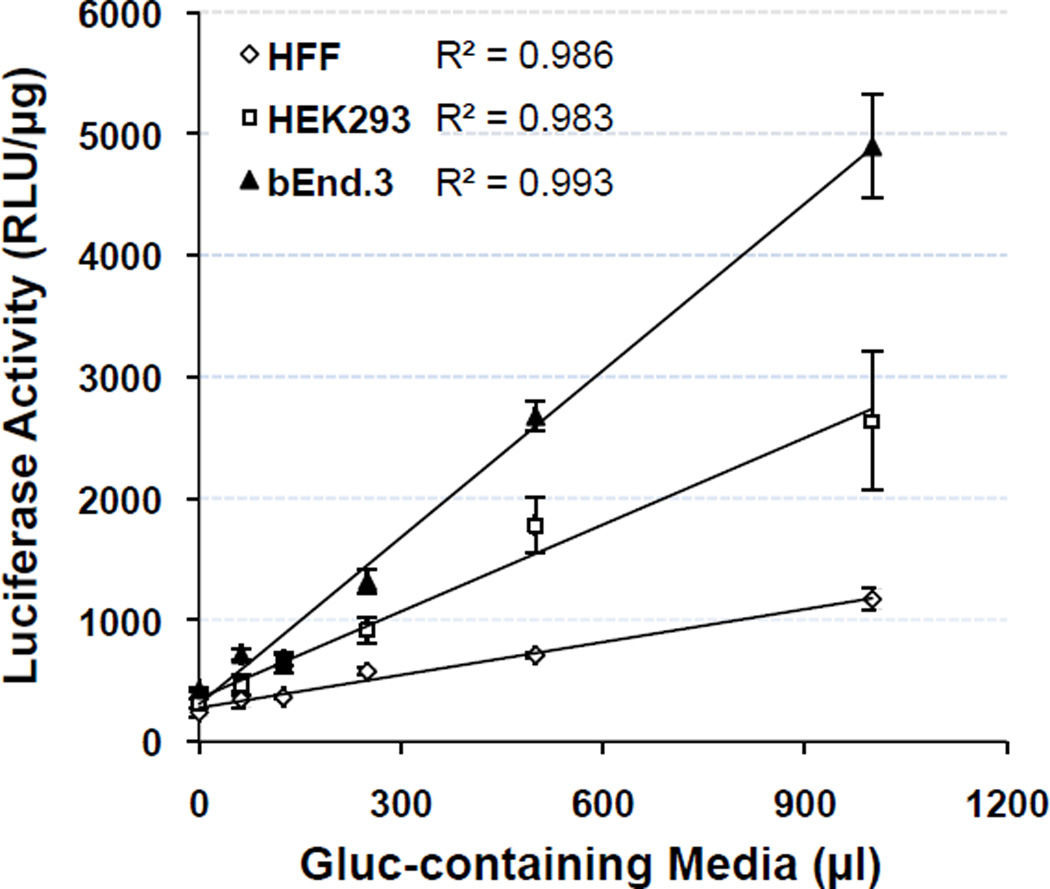
To get some insights into Gluc uptake at the cellular level, we evaluated its uptake and clearance in vitro in cell lines representing different cell types including human foreskin fibroblasts, human embryonic kidney cells and mouse brain endothelial cells (bEnd.3) (Fig.7–8). Dose-dependent uptake was observed in all three cell lines after 60 min of exposure to medium containing increasing amount of Gluc, with near perfect linear correlation (r2 >0.98). Interestingly, bEnd.3 cells exhibited the highest overall rate of internalization, followed by HEK293 cells (~50% of bEnd.3 levels), then HFF cells with the lowest rate (~20%) (Fig.7). No saturation was observed in any of the cell lines within the dosage range used in this experimental setting. This is consistent with the classical interpretation of a fluid-phase uptake mechanism, suggesting non-specific pinocytosis of Gluc by these cells. Pinocytosis (“cell-drinking”) is one of the major forms of endocytosis found in many living cells, with uptake rates varying among cell types, culture conditions and extracellular stimuli [29]. In fact, high levels of pinocytotic activity have been reported in human umbilical vein endothelial cells (largely via caveolae) for the uptake of Lucifer Yellow CH [30] and in dendritic cells for the uptake of soluble firefly luciferase [31]. The endothelial nature of bEnd.3 cells has been confirmed by morphology analysis, the expression of von Willebrand factor and the uptake of fluorescently labeled low-density lipoprotein [32]. HEK293 cells were derived from fetal kidney that is abundant for endothelial, fibroblastic and epithelial cells, although the exact nature of HEK293 cells is un-determined. Thus, the varying rates of Gluc uptake observed in the three different cell lines may likely be influenced by the inherited nature of each cell type for pinocytosis as the culture conditions were identical during the uptake process. Moreover, it is known that the barrier properties of the BBB restrict passage of most molecules into the brain parenchyma, unless they are less than 0.4–0.5 kD and highly lipophilic, or selectively recognized by the few but not-rare receptors on the BBB [33]. Receptor-mediated transcytosis is the main molecular transport system for protein transport across the BBB, which lacks fenestration. Thus the non-specific, non-receptor-mediated nature of Gluc uptake in various cell types supports the notion that Gluc would not cross the BBB as observed above.
Fig. 7.
Gluc uptake profile in various cell lines. Cells originating from human skin fibroblasts (HFF), embryonic kidney (HEK293) or brain endothelium (bEnd.3) were incubated with various volumes (62.5–1000 µl out of a total 1000 µl) of Gluc-containing media (~3000 RLU/µl) and evaluated for luciferase activities at various time points as indicated. Data for all cell types were derived from 2–3 independent experiments that were run in duplicate culture wells and are shown as mean ± SD.
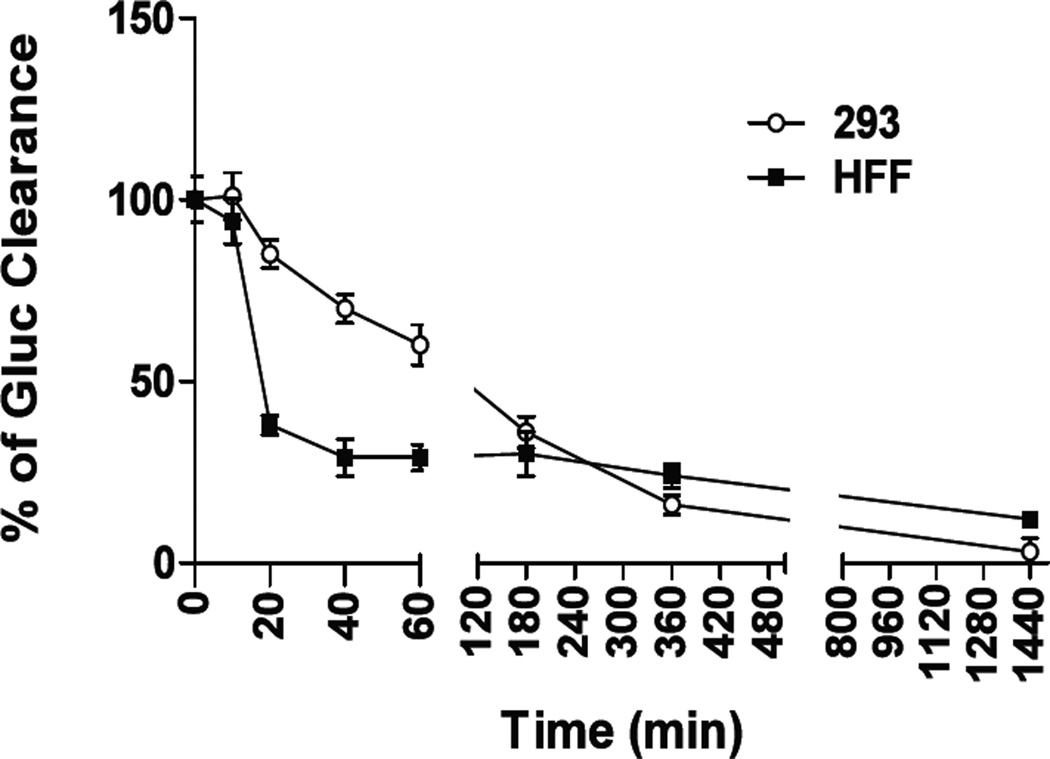
The stability of Gluc within cells or tissues would be of importance for data interpretation and experimental design. As shown in Fig.8, the clearance kinetics was evaluated in HFF and HEK293 cells by determining intracellular Gluc activities at varying times after the end of the uptake incubation. A biphasic curve was obtained for Gluc clearance in HFF cells, with a rapid reduction of luciferase activity from 10–20 min, followed by a relatively steady stage. Whereas a much slower but continuous reduction of Gluc was observed in HEK293 cells, reaching a plateau by 6 hr post uptake. The estimated half-life of Gluc is ~20 min in HFF cells and ~2 hr in HEK293 cells, in comparison to ~3 hr for firefly luciferase turnover in HepG2 cells [34]. To our knowledge, this is the first published data describing the half-life of Gluc in different cells in vitro. Several intracellular pathways have been described for the fate of endocytotic vesicles depending on the cell type and the agent being internalized, including transfer to the endosome/lysosome compartment for degradation, to the Golgi network via sorting endosome for special delivery, and exocytosis (as seen in trans-endothelial transport). Although the clearance pathways of Gluc are not within the scope of this study, the data on Gluc uptake and half-life can provide valuable information for experimental designs with repeated bioluminescent imaging.
Fig. 8.
Gluc clearance in HFF and HEK293 cells. Cells were incubated with 1 ml Gluc-containing medium (~3000 RLU/µl) for 1 hr, rinsed thoroughly with 1X PBS and cultured continuously for up to 1440 min (24 hr). Aliquots of cells from continuing cultures were harvested at various time points as indicated and analyzed for luciferase activity using a luminometer. Data were derived from 2–3 independent experiments that were run in duplicate culture wells and are shown as mean ± SEM.
In conclusion, Gaussia luciferase provides a sensitive tool as a naturally secreted reporter for in vivo monitoring of protein biodistribution following systemic delivery through the circulation. We characterized the Gluc natural uptake profile in nine peripheral organs, revealing kidney/bladder, stomach/intestine and lung as the major uptake organs. We also ascertained the inability of GLuc to cross the BBB or into the testis. The elimination of liver-generated Gluc from the body was likely through glomerular filtration of blood Gluc with subsequent renal excretion as well as biliary or fecal excretion. Moreover, our attempt to utilize three-dimensional BLI analysis in live animals localized the main internal Gluc sources to the liver/stomach and the lung, but with the limitation to identify Gluc in organs (such as the kidney) far deep from the exposure surface. Thus we demonstrated for the first time the feasibility of detecting major Gluc uptake organs by 3D BLI in live animals with excessive background signals in circulation. Using three cell lines, we assessed the kinetics of Gluc uptake and cellular clearance that implicated the likely involvement of non-specific, fluid-phase pinocytosis. These results suggest that Gaussia luciferase not only provides a useful tool for in vivo monitoring of protein biodistribution following systemic delivery, but also may serve as a sensitive biomarker for evaluation of BBB integrity. Our data on the natural uptake process of Gluc and its in vivo biodistribution may provide valuable information for other in vivo BLI applications of Gluc. More recently, it has been reported that two small structure repeat domains (71-amino acids) from the Gluc sequence have similar capability to catalyze the oxidation of substrate and emit photon signals as the full-size Gluc protein [35]. Thus, the option of including a small Gluc domain in a recombinant therapeutic or diagnostic agent would expand the prospect of potential application of Gluc as an in vivo reporter for systemic protein delivery.
Acknowledgements
We would like to thank Amber Edwards and Meghan Bromwell for technical assistance, and Comprehensive Mouse and Cancer Core, as well as Veterinary Services Division, for their help with animal manipulation. This work was supported by National Institutes of Health grant NS 064330 (to D.P.).
References
- 1.Bao R, Connolly DC, Murphy M, Green J, Weinstein JK, Pisarcik DA, Hamilton TC. Activation of cancer-specific gene expression by the survivin promoter. Natl Cancer Inst. 2002;9:522–528. doi: 10.1093/jnci/94.7.522. [DOI] [PubMed] [Google Scholar]
- 2.Chung E, Yamashita H, Au P, Tannous BA, Fukumura D, Jain RK. Secreted gaussia luciferase as a biomarker for monitoring tumor progression and treatment response of systemic metastases. PLoS. One. 2009;4:e8316. doi: 10.1371/journal.pone.0008316. [DOI] [PMC free article] [PubMed] [Google Scholar]
- 3.Hewett JW, Tannous B, Niland BP, Nery FC, Zeng J, Li Y, Breakefield XO. Mutant torsinA interferes with protein processing through the secretory pathway in DYT1 dystonia cells. Proc. Natl. Acad. Sci. USA. 2007;104:7271–7276. doi: 10.1073/pnas.0701185104. [DOI] [PMC free article] [PubMed] [Google Scholar]
- 4.Wurdinger T, Badr C, Pike L, de Kleine R, Weissleder R, Breakefield XO, Tannous BA. A secreted luciferase for ex vivo monitoring of in vivo processes. Nat Methods. 2008;5:171–173. doi: 10.1038/nmeth.1177. [DOI] [PMC free article] [PubMed] [Google Scholar]
- 5.Tannous BA, Kim DE, Fernandez JL, Weissleder R, Breakefield XO. Codon-optimized Gaussia luciferase cDNA for mammalian gene expression in culture and in vivo. Mol. Ther. 2005;11:435–443. doi: 10.1016/j.ymthe.2004.10.016. [DOI] [PubMed] [Google Scholar]
- 6.Verhaegen M, Christopoulos TK. Recombinant Gaussia Luciferase. Overexpression, Purifi cation, and Analytical Application of a Bioluminescent Reporter for DNA Hybridization. Anal. Chem. 2002;74:4378–4385. doi: 10.1021/ac025742k. [DOI] [PubMed] [Google Scholar]
- 7.Santos EB, Yeh R, Lee J, Nikhamin Y, Punzalan B, Punzalan B, La, Perle K, Larson SM, Sadelain M, Brentjens RJ. Sensitive in vivo imaging of T cells using a membrane-bound Gaussia princeps luciferase. Nat Med. 2009;15:338–344. doi: 10.1038/nm.1930. [DOI] [PMC free article] [PubMed] [Google Scholar]
- 8.Feng B, Tomizawa K, Michiue H, Han XJ, Miyatake S, Matsui H. Development of a bifunctional immunoliposome system for combined drug delivery and imaging in vivo. Biomaterials. 2010;31:4139–4145. doi: 10.1016/j.biomaterials.2010.01.086. [DOI] [PubMed] [Google Scholar]
- 9.Griesenbach U, Vicente CC, Roberts MJ, Meng C, Soussi S, Xenariou S, Tennant PBA, Baker E, Gordon C, Vrettou C, McCormick D, Coles R, Green AM, Lawton AE, S-J SG, Cheng SH, Scheule RK, Hyde SC, Gill DR, Collie DD, McLachlan, G A, E W. Secreted Gaussia luciferase as a sensitive reporter gene for in vivo and ex vivo studies of airway gene transfer. Biomaterials. 2011;32:2614–2624. doi: 10.1016/j.biomaterials.2010.12.001. [DOI] [PubMed] [Google Scholar]
- 10.Lee JY, Kim S, Hwang do W, Jeong JM, Chung JK, Lee MC, Lee DS. Development of a dual-luciferase reporter system for in vivo visualization of MicroRNA biogenesis and posttranscriptional regulation. J Nucl Med. 2008;49:285–294. doi: 10.2967/jnumed.107.042507. [DOI] [PubMed] [Google Scholar]
- 11.Inoue Y, Sheng F, Kiryu S, Watanabe M, Ratanakanit H, Izawa K, Tojo A, Ohtomo K. Gaussia luciferase for bioluminescence tumor monitoring in comparison with firefly luciferase. Mol Imaging. 2011;10:377–385. doi: 10.2310/7290.2010.00057. [DOI] [PubMed] [Google Scholar]
- 12.Hashimoto T, Adams KW, Fan Z, McLean PJ, Hyman BT. Characterization of oligomer formation of amyloid-beta peptide using a split-luciferase complementation assay. J Biol Chem. 2011;286:27081–27091. doi: 10.1074/jbc.M111.257378. [DOI] [PMC free article] [PubMed] [Google Scholar]
- 13.Venisnik KM, Olafsen T, Gambhir SS, Wu AM. Fusion of Gaussia luciferase to an engineered anti-carcinoembryonic antigen (CEA) antibody for in vivo optical imaging. Mol Imaging Biol. 2007;9:267–277. doi: 10.1007/s11307-007-0101-8. [DOI] [PubMed] [Google Scholar]
- 14.Herweijer H, Wolff JA. Gene therapy progress and prospects: hydrodynamic gene delivery. Gene Ther. 2007;14:99–107. doi: 10.1038/sj.gt.3302891. [DOI] [PubMed] [Google Scholar]
- 15.Kobayashi N, Nishikawa M, Takakura Y. The hydrodynamics-based procedure for controlling the pharmacokinetics of gene medicines at whole body, organ and cellular levels. Adv Drug Deliv Rev. 2005;57:713–731. doi: 10.1016/j.addr.2004.12.006. [DOI] [PubMed] [Google Scholar]
- 16.Miao CH, Ye X, Thompson AR. High-level factor VIII gene expression in vivo achieved by nonviral liver-specific gene therapy vectors. Hum Gene Ther. 2003;14:1297–1305. doi: 10.1089/104303403322319381. [DOI] [PubMed] [Google Scholar]
- 17.Wang D, Zhang W, Kalfa TA, Grabowski G, Davies S, Malik P, Pan D. Reprogramming erythroid cells for lysosomal enzyme production leads to visceral and CNS cross-correction in mice with Hurler syndrome. Proc Natl Acad Sci U S A. 2009;106:19958–19963. doi: 10.1073/pnas.0908528106. [DOI] [PMC free article] [PubMed] [Google Scholar]
- 18.Triguero D, Buciak J, Pardridge WM. Capillary depletion method for quantification of blood-brain barrier transport of circulating peptides and plasma proteins. J Neurochem. 1990;54:1882–1888. doi: 10.1111/j.1471-4159.1990.tb04886.x. [DOI] [PubMed] [Google Scholar]
- 19.Brooks AR, Harkins RN, Wang P, Qian HS, Liu P, Rubanyi GM. Transcriptional silencing is associated with extensive methylation of the CMV promoter following adenoviral gene delivery to muscle. J Gene Med. 2004;6:395–404. doi: 10.1002/jgm.516. [DOI] [PubMed] [Google Scholar]
- 20.Yew NS, Zhao H, Przybylska M, Wu IH, Tousignant JD, Scheule RK, Cheng SH. CpG-depleted plasmid DNA vectors with enhanced safety and long-term gene expression in vivo. Mol Ther. 2002;5:731–738. doi: 10.1006/mthe.2002.0598. [DOI] [PubMed] [Google Scholar]
- 21.Sawyer GJ, Rela M, Davenport M, Whitehorne M, Zhang X, Fabre JW. Hydrodynamic gene delivery to the liver: theoretical and practical issues for clinical application. Curr Gene Ther. 2009;9:128–135. doi: 10.2174/156652309787909535. [DOI] [PubMed] [Google Scholar]
- 22.Al-Dosari M, Zhang G, Knapp JE, Liu D. Evaluation of viral and mammalian promoters for driving transgene expression in mouse liver. Biochem Biophys Res Commun. 2006;339:673–678. doi: 10.1016/j.bbrc.2005.11.063. [DOI] [PubMed] [Google Scholar]
- 23.Liu F, Song Y, Liu D. Hydrodynamics-based transfection in animals by systemic administration of plasmid DNA. Gene Ther. 1999;6:1258–1266. doi: 10.1038/sj.gt.3300947. [DOI] [PubMed] [Google Scholar]
- 24.Loser P, Jennings GS, Strauss M, Sandig V. Reactivation of the previously silenced cytomegalovirus major immediate-early promoter in the mouse liver: involvement of NFkappaB. J Virol. 1998;72:180–190. doi: 10.1128/jvi.72.1.180-190.1998. [DOI] [PMC free article] [PubMed] [Google Scholar]
- 25.Contag CH, Bachmann MH. Advances in in vivo bioluminescence imaging of gene expression. Annu Rev Biomed Eng. 2002;4:235–260. doi: 10.1146/annurev.bioeng.4.111901.093336. [DOI] [PubMed] [Google Scholar]
- 26.Tromberg BJ, Shah N, Lanning R, Cerussi A, Espinoza J, Pham T, Svaasand L, Butler J. Non-invasive in vivo characterization of breast tumors using photon migration spectroscopy. Neoplasia. 2000;2:26–40. doi: 10.1038/sj.neo.7900082. [DOI] [PMC free article] [PubMed] [Google Scholar]
- 27.Tannous BA. Gaussia luciferase reporter assay for monitoring biological processes in culture and in vivo. Nat Protoc. 2009;4:582–591. doi: 10.1038/nprot.2009.28. [DOI] [PMC free article] [PubMed] [Google Scholar]
- 28.Klose AD, Beattie BJ. Bioluminescence tomography with CT/MRI co-registration. Conf Proc IEEE Eng Med Biol Soc. 2009;2009:6327–6330. doi: 10.1109/IEMBS.2009.5333170. [DOI] [PubMed] [Google Scholar]
- 29.Johannes L, Lamaze C. Clathrin-dependent or not: is it still the question? Traffic. 2002;3:443–451. doi: 10.1034/j.1600-0854.2002.30701.x. [DOI] [PubMed] [Google Scholar]
- 30.Catizone A, Medolago Albani L, Reola F, Alescio T. A quantitative assessment of non specific pinocytosis by human endothelial cells surviving in vitro. Cell Mol Biol. 1993;39:155–169. [PubMed] [Google Scholar]
- 31.Giodini A, Cresswell P. Hsp90-mediated cytosolic refolding of exogenous proteins internalized by dendritic cells. EMBO J. 2008;27:201–211. doi: 10.1038/sj.emboj.7601941. [DOI] [PMC free article] [PubMed] [Google Scholar]
- 32.Montesano R, Pepper MS, Mohle-Steinlein U, Risau W, Wagner EF, Orci L. Increased proteolytic activity is responsible for the aberrant morphogenetic behavior of endothelial cells expressing the middle T oncogene. Cell. 1990;62:435–445. doi: 10.1016/0092-8674(90)90009-4. [DOI] [PubMed] [Google Scholar]
- 33.Pardridge WM. Blood-brain barrier delivery. Drug discovery today. 2007;12:54–61. doi: 10.1016/j.drudis.2006.10.013. [DOI] [PubMed] [Google Scholar]
- 34.Thompson JF, Hayes LS, Lloyd DB. Modulation of firefly luciferase stability and impact on studies of gene regulation. Gene. 1991;103:171–177. doi: 10.1016/0378-1119(91)90270-l. [DOI] [PubMed] [Google Scholar]
- 35.Inouye S, Sahara Y. Identification of two catalytic domains in a luciferase secreted by the copepod Gaussia princeps. Biochem Biophys Res Commun. 2008;365:96–101. doi: 10.1016/j.bbrc.2007.10.152. [DOI] [PubMed] [Google Scholar]


