Abstract
Mesoporous silica nanospheres (MSNs) are a promising material for magnetic resonance imaging (MRI) contrast agents. In this paper multifunctional MSNs with cleavable Gd(III) chelates are synthesized and characterized, and their applicability as MRI contrast agents is demonstrated both in vitro and in vivo. The MSNs contain Gd(III) chelates that are covalently linked via a redox-responsive disulfide moiety. The MSNs are further functionalized with polyethylene glycol (PEG) and an anisamide ligand to improve their biocompatibility and target specificity. The effectiveness of MSNs as an MRI imaging contrast agent and their targeting ability are successfully demonstrated in vitro using human colon adenocarcinoma and pancreatic cancer cells. Finally, the capability of this platform as an in vivo MRI contrast agent is tested using a 3T scanner. The Gd(III) chelate was quickly cleaved by the blood pool thiols and eliminated through the renal excretion pathway. Further tuning of the Gd(III) chelate release kinetics is needed before the MSN system can be used as target-specific MRI contrast agents in vivo.
1. Introduction
Among the various imaging technologies, magnetic resonance imaging (MRI) is one of the most powerful noninvasive techniques not only in clinical diagnosis but also in biomedical research.[1] Due to the low sensitivity of MRI, chemical compounds known as contrast agents are usually introduced to enhance the image contrast between normal and diseased tissues. Such small molecule contrast agents typically have a very short blood circulation time as well as a nonspecific biodistribution. As such, a large amount of agent is required, which can cause many unwanted side effects.[2] Some of the clinically used Gd-containing contrast agents have been recently shown to be the culprit for a potentially fatal condition known as nephrogenic systemic fibrosis (NSF) in patients with severely impaired renal function.[3] It is believed that slower clearance of the Gd(III) chelates in these patients leads to the leaching of Gd3+ ions, resulting in toxicity.[4]
Several nanoparticulate gadolinium-based MRI contrast agents have been reported in the literature. These nanoprobes are constructed based on polymers, dendrimers, liposomes, and hybrid platforms.[5] These systems have demonstrated superior contrast enhancement during MR imaging compared with current commercially available gadolinium complexes. Unfortunately, most of them are limited by their slow excretion after the MRI examination, which consequently leads to the long-term tissue accumulation of toxic Gd3+ ions.[6] Recently, new strategies based on redox-responsive polymeric MRI contrast agents have been reported.[7] The working principle of this platform is based on the in vivo lability of disulfide bonds in the presence of blood pool reducing agents such as cysteine and glutathione. These polymeric platforms have shown a good clearance rate with moderate T1/T2 relaxivities and Gd3+ loadings.[8] It is critical to develop nanomaterials for potential clinical applications that cannot only carry higher payloads of gadolinium chelates, but can also be quickly cleared from the body after carrying out their diagnostic function.
We and others have recently reported the development of mesoporous silica nanosphere (MSN)-based MRI contrast agents.[9] We have demonstrated that this platform has an extraordinary ability to enhance MR images both in vitro and in vivo. We have previously shown that the nanoparticles are transported to the liver and cleared very slowly. Indeed, we were able to observe significant T2-weighted enhancement in the liver of a mouse up to 17 days after injection. To fully exploit the potential of MSNs as MR imaging contrast agents we hypothesized that the Gd(III) chelates can be incorporated into the MSN framework via labile disulfide bonds. The disulfide-thiol exchange reaction with endogenous thiols can break down the disulfide linker, facilitating the renal excretion of the Gd complexes (Scheme 1). In addition, polyethylene glycol (PEG) chains and targeting groups can be further attached to the MSNs to enhance their biocompatibility and targeting specificity.[10] In this paper, we report the synthesis and characterization of multifunctional MSNs containing cleavable Gd(III) chelates and their applications as MRI contrast agents for both in vitro and in vivo MR imaging.
Scheme 1.
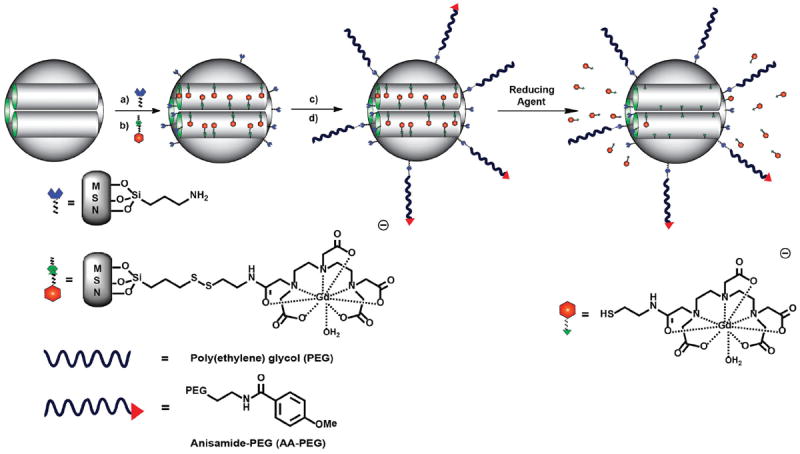
Synthesis of multifunctional PEG–Gd–MSNs and AA–Gd–MSNs. a) Grafting of AP-TES to as-made MSNs. b) The surfactant-template CTAB was removed by acidic extraction and the Gd-complex 4 was grafted into the MSN channels. c) MeO-PEG(5K) carboxylic acid was reacted with the amino groups on the external surface of the MSNs by an EDC coupling reaction. d) An Anisamide-PEG(5K)triethoxysilane derivative was further grafted onto the surface of the MSN material to finally afford AA–Gd–MSNs. The molecular MR imaging contrast agent can be degraded from the silica nanoparticle through a disulfide–thiol exchange reaction with endogenous reducing agents and cleared from the animal’s body via renal excretion.
2. Results
2.1. Synthesis and Characterization of Gd–MSNs, PEG–Gd–MSNs, and AA–Gd–MSNs
2.1.1. Synthesis of Gd–MSNs, PEG–Gd–MSNs, and AA–Gd–MSNs
To construct the MSN-based MRI contrast agent, MSNs containing large pores were synthesized according to a procedure reported in the literature.[11] The as-prepared MSNs were grafted with aminopropyltriethoxysilane (AP-TES) to afford AP-MSNs, which were then washed with an acidic methanol solution to remove the surfactant-template and then treated with 4 to afford Gd–MSNs (Scheme 1). Gd complex 4 was synthesized via a multistep procedure. First, cysteamine-HCl was reacted with 2,2′-dithiodipyridine to afford 1 (Scheme 2).[12] Compound 1 was reacted with diethylenetriaminepentaacetic acid (DTPA) bis-anhydride to afford the monosubstituted DTPA ligand, which was metallated with Gd3+ ions under basic conditions to afford Gd complex 3. Finally, the desired Gd complex 4 was obtained via a disulfide–thiol exchange reaction with 3-mercaptopropyltriethoxysilane.
Scheme 2.
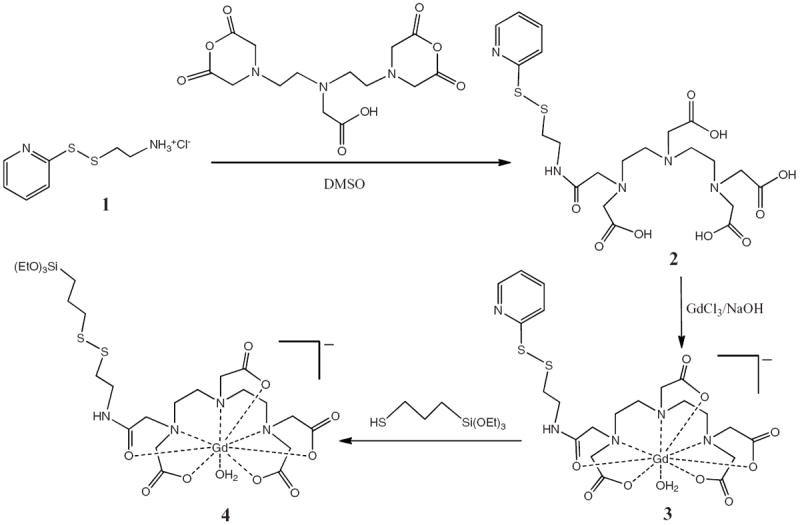
Gd complex 4 was synthesized by a multistep procedure. The reaction of 1 with DTPA bis-anhydride affords the mono-substituted DTPA ligand 2. The metallation of 2 with GdCl3 under basic conditions affords Gd complex 3. Finally, Gd complex 4 is achieved through a disulfide–thiol exchange reaction with 3-mercaptopropyltriethoxysilane.
Taking advantage of the high density of amino groups grafted on the exterior surface of Gd–MSNs, this material was functionalized with MeO–PEG(5K) carboxylic acid through a 1-ethyl-3-(3-dimethylaminopropyl) carbodiimine(EDC)-mediated coupling reaction in PBS (1 mm, pH 7.4). In addition, to demonstrate the versatility of PEG–Gd–MSNs as an MR imaging contrast agent, the material was further functionalized by grafting an AA-PEG(5K)-triethoxysilane derivative containing anisamide (AA) as a targeting group to cancer cells that overexpress sigma receptors (Scheme 1). The synthesis of the AA–Gd–MSNs is described in detail in the Experimental Section and SI.
2.1.2. Determination of the Morphology and Structural Properties of Gd–MSNs, PEG–Gd–MSNs, and AA–Gd–MSNs
The particle sizes and morphologies of the synthesized MSNs were characterized by transmission and scanning electron microscopies (TEM and SEM, respectively) and dynamic light scattering (DLS). The SEM and TEM micrographs revealed uniform spherically-shaped nanoparticles with an average diameter of ≈90 nm (Figure 1). No change was observed by TEM or SEM in the particle size or morphology upon grafting of the Gd complex or the PEG chain. However, the colloidal performance of these MSN materials in simulated physiological conditions (10 mM PBS, pH 7.4) was completely different as determined by DLS. AP–MSNs and Gd–MSNs typically aggregated in PBS solutions as shown by the micrometer-sized hydrodynamic diameter (see Table 1 and Figure S2, Supporting Information (SI)). In contrast, after PEGylation, the PEG –Gd–MSNs formed a stable colloidal solution with a hydrodynamic diameter of ≈146 nm. This value did not change significantly with the addition of the anisamide–PEG derivative (Table 1).
Figure 1.
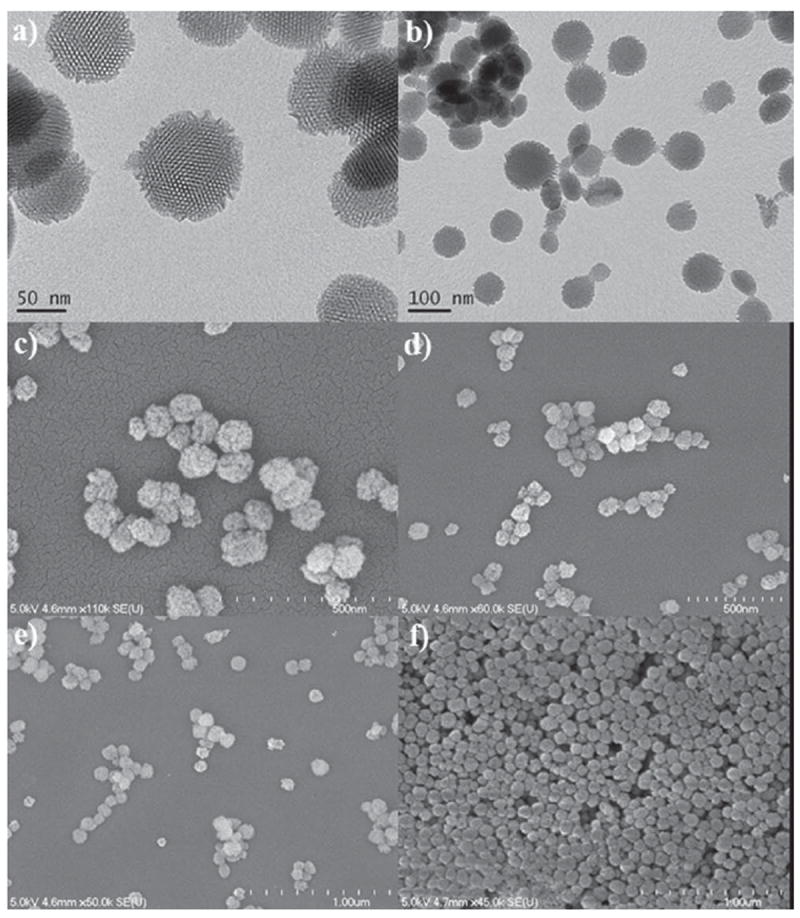
TEM images of AP–MSNs (a) and Gd–MSNs (b), and SEM images of Gd–MSNs (c,d) and PEG–Gd–MSNs (e,f).
Table 1.
Properties of Gd-functionalized MSN materials.
| Sample | SBET [m2 g−1] | DBJH [nm] | ξ-potential [mV] | Z-average [nm] | PDI | Δ Weight loss [%] |
|---|---|---|---|---|---|---|
| AP–MSNs | 1535 | 4.6 | +14.0 ± 0.9 | 1262 | 0.149 | 3.4 |
| Gd–MSNs | 1384 | 3.8 | −3.8 ± 0.5 | 3068 | 0.376 | 17.5 |
| PEG–Gd–MSNs | 872 | 3.6 | −3.3 ± 0.5 | 145.7 | 0.380 | 6.2 |
| AA–Gd–MSNs | 793 | 3.8 | −2.3 ± 0.8 | 158.7 | 0.350 | 2.7 |
The mesoporous structure of AP–MSNs, Gd–MSNs, and PEG–Gd–MSNs were characterized by TEM and nitrogen sorption isotherms. The TEM image of AP–MSNs exhibited a honeycomb-like mesoporous structure characteristic of MCM–41 materials (Figure 1a). The light-colored spots, which represent the openings to the mesopores of the MSNs, were packed in a hexagonal symmetry, forming a typical MCM-41-type mesoporous structure. The MSNs, Gd-MSNs, and PEG-Gd-MSNs exhibited type-IV N2 sorption isotherms, indicative of a cylindrical channel-like mesoporous structure (see Figure S3, SI). The Brunauer–Emmitt–Teller (BET) surface area and Barrett-Joiner-Halenda (BJH) pore diameter for AP–MSNs were 1535 m2g−1 and 4.6 nm respectively. After coating with the Gd-complex a slight decrease in both BET surface area and BJH pore diameter was observed (1384 m2g−1 and 3.8 nm respectively). Further functionalization with MeO–PEG(5K)–carboxylic acid and an AA–PEG(5K)–triethoxysilane derivative resulted in a lower BET surface area of 872 and 793 m2g−1 respectively. The pore diameters did not change upon these functionalizations (Table 1).
The surface charge (ζ-potential) of these nanomaterials was determined by measuring their electrophoretic mobilities. After functionalization with AP–TES the AP–MSNs presented a positive surface charge (+ 14.0 mV), which arises from the amino groups that are partially protonated. Further grafting of the negatively-charged Gd complex 4 reduced the ζ-potential value to −3.8 mV. Moreover, after the coupling reaction with MeO–PEG(5K) carboxylic acid we did not observe a significant change to the surface charge for PEG–Gd–MSNs (Table 1). Similarly, further addition of the anisamide–PEG(5K)triethoxysilane derivative did not change the ζ-potential value for the AA–Gd–MSN material.
The stability of the bound Gd–chelate was demonstrated by the lack of Gd leaching after extensive washings with acidic buffer (see Figure S9, SI). We also carried out control experiments with MSNs containing physisorbed Gd3+ ions or compound 3; in both cases the majority of the Gd species leached into the supernatants upon washing with acidic buffer (see Figure S10, SI).
2.1.3. Determination of the Amount of Functional Groups on the Surfaces of AP–MSNs, Gd–MSNs, PEG–Gd–MSNs, and AA–Gd–MSNs
Thermogravimetric analysis (TGA) and inductively-coupled plasma mass spectrometry (ICP-MS) were used to determine the amounts of both organics and Gd3+ in the MSN materials. The total weight loss of AP–MSNs was about 3.4 wt% which, after subtracting the solvent weight loss, corresponded to ≈0.6 mmol g−1 of amino groups on the surface of the MSNs (see Table 1 and Figure S4, SI). The first and second coatings of Gd complex 4 resulted in a 5.2 and 12.3 wt% organic weight loss, respectively. From these results, a total Gd-chelate loading of 0.332 mmol g−1 was calculated. This amount was further corroborated by ICP-MS, where 5.18 wt% of Gd (0.329 mmol g−1) was determined. In addition, after PEGylation a further 6.2 wt% loss was observed, which confirmed the successful functionalization of Gd–MSNs with MeO–PEG(5K) carboxylic acid chains (Table 1). Finally, the incorporation of the anisamide into the PEG–MSNs resulted in a 2.7 wt% loss, which indicates the successful grafting of the anisamide–PEG(5K) triethoxysilane derivative.
2.2. T1-Weighted MR Imaging with Gd–MSNs and PEG–Gd–MSNs
The T1-weighted MRI relaxivities of the Gd–MSNs before and after coating with MeO–PEG(5K) carboxylic acid were measured using a 3T MR scanner. Samples of these materials containing different concentrations of Gd3+ were prepared to determine the longitudinal (r1) and transverse (r2) relaxivities. The particles exhibited very large r1 and r2 relaxivities as shown in Figure 2. On a per mm Gd3+ basis, the Gd–MSN and PEG–Gd–MSN particles have an r1 of 19.0 and 25.7 mm−1 s−1 and r2 of 46.8 and 56.0 mm−1 s−1, respectively.
Figure 2.
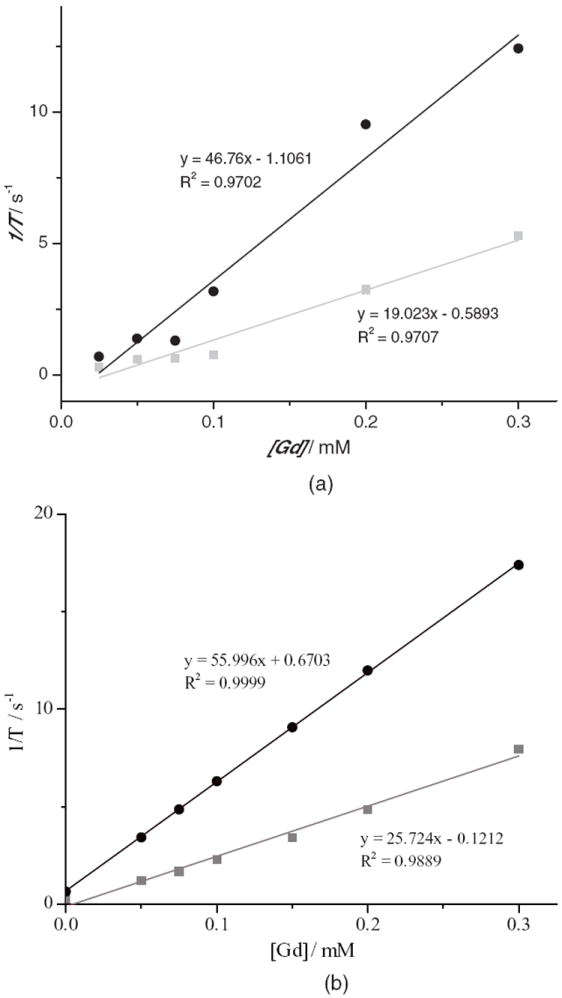
Longitudinal (r1, squares) and transverse (r2, circles) MR relaxivity plots for Gd–MSNs (a) and PEG–Gd–MSNs (b).
2.3. Redox-Responsive Performance of PEG–MSNs in Simulated Physiological Conditions
To determine the rate of disulfide bond cleavage needed to release the Gd–chelate (degradability) from the PEG–MSNs in the presence of reducing agents, a release profile was carried out with 10 mM cysteine in order to simulate the endogenous reducing environment. A suspension of the particles in PBS (1 mM, pH 7.4) was placed inside a piece of dialysis tubing with a molecular weight cut-off of 3500. The dialysis bag was then submerged in 400 mL of degassed PBS at 37 °C. The entire vessel was maintained under a nitrogen atmosphere. Aliquots of the solution were removed at different time points to determine any Gd3+ that was released before the addition of cysteine. After 12 h, a 50 mL aliquot of PBS was removed from the vessel, and was replaced with a 50 mL solution containing l-cysteine·HCl (0.63 g, 4.0 mmol), for a final cysteine concentration of 10 mM. Aliquots of the dialysis solution were then removed at various time points, and the Gd3+ concentration was measured by ICP-MS. Figure 3 displays the release profile of the Gd complex from the material. The material has a half-life (t1/2) around 35 h and completely degrades in 90 h.
Figure 3.
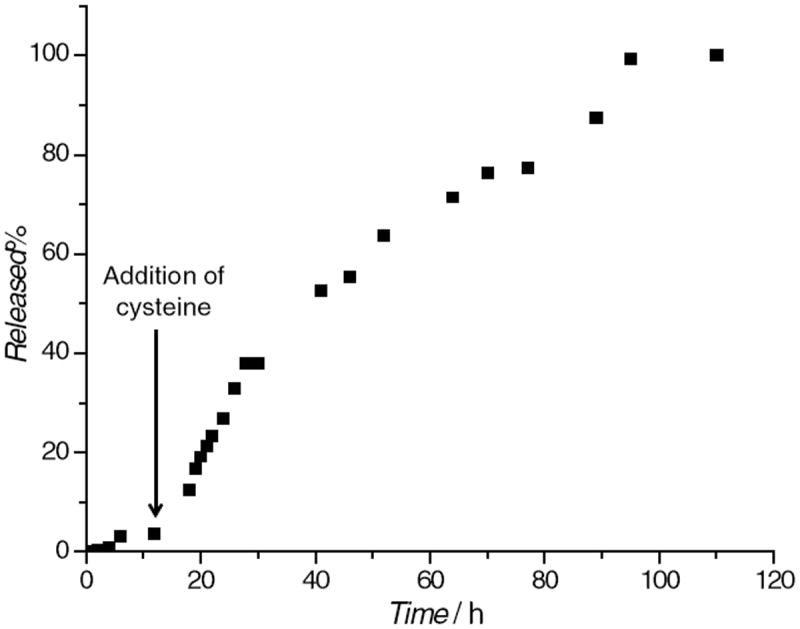
Release profile of the Gd complex from PEG–Gd–MSNs in the presence of 10 mM cysteine at 37 °C.
2.4. In Vitro Behavior of Gd–MSNs, PEG–Gd–MSNs, and AA–Gd–MSNs
Confocal laser scanning microscopy (CLSM) was used to evaluate the cellular internalization of Gd–MSN into HT-29 human colon adenocarcinoma cells. Gd–MSNs were labeled with rhodamine B isothiocyanate (RITC) as an optical imaging agent. Confocal imaging of cells incubated with various concentrations of rhodamine B-labeled Gd–MSN particles showed a dose-dependant uptake of the particles (Figure 4a–c). Specifically, these images are superimposed micrographs of the DIC and RITC channels showing the control without RITC–Gd–MSNs (Figure 4a), RITC–Gd–MSN (0.1 mg mL−1) (Figure 4b), and RITC–Gd–MSN (0.4 mg mL−1) (Figure 4c). Further studies demonstrated that these particles act as efficient T1-weighted contrast agents for in vitro imaging using a 9.4 T MR scanner (Figure 5a). The targeting ability of the AA–Gd–MSN system was demonstrated in vitro using AsPC-1 pancreatic cancer cells. Gd–MSNs, PEG–Gd–MSNs, and AA–Gd–MSNs were labeled with a silyl derivative of fluorescein isothiocyanate (FITC). AsPC-1 cells were cultured in a 6-well plate containing silanized coverslips at 3 × 10⁵ cells per well. These cells were then inoculated with three MSN materials and incubated for 4 h. The cellular uptake of these nanoparticles was monitored by CLSM (Figure 4 d–f). These images are superimposed micrographs of the DIC and FITC channels. The observed green fluorescence in these figures corresponds to each FITC-labeled MSN material: Gd–MSNs (Figure 4d), PEG–Gd–MSN (Figure 4e), and AA–Gd–MSN (Figure 4f). As can be observed from the micrographs, the internalization of the mesoporous materials was drastically different depending on the surface functionalization of each nanoparticle. AA–Gd–MSNs were internalized in a higher proportion than the other samples due to the presence of the high affinity sigma receptor ligand anisamide. To further demonstrate the targeting ability and T1-weighted MR imaging enhancement efficiency of AA–Gd–MSNs, AsPC-1 cell pellets were prepared as described in the Experimental Section and the T1-weighted images were acquired using a 3T scanner. The MR images clearly displayed an increase in contrast enhancement of AsPC-1 cells due to the PEGylated MSNs and AA–Gd–MSNs (Figures 5b and 5c). To corroborate the targeting ability of AA–MSNs, the amount of Gd3+ in each AsPC-1 cell pellet was measured by ICP–MS. The amount of Gd3+ internalized by the cells was determined to be 30.3, 53.8, and 71.8 ng for Gd–MSNs, PEG–Gd–MSNs, and AA–Gd–MSNs, respectively. These data further support the enhanced uptake of the AA–Gd–MSN material by AsPC-1 cells due to the targeting ability of the anisamide group.
Figure 4.
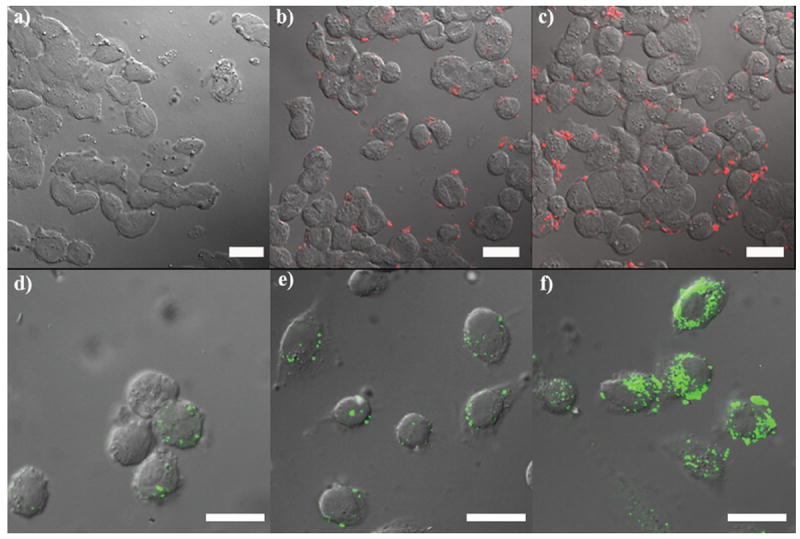
Confocal microscope images of HT-29 (upper row) and AsPC-1 (lower row) cells incubated with MSN-based materials. The upper row depicts HT-29 cells incubated without RITC–Gd–MSN (control sample) (a), with RITC–Gd–MSN (0.1 mg mL−1) (b), and with RITC–Gd–MSN (0.4 mg mL−1) (c). The lower row shows confocal fluorescence images of AsPC-1 cells incubated with 0.03 mg mL−1 of FITC–Gd–MSNs (d), FITC–PEG–Gd–MSNs (e), and FITC–AA–Gd–MSNs (f). Scale bars represent 25 μm.
Figure 5.
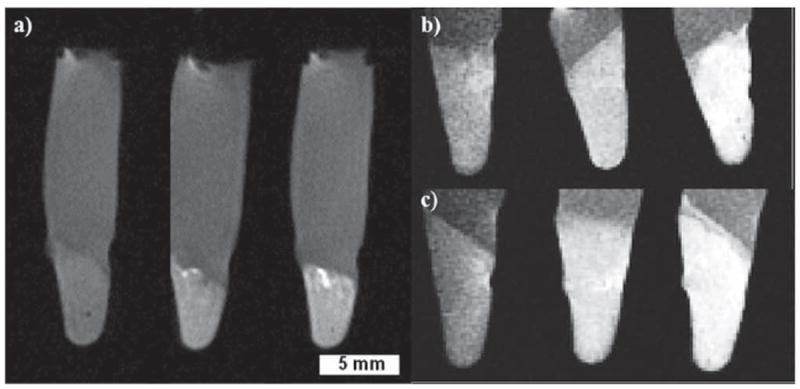
T1-weighted images of HT-29 and AsPC-1 cell pellets, with a cell density of 6.0 × 10⁶ cells per pellet. a) HT-29 cells incubated with the MSN control pellet (no Gd–MSN, left), 0.025 mg mL−1 of Gd–MSN (middle), and 0.05 mg mL−1 Gd–MSN (right). b) AsPC-1 cells incubated with 0.100 mg mL−1 of Gd–MSNs (left), PEG–Gd–MSNs (middle), and AA–Gd–MSNs (right). c) AsPC-1 cells incubated with 0.150 mg mL−1 of Gd–MSNs (left), PEG–Gd–MSNs (middle), and AA–Gd–MSNs (right).
2.5. In Vivo Performance of PEG–Gd–MSNs
In vivo contrast enhanced MR imaging using PEG–Gd–MSNs was carried out in female nude mice on a 3T scanner. T1-weighted MR images of the abdomen and pelvis were acquired on a Siemens Allegra 3T head-only clinical MR scanner using a 2D spin echo pulse sequence and a custom-made, birdcage, volume transmit/receive coil measuring 4 cm in diameter. Figure 6 shows T1-weighted MR images precontrast and then at 5, 15, 30 and 45 min intervals after the injection of PEG–Gd–MSNs at a dose of 0.080 mmol kg−1 Gd via tail vein injection. Strong enhancement was observed in the urinary bladder 15 min post injection, indicating renal excretion of the Gd(III) chelates cleaved from the MSN materials (Figure 6). Additional accumulation of the Gd complex was observed in the urinary bladder, resulting in increased contrast enhancement over time. This result was corroborated with a second mouse, but with a higher amount of PEG–Gd–MSNs (see Figure S13, SI).
Figure 6.

MR images of a nude mouse intravenously injected with PEG–Gd–MSN (0.080 mmol kg−1 Gd dose), focusing on the urinary bladder (white arrow). The MR images were taken at different times: precontrast (a), 5 min (b), 15 min (c), 30 min (d), and 45 min (e). The enhanced contrast in the bladder was apparent after 15 min, indicating that the Gd–chelate biodegraded from PEG–Gd–MSNs by the reducing agents in the blood was quickly cleared through the renal pathway.
3. Discussion
Our group was the first to demonstrate the potential of MSNs grafted with Gd–chelates as MR imaging contrast agents.[9a] The work described herein expands this approach toward the design, synthesis, and application of multifunctional MSNs containing cleavable Gd(III) chelates. We envision that this platform can provide a potential alternative to alleviate recent concerns regarding the toxicity of nanoparticulate gadolinium-based contrast agents.[4,13] Ideal MRI nanoprobes should provide efficient MRI contrast enhancement as well as exhibit stealth and target-specific features. Furthermore, they should be biodegradable such that the nanoprobes can degrade quickly and be cleared by the body in a timely fashion after accomplishing their diagnostic function. Several levels of functionalization have to be implemented in order to achieve these complicated and challenging tasks. First, we needed to design a Gd–chelate that can be detached from the nanoparticles under specific conditions such as a change in pH or redox environment. The Gd complex 4 is attached to the nanoparticles via a redox-responsive disulfide bond, which can be cleaved in the presence of reducing agents, such as the ones present in the blood pool.[14] Specifically, we grafted the Gd–complex to the nanochannels in the MSNs.
The TEM, SEM, and N2 sorption isotherms indicated the successful synthesis of uniform MSNs with an average diameter of 90 nm, a large pore size (4.6 nm), and a high surface area (1535 m2 g−1). The morphology and mesoporous structure were not disrupted by the multi-step functionalization processes (Figure 1). A reduction in the surface area and pore diameter was observed for the modified MSN materials (see Table 1). The amount of Gd(III) chelates incorporated on the MSNs was quantified by TGA and ICP-MS to be as high as 17.5 wt%. The successful grafting of Gd–complex into the MSNs was further demonstrated by a decrease in the ζ-potential from +14.0 to −3.8 mV.
Among many different coating strategies that endow nanoparticles with the ability to avoid the reticuloendothe-lial system (RES), PEGylation is the preferred method of imparting stealth properties to nanoparticles.[15] We used a MeO–PEG(5K)carboxylic acid derivative to modify the surface of Gd–MSNs. The PEGylated nanoparticles displayed stable colloidal properties due to the steric effects of PEG on the surface of the particles. In contrast, the materials that were not coated with PEG severely aggregated under physiological conditions. The presence of the PEG coatings was indicated by an increased TGA weight loss of 6.2 wt%.
The final level of functionalization for the MSNs was to endow this platform with target specificity. We modified PEG–Gd–MSNs with a PEG(5K)triethoxysilane derivative containing anisamide (AA) as a targeting moiety. This AA ligand has been recently reported as an efficient targeting group for sigma receptors.[16] Recent research has demonstrated that sigma receptors are overexpressed in a variety of human and rodent tumor cell lines.[17] TGA analysis suggested the successful functionalization of the Gd–MSNs with the AA–PEG(5K)triethoxysilane derivative (Table 1).
The MRI contrast enhancing abilities of the Gd–MSN and PEG–Gd–MSN particles were evaluated. On a per mM Gd basis, Gd–MSNs possessed an r1 relaxivity of 19.0 mm−1 s−1 and an r2 of 46.8 mm−1 s−1 at 3 T, whereas the PEG–Gd–MSNs had an r1 relaxivity of 25.7 mm−1 s−1 and an r2 of 56.0 mm−1 s−1 at 3 T. These relaxivity values are comparable to those of noncleavable Gd-MSNs previously reported by our group.[9a] These relaxivity values are much larger than the polydisulfide Gd-complexes previously reported. For example, the relaxivities of these polymer-based MRI contrast agents usually range between 4.5–12.0 and 5.8–13.1 mm−1 s−1 for r1 and r2, respectively.[7a,8c] We attribute the enhanced MR relaxivities to the ability of water molecules to easily access the pores of the MSN particles.
The in vitro performance of the Gd–MSN material was evaluated using HT-29 colon adenocarcinoma cells. The confocal images of Rhodamine B-labeled Gd–MSN particles showed that their uptake is dose dependent (Figure 4a–c). The effectiveness of Gd–MSNs as an in vitro T1-weighted MR imaging contrast agent was demonstrated on a 9.4 T scanner (Figure 5a). Moreover, the dose dependent uptake of Gd–MSNs in HT-29 cells was further confirmed by cell phantom images. The T1-weighted images clearly indicated that an increase in the dose of Gd–MSNs resulted in a higher contrast enhancement of the cell pellet. An anisamide targeting group was attached to the particles to render this nanosized MR imaging platform specific to cancer cells that overexpress sigma receptors.[16] It has been reported that sigma receptors (e.g., sigma-2) are more highly expressed in pancreatic cancer cells compared to normal pancreatic cells.[18] We studied the uptake behaviors of FITC-labeled Gd–MSN, PEG–Gd–MSN, and AA–Gd–MSN materials in AsPC-1 human pancreatic cancer cells. Both confocal (Figures 4d–f) and MRI images (Figures 5b and 5c) displayed a drastic difference in the uptake of these materials. Samples containing the anisamide ligand showed a higher amount of nanoparticles were taken up by the AsPC-1 cells (Figure 4f), which was confirmed by measuring the amount of Gd3+ internalized in each cell pellet by ICP-MS.
In addition, competitive binding assay experiments with the anisamide ligand confirmed the targeting ability of AA–Gd–MSN. Both confocal microscopic imaging and ICP-MS analyses indicated that pre-incubation of the AsPC-1 cells with PEG–anisamide (1 mM) significantly reduced the uptake of AA–Gd–MSN but not PEG–Gd–MSN when compared to those without pre-incubation with the anisamide ligand (Figures S6–S8, SI).
The present nanoparticulate MRI probe contains cleavable Gd(III) chelates by taking advantage of the well-established disulfide–thiol exchange reaction in biological systems.[7b,14] The degradability of the Gd complex was tested by incubating PEG–Gd–MSNs in the presence of cysteine (10 mM) under simulated physiological conditions. The release profile of the Gd complex indicated that the disulfide–thiol exchange reaction between the reducing agent and the disulfide bond anchoring the Gd complex to the PEG–Gd–MSNs occurred immediately after the addition of cysteine (Figure 3). The material has a half-life (t1/2) of about 35 h and completely degrades within 90 h, suggesting that the Gd(III) chelates can be cleaved from MSNs by blood pool thiols.
We have previously shown that the MSN-based MRI contrast agent with noncleavable Gd(III) chelates was transported to the liver and was cleared very slowly.[9a] To evaluate the in vivo performance of the PEG–Gd–MSNs, contrast-enhanced images of a female nude mouse were obtained on a 3T scanner. Little enhancement was observed in the blood pool and liver for the MSN-based MR imaging agent (see Figures S11 and S12, SI). However, a strong enhancement was observed in the urinary bladder 15 min postinjection, indicating renal excretion of the cleaved Gd(III) chelates (Figure 6). The in vivo release of the Gd(III) chelates from the MSN materials presumably occurred via a disulfide displacement reaction with plasma thiols. Since the size of the Gd complex is smaller than the renal filtration threshold (approximately 8 nm), the released Gd(III)–chelates were able to be readily removed from blood circulation through renal filtration.[6] Consequently, the small Gd complexes gradually accumulated in the urinary bladder resulting in increased contrast enhancement over time, as shown in Figure 6. It is interesting to note that despite the relative stability of the disulfide linker observed under simulated conditions (t1/2 = 35 h), the Gd complex was quickly cleaved from the MSNs in vivo, in a matter of minutes. As a result, the present MSN contrast agents with the disulfide-linked Gd(III)–chelates do not possess proper pharmacokinetics to allow their use in target-specific MR imaging in vivo. This is consistent with the labile nature of disulfides in circulating blood, as reported previously.[14] The cleavage of the Gd–chelate from the MSNs occurred faster than the polydisulfide Gd complexes in vivo,[7a,8c,19] presumably due to the readily accessible disulfide linkage to blood-pool thiols via the large channels of the MSNs. These data indicate that the in vivo disulfide–thiol exchange kinetics can be drastically different from that obtained under the simulated conditions, either because of enhanced transport of the thiol agents or the presence of thiol agents more reactive than cysteine in the blood pool. Our findings point to the need of grafting Gd(III)–chelates via a linker with slower release kinetics in order to optimize the performance of the MSN-based MRI contrast agents.
4. Conclusion
We have designed and characterized a multifunctional MSN-based MR imaging contrast agent with very high r1 relaxivities. The Gd(III) chelates were incorporated onto the MSNs via a redox-responsive disulfide linkage. We showed that this linker is cleaved under simulated physiological conditions by cysteine. The functionalization of these nano-particles with PEG(5K) and anisamide-targeted PEG(5K) endowed them with biocompatibility and cancer-target-specificity, which was demonstrated in MR imaging of AsPC-1 cells in vitro. We observed the fast renal Gd clearance in vivo as a result of the thiol-activated release of the Gd(III) chelates from the nanoprobe. The tunability of the present approach should allow further optimization of Gd clearance kinetics in order to allow for the application of MSN-based nanoparticulate agents for target-specific MR imaging.
5. Experimental Section
Synthesis of Large Pore MSNs
This material was synthesized as described elsewhere and in the Supporting Information.[11]
Synthesis of Amino-Functionalized MSNs (AP–MSNs)
To functionalize the as-prepared MSNs with aminopropyltriethoxysilane (AP–TES), the as-prepared MSN material (300 mg) was dispersed in dry toluene (30 mL). To this dispersion, AP–TES (200 μL, 0.859 mmol) was added and the final suspension was refluxed for 6 h at 80 °C. The product was isolated by centrifugation at 10 000 rpm for 10 min. The template-directing agent was extracted from AP–MSNs with 1% v/v HCl in methanol. The particles were dispersed in the HCl/MeOH solution at a concentration of 3.5 mg mL−1. After stirring at 60 °C for 6 h, the particles were isolated by centrifugation. The surfactant extraction was carried out three times.
Coating of MSNs with Gd Complex 4 (Gd–MSNs)
Extracted AP–MSN particles (400 mg) were suspended in dry toluene (60 mL). Gd complex 4 (160 mg, 0.186 mmol) (see Scheme 2 and the SI for a description of the synthesis of Gd complex 4) was dissolved in methanol (10 mL) and the solution was added to the reaction mixture. Before refluxing the suspension for 24 h, the sample was sonicated for at least 30 min. After the reaction was completed, the particles were isolated by centrifugation and washed with distilled water and ethanol. To remove any physisorbed Gd–chelates, the particles were dialyzed against 250 mL of distilled water for 4h, changing the water every hour. In order to increase the Gd complex loading, the above coating procedure was repeated once more. The Gd–MSN particles were isolated by centrifugation and washed with distilled water and ethanol. The final material was stored in ethanol.
Synthesis of PEG–Gd–MSNs and AA–Gd–MSNs
Gd–MSN particles (120 mg) were dispersed in PBS (120 mL,10 mM, pH 7.4). A solution of EDC (92.6 mg, 0.483 mmol) and MeO–PEG(5K)carboxylic acid (600 mg, 0.12 mmol) in PBS (7 mL,10 mM, pH 7.4) was prepared and this solution was added to the previously prepared Gd–MSN dispersion and stirred for 24 h at room temperature. This procedure was repeated once more to increase the PEGylation of the Gd–MSN material. The final product was washed several times with water and stored in 30 mL of ethanol. To an ethanolic solution of this material (50 mg in 10 mL of ethanol), 1 mL (30 mg) of a previously prepared solution of AA–PEG(5K)triethoxysilane derivative in DMSO (see SI for details) was added. This mixture was reacted for 12 h at 60 °C. The resulting material was washed several times with ethanol to afford the desired AA–Gd–MSN.
Cell Lines
HT-29 human colon adenocarcinoma cells (ATC# HTB 28) were purchased from the Tissue Culture Facility of the Lineberger Comprehensive Cancer Center at the University of North Carolina at Chapel Hill. Cells were cultured in McCoy’s 5A media (Cellgro) with 10% fetal bovine serum (Sigma) and 2% penicillin/streptomycin (Sigma). AsPC-1 human pancreatic adenocarcinoma cells (ATCC# CRL-1682) were received from the laboratory of Jen Jen Yeh at the University of North Carolina at Chapel Hill. Cells were cultured in RPMI-1640 media (Cellgro) supplemented with 10% fetal bovine serum (Sigma) and 2% pencillin-streptomycin (Sigma).
Confocal Microscopy for HT-29 Cells
HT-29 cells were plated in a 6-well plate with silanized coverslips at a cell density of 3 × 10⁵ cells per well in 1 mL media per well. The plate was incubated for 18 h to promote cell attachment (5% CO2, 37 °C). The media was removed, wells were washed once with phosphate buffered saline (PBS, Cellgro), and fresh media was introduced containing different concentrations of RITC–Gd–MSN (0, 0.1, 0.2, 0.3, 0.4, and 0.5 mg mL−1). The plate was incubated for 90 min. The media was removed and the wells washed with PBS. Then 1 mL of fresh media was added to each well. Images were obtained using a Zeiss LSM5 Pascal inverted confocal laser scanning microscope. The Rhodamine B dye was imaged using 540 nm excitation and a 625 nm long pass emission filter.
Confocal Microscopy for AsPC-1 Cells
AsPC-1 cells were cultured in a 6-well plate containing silanized coverslips at 3 × 10⁵ cells per well. Each well contained a total of 3.0 mL of cell media and the plate was incubated at 37 °C overnight to promote cell attachment. The plate was removed from the incubator, the cell media was removed, and the wells were washed once with PBS (1.5 mL). The cells were inoculated with cell media (2.0 mL) containing the FITC-labeled materials of Gd–MSNs, PEG–Gd–MSNs, and AA–Gd–MSNs at a concentration of 30 μg mL−1 and incubated for 4 h. Each well was washed twice with PBS (1.5 mL), refilled with 1 mL of cell media and the coverslips were mounted onto slides for confocal imaging. The micrographs were obtained with an Olympus FV500 inverted confocal laser scanning microscope. The FITC dye was imaged using 490 nm excitation and a 525 nm long pass emission filter.
Cell Phantom T1-Weighted MR Images for HT-29 Cells
Confluent HT-29 cells were trypsinized and an aliquot of cell suspension was added to each culture flask to obtain a cell density of 6.0 × 10⁶ cells per flask, followed by McCoy’s 5A media (7 mL, Cellgro). The flasks were incubated (37 °C, 5% CO2) for 18 h. The media was then removed and replaced with 2.5 mL of fresh media, PBS, and Gd–MSN (in PBS), totaling 0.5 mL per flask. Final Gd–MSN concentrations were 0, 0.025, 0.05, 0.10, and 0.15 mg mL−1. The flasks were incubated for 1.5 h after which the cells were trypsinized, resuspended in 200 μL PBS, and finally centrifuged at 3000 rpm for 15 min to obtain the cell pellets. T1-weighted images of the pellets were obtained on a 9.4 T MR scanner.
Cell Phantom T1-Weighted MR Images for AsPC-1 Cells
Confluent AsPC-1 cells were trypsinized, and an aliquot of cell suspension was added to each 25 mL culture flask to obtain a cell density of 6.0 × 10⁶ cells per flask, followed by 7 mL RPMI-1640 media (Cellgro). The flasks were incubated (37 °C, 5% CO2) for 18 h. The media was then removed and replaced with 2.5 mL of fresh media, PBS, and Gd–MSNs, PEG–Gd–MSNs and AA–Gd–MSNs (in PBS), totaling 0.5 mL per flask. Final MSN sample concentrations were 150 and 100 μg mL−1. The flasks were incubated for 4 h after which the cells were trypsinized, resuspended in 200 μL PBS, and finally centrifuged at 3,000 rpm for 15 min to obtain cell pellets. T1-weighted images of the pellets were obtained on a 3.0 T MR scanner.
Determination of the Amount of Gd3+ Internalized by the Cells
Cell pellets were digested in concentrated HNO3 for 24 h and diluted to 4 mL with MilliQ water. The samples were filtered with Nalgene PTFE 0.2 μm filters to remove undigested cellular material. The amount of Gd3+ incorporated with each cell pellet was then determined by ICP-MS.
Animal Imaging Studies
Female athymic nude mice (6–8 weeks old, 20–25 g, University of North Carolina) were cared for under an approved protocol and the guidelines of the University of North Carolina Institutional Animal Care and Use Committee. The mice were anesthetized by isofluorane inhalation anesthesia. T1 weighted MR images of the abdomen and pelvis were acquired on a Siemens Allegra 3T head-only clinical MR scanner using a 2D spin echo pulse sequence and a custom-made, birdcage, volume transmit/receive coil measuring 4 cm in diameter before and at 0, 5, 15, 30 and 45 mins post injection of PEG–MSNs at a dose of 0.080 mmol kg−1 Gd via a tail vein injection. Imaging parameters were 10 ms TE, 360 ms TR, 90 degree Flip angle, 50 mm field of view, 1mm coronal slice thickness. The MR images were analyzed using Image J. Regions of interest (ROIs) were set on the urinary bladder, liver, and kidneys of each mouse.
Supplementary Material
Acknowledgments
This work was supported by the NCI (U01-CA151455 and U54-151652). The authors thank the staff of the Biomedical Research Imaging Center at UNC-Chapel Hill for helping with the in vivo MRI studies. J.L.V.-E thanks the Carolina Postdoctoral Program for Faculty Diversity for a postdoctoral fellowship.
Dedicated to Prof. Chad A. Mirkin to celebrate 20 years of his extraordinary contributions to science.
Footnotes
Supporting Information
Supporting Information is available from the Wiley Online Library or from the author.
Contributor Information
Dr. Juan L. Vivero-Escoto, Department of Chemistry, University of North Carolina, Chapel Hill, North Carolina, 27599, USA
Dr. Kathryn M. L. Taylor-Pashow, Savannah River National Laboratory, Aiken, South Carolina 29808, USA
Rachel C. Huxford, Department of Chemistry, University of North Carolina, Chapel Hill, North Carolina, 27599, USA
Joseph Della Rocca, Department of Chemistry, University of North Carolina, Chapel Hill, North Carolina, 27599, USA.
Christie Okoruwa, Department of Chemistry, University of North Carolina, Chapel Hill, North Carolina, 27599, USA.
Dr. Hongyu An, Department of Radiology, University of North Carolina, Chapel Hill, North Carolina, 27599, USA
Prof. Weili Lin, Email: wlin@email.unc.edu, Department of Chemistry, University of North Carolina, Chapel Hill, North Carolina, 27599, USA.
Prof. Wenbin Lin, Department of Radiology, University of North Carolina, Chapel Hill, North Carolina, 27599, USA
References
- 1.a) Lowe J. Chem Rev. 2005;14:22. [Google Scholar]; b) Schaeffter T, Dahnke H. Handb Exp Pharmacol. 2008;185:75. doi: 10.1007/978-3-540-72718-7_4. [DOI] [PubMed] [Google Scholar]; c) Brown MA, Semelka RC. MRI: Basic principles and applications. Wiley-Liss; New York: p. 2003. [Google Scholar]
- 2.a) Caravan P, Ellison JJ, McMurry TJ, Lauffer RB. Chem Rev. 1999;99:2293. doi: 10.1021/cr980440x. [DOI] [PubMed] [Google Scholar]; b) Strijkers GJ, Mulder WJM, van Tilborg GAF, Nicolay K. Anti-Cancer Agents Med Chem. 2007;7:291. doi: 10.2174/187152007780618135. [DOI] [PubMed] [Google Scholar]; c) Merbach AE, Toth E, editors. The Chemistry of Contrast Agents in Medical Magnetic Resonance Imaging. 2001. p. 471. [Google Scholar]
- 3.a) Bhave G, Lewis JB, Chang SS. J Urol. 2008;180:830. doi: 10.1016/j.juro.2008.05.005. [DOI] [PMC free article] [PubMed] [Google Scholar]; b) Kalb RE, Helm TN, Sperry H, Thakral C, Abraham JL, Kanal E. Br J Dermatol. 2008;158:607. doi: 10.1111/j.1365-2133.2007.08369.x. [DOI] [PubMed] [Google Scholar]; c) Stratta P, Canavese C, Aime S. Curr Med Chem. 2008;15:1229. doi: 10.2174/092986708784310396. [DOI] [PubMed] [Google Scholar]
- 4.Perazella MA. Curr Drug Saf. 2008;3:67. doi: 10.2174/157488608783333989. [DOI] [PubMed] [Google Scholar]
- 5.a) Villaraza AJL, Bumb A, Brechbiel MW. Chem Rev. 2010;110:2921. doi: 10.1021/cr900232t. [DOI] [PMC free article] [PubMed] [Google Scholar]; b) Kozlowska D, Foran P, MacMahon P, Shelly MJ, Eustace S, O’Kennedy R. Adv Drug Deliver Rev. 2009;61:1402. doi: 10.1016/j.addr.2009.09.003. [DOI] [PubMed] [Google Scholar]; c) Lin W, Hyeon T, Lanza GM, Zhang M, Meade TJ. MRS Bull. 2009;34:441. doi: 10.1557/mrs2009.120. [DOI] [PMC free article] [PubMed] [Google Scholar]; d) Na HB, Hyeon T. J Mater Chem. 2009;19:6267. [Google Scholar]; e) Na HB, Song IC, Hyeon T. Adv Mater. 2009;21:2133. [Google Scholar]; f) Taylor-Pashow KML, Della Rocca J, Huxford RC, Lin W. Chem Commun. 2010;46:5832. doi: 10.1039/c002073g. [DOI] [PubMed] [Google Scholar]; g) Rieter WJ, Taylor KML, An H, Lin W, Lin W. J Am Chem Soc. 2006;128:9024. doi: 10.1021/ja0627444. [DOI] [PMC free article] [PubMed] [Google Scholar]; h) Taylor KML, Jin A, Lin W. Angew Chem. 2008;120:7836. [Google Scholar]; Angew Chem Int Ed Engl. 2008;47:7722. [Google Scholar]
- 6.Longmire M, Choyke PL, Kobayashi H. Nanomedicine. 2008;3:703. doi: 10.2217/17435889.3.5.703. [DOI] [PMC free article] [PubMed] [Google Scholar]
- 7.a) Lu Z-R, Mohs AM, Zong Y, Feng Y. Int J Nanomed. 2006;1:31. doi: 10.2147/nano.2006.1.1.31. [DOI] [PMC free article] [PubMed] [Google Scholar]; b) Lu Z-R, Ye F, Vaidya A. J Control Release. 2007;122:269. doi: 10.1016/j.jconrel.2007.06.016. [DOI] [PMC free article] [PubMed] [Google Scholar]; c) Feng Y, Zong Y, Ke T, Jeong E-K, Parker DL, Lu Z-R. Pharm Res. 2006;23:1736. doi: 10.1007/s11095-006-9028-z. [DOI] [PubMed] [Google Scholar]
- 8.a) Ke T, Feng Y, Guo J, Parker DL, Lu Z-R. Magn Reson Imaging. 2006;24:931. doi: 10.1016/j.mri.2006.03.009. [DOI] [PubMed] [Google Scholar]; b) Wu X, Feng Y, Jeong E-K, Emerson L, Lu Z-R. Pharm Res. 2009;26:2202. doi: 10.1007/s11095-009-9935-x. [DOI] [PMC free article] [PubMed] [Google Scholar]; c) Zong Y, Guo J, Ke T, Mohs AM, Parker DL, Lu Z-R. J Control Release. 2006;112:350. doi: 10.1016/j.jconrel.2006.03.006. [DOI] [PubMed] [Google Scholar]
- 9.a) Taylor KML, Kim JS, Rieter WJ, An H, Lin W, Lin W. J Am Chem Soc. 2008;130:2154. doi: 10.1021/ja710193c. [DOI] [PubMed] [Google Scholar]; b) Steinbacher JL, Lathrop SA, Cheng K, Hillegass JM, Butnor KJ, Kauppinen RA, Mossman BT, Landry CC. Small. 2010;6:2678. doi: 10.1002/smll.201001447. [DOI] [PMC free article] [PubMed] [Google Scholar]; c) Tsai C-P, Hung Y, Chou Y-H, Huang D-M, Hsiao J-K, Chang C, Chen Y-C, Mou C-Y. Small. 2008;4:186. doi: 10.1002/smll.200700457. [DOI] [PubMed] [Google Scholar]; d) Lee JE, Lee N, Kim H, Kim J, Choi SH, Kim JH, Kim T, Song IC, Park SP, Moon WK, Hyeon T. J Am Chem Soc. 2010;132:552. doi: 10.1021/ja905793q. [DOI] [PubMed] [Google Scholar]
- 10.a) Pirollo KF, Chang EH. Trends Biotechnol. 2008;26:552. doi: 10.1016/j.tibtech.2008.06.007. [DOI] [PubMed] [Google Scholar]; b) Veronese FM, Pasut G. Drug Discovery Today. 2005;10:1451. doi: 10.1016/S1359-6446(05)03575-0. [DOI] [PubMed] [Google Scholar]
- 11.Slowing II, Trewyn BG, Lin VSY. J Am Chem Soc. 2007;129:8845. doi: 10.1021/ja0719780. [DOI] [PubMed] [Google Scholar]
- 12.Chong PCS, Hodges RS. J Biol Chem. 1981;256:5064. [PubMed] [Google Scholar]
- 13.Tan M, Wu X, Jeong E-K, Chen Q, Parker DL, Lu Z-R. Mol Pharmaceutics. 2010;7:936. doi: 10.1021/mp100054m. [DOI] [PMC free article] [PubMed] [Google Scholar]
- 14.Saito G, Swanson JA, Lee K-D. Adv Drug Delivery Rev. 2003;55:199. doi: 10.1016/s0169-409x(02)00179-5. [DOI] [PubMed] [Google Scholar]
- 15.Owens DE, Peppas NA. Int J Pharm. 2006;307:93. doi: 10.1016/j.ijpharm.2005.10.010. [DOI] [PubMed] [Google Scholar]
- 16.a) Banerjee R, Tyagi P, Li S, Huang L. Int J Cancer. 2004;112:693. doi: 10.1002/ijc.20452. [DOI] [PubMed] [Google Scholar]; b) Li S-D, Huang L. Ann N Y Acad Sci. 2006;1082:1. doi: 10.1196/annals.1348.001. [DOI] [PubMed] [Google Scholar]
- 17.John CS, Vilner BJ, Geyer BC, Moody T, Bowen WD. Cancer Res. 1999;59:4578. [PubMed] [Google Scholar]
- 18.Kashiwagi H, McDunn JE, Simon PO, Jr, Goedegebuure PS, Xu J, Jones L, Chang K, Johnston F, Trinkaus K, Hotchkiss RS, Mach RH, Hawkins WG. Mol Cancer. 2007;6:1. doi: 10.1186/1476-4598-6-48. [DOI] [PMC free article] [PubMed] [Google Scholar]
- 19.Lu Z-R, Parker DL, Goodrich KC, Wang X, Dalle JG, Buswell HR. Magn Reson Med. 2003;51:27. doi: 10.1002/mrm.10656. [DOI] [PubMed] [Google Scholar]
Associated Data
This section collects any data citations, data availability statements, or supplementary materials included in this article.


