

Abstract
An efficient pipeline for peptide discovery accelerates peptidomic analysis and facilitates a better understanding of the functional roles of neuropeptides. However, qualitative and quantitative analysis of large neuropeptides are challenging due to the bigger molecular sizes, multiple post-translational modifications, and interference by homologous isoforms. Herein, we refined two methodologies in the pipeline for highly confident and efficient mass spectrometry (MS)-based peptide discovery. For the qualitative analysis, the so-called “high resolution/accurate mass” measurement on Orbitrap mass spectrometers was integrated with computer-assisted homology search, which was successfully applied to decipher the substituted amino acid residues in large neuropeptides by referring to homologous sequences. For the quantitative analysis, a new isotopic labeling-assisted top-down MS strategy was developed, which enabled direct monitoring of the abundance changes of endogenous large neuropeptides. By using the refined peptide discovery pipeline, one novel crustacean hyperglycemic hormone (CHH) from the Dungeness crab sinus glands was confidently identified and de novo sequenced, and its relative abundance was quantified. Comparative analysis of CHHs in unfed and fed crabs revealed that the peptide abundance in the sinus glands was significantly increased after food intake, suggesting that the release of CHHs might be altered by feeding behavior.
1 Introduction
Neuropeptides represents a complex and diverse group of naturally occurring endogenous molecules in nervous system that play important roles in regulation of physiological process, such as stress, memory, circadian rhythm, and energy homeostasis [1-4]. Among these important physiological studies, the investigation of functional roles of neuropeptides in food intake has attracted enormous interest due to potential link with energy homeostasis disorders leading to obesity and diabetes [2, 3]. Several neuropeptides in the mammalian hypothalamus have been reported to control food intake, including neuropeptide Y, proopiomelanocortin, melanin-concentrating hormone, neurotensin, cholecystokinin (CCK), leptin and ghrelin [2, 3, 5, 6]. Previously, we investigated crustacean neuropeptidome by comparative mass spectrometry (MS)-based approaches and observed the expression level changes of RY-amides, tachykinin-related peptides, RFamide-related peptides, and pyrokinins in response to feeding [6, 7].
Many of the feeding-related signaling molecules and pathways underlying complex behaviors are conserved across species [8, 9]. For example, neuropeptide F [10] and CCK-like peptides [8] as well as the related signaling pathways have been strongly implicated in the regulation of food intake in vertebrates and invertebrates. In crustaceans, the balanced secretion of crustacean hyperglycemia hormone (CHH) and insulin-like peptides is an essential part of the control of energy homeostasis [11]. CHH is able to initiate glycemia by increasing D-glucose levels in the hemolymph via mobilization of D-glucose from the hepatopancreas and muscle glycogen stores. In contrast, the insulin-related peptides act to cause a decrease in hemolymph D-glucose levels. To some extent, the balanced secretion mechanism of CHHs and insulin-like peptides in crustaceans is comparable with the well-known opposite regulatory roles of glucagon and insulin in glucose metabolism of humans [12]. Regarding control of food intake in humans, insulin sensitizes the brain to short-term meal-generated satiety signals; and glucagon acts to reduce meal size [12]. However, the potential functional role of CHHs on control of crustacean food intake is still unknown so far. Before answering this complex biological question, the initial step is to obtain physiologically relevant evidence that the endogenous levels of CHHs can be altered by feeding behavior, which is the goal of this study.
Qualitative and quantitative analysis of CHHs at endogenous level is challenging because these large peptides contain multiple post-translational modifications and their molecular sizes are over 8 kDa [13]. In our previous study, we established a multi-faceted MS-based platform which allows confident de novo sequencing of CHH-family neuropeptides without assistance of genome database [14]. However, the substituted residues of the target CHHs need to be deciphered according to homologous sequences manually, thus limiting the overall throughput. In addition to qualitative analysis, accurate quantitation of large neuropeptides is essential for probing their functional dynamics. The label-free top-down MS method has been successfully applied in quantitation of small proteins [15, 16] and large peptides [17]. However, these large biomolecules exhibit broader peak elution patterns profiles on reversed-phase liquid chromatography (RPLC), which could affect reproducibility and thus quantitation accuracy [18]. Alternatively, tryptic digest of large neuropeptides may be quantified by label-free bottom-up MS approaches. However, the large peptide isoforms share homologous sequences [19], thus producing the same tryptic peptides and causing interference by each other. Furthermore, the metabolic labeling of tissues and cell cultures offer efficient approaches for incorporating stable isotope labels for MS-based quantitation of intact proteins [20, 21]. However, this method is difficult to be applied to crustacean models due to the limitation of metabolically labeled food sources.
In this study, we refined two major components of the peptide discovery pipeline for qualitative and quantitative analysis of large neuropeptides. For qualitative analysis, integration of “high-resolution/accurate mass (HR/AM)” measurement [22, 23] and algorithm-assisted homology search [24] enabled prompt and accurate sequence prediction for large neuropeptides. For quantitative analysis, we developed a stable isotopic labeling-assisted [25-27] top-down MS strategy that offered precise accurate and reliable quantitative results to monitor changes of endogenous abundance of large neuropeptides. By using the refined pipeline for peptide discovery, the novel Cam-CHH and Cam-CHHpQ were identified from the sinus glands of the Dungeness crab Cancer magister, and their relative abundances were altered upon feeding.
2 Materials and methods
2.1 Materials
Methanol, glacial acetic acid, borane pyridine, formaldehyde, formaldehyde-d2, Dithiothreitol (DTT) and iodoacetamide (IAA) were obtained from Sigma-Aldrich (St. Louis, MO). Optima grade formic acid, acetonitrile (ACN), water, and methanol were purchased from Fisher Scientific (Pittsburgh, PA).
2.2 Animals, feeding experiments and tissue dissection
Dungeness crabs C. magister were purchased from The Fresh Lobster Company (Gloucester, MA) and kept without food in a circulating artificial seawater tank at 10−15 °C for 6 days before use. In the feeding experiment, one crab was fed with seafood until it stopped eating, which usually took about 20 min. After 40 min, the fed crab and one unfed crab (as control) were cold anesthetized by packing them in ice for 15 min [6]. The sinus glands were dissected in chilled physiological saline and collected in chilled acidified methanol. The tissues were homogenized and extracted with 100 μL of acidified methanol (methanol: H2O: acetic acid, 90:9:1, v:v:v) for three times [14]. After drying down in speedvac, the tissue extract was re-suspended in 100 μL of water and stored in -80 °C for further analysis.
2.3 Isotopic labeling of peptides by formaldehyde
Two 20 μL of aliquots of tissue extracts of fed and unfed crabs were dried down and re-suspend in 10 μL of solution (90% ACN in water). The two samples were added with borane pyridine (C5H8BN, 120 mM in 10% methanol) and then mixed with light and heavy formaldehyde (15% in water, 1 μL), respectively. The reaction solutions were kept at room temperature for 1 h. After quenched by adding 1 μL of ammonium bicarbonate solution (0.2 M), the two samples of fed and unfed crabs were mixed at equal volume. After desalting by Ziptip C18, the sample was re-suspended in 20 μL of water for further MS analysis.
2.4 Top-down and bottom-up MS on Q Exactive Orbitrap mass spectrometer
For top-down analysis, a 1 μL of crude tissue extract was reduced by incubation in 2.5 mM DTT for 1 h at 37 °C and desalted by C18 ZipTip and resuspended in 10 μL of water containing 0.2% formic acid. On-line top-down MS was carried out on Waters nanoAcquity ultra performance LC system coupled to a Q Exactive quadrupole orbitrap mass spectrometer (Thermo Fisher Scientific, Bremen, Germany). A 0.5 μL of peptide sample was injected and loaded onto the Waters Symmetry C18 trap column (180 μm × 20 mm, 5 μm) using 97% mobile phase A (0.1% of formic acid in water) and 3% mobile phase B (0.1% of formic acid in ACN) at a flow rate of 5 μL/min for 3 min. A Waters BEH 300Å C18 reversed phase capillary column (150 mm × 75 μm, 1.7 μm) was used for separation. The gradient started from 3 to 10% B during the first 5 min, increased to 55% B in the next 65 min, then was kept at 90% B for 20 min. Typical mass spectrometric conditions were as follows: spray voltage, 2.8 kV; no sheath and auxiliary gas flow; heated capillary temperature, 275 °C; normalized high-energy collision dissociation (HCD) collision energy 30%. The Q Exactive instrument was operated in targeted MS/MS mode with an inclusion list containing the targeted mass of the CHHs. The settings are: resolution 70, 000; automatic gain control 2e5; maximum ion injection time, 100 ms; isolation window, 6 m/z; fixed first mass, 100 m/z. All MS/MS spectra were processed with Xtract CI-3.0 Software (Thermo Scientific Inc., Bremen, Germany) using an S/N threshold of 1.5 and fit factor of 40% and validated manually. The resulting mass lists were further assigned using the in-house developed “Ion Assignment” software with of 10 ppm of mass error tolerance. The assigned ions were manually validated to ensure the quality of assignments.
For bottom-up analysis, a 1 μL of crude tissue extract was treated with DTT and IAA followed by tryptic digestion according to previous reports [14, 28-30]. The tryptic digest was analzyed on the same LC-MS system as described above with different LC gradient and MS paratmeters. The LC gradient started from 3 to 10% B during the first 5 min, increased to 45% B in the next 65 min, then was kept at 90% B for 20 min. The Q Exactive mass spectrometer was operated in a data-dependent mode (top 10) with the following settings: Full MS, resolution 70,000, AGC 1xe6, maximum injection time 100 ms, scan range 200-2000 m/z; dd-MS2, resolution 17,500, AGC 1xe5, maximum injection time 100 ms, loop count 10, isolation window 3.0 m/z, fixed fist mass 100 m/z, nomolized collision energy 30%.
In addition, the original and DTT-reduced tissue extract samples were respectively analyzed by LC-MS/MS under data-dependent mode on the Q Exactive mass spectrometer for determination of the accurate molecular weights of CHHs. The LC conditions were identical to the conditions described for the top-down experiments. The parameter settings of the Q Exactive instrument were identical to those of bottom-up experiments.
2.5 Off-line top-down MS on Orbitrap Elite mass spectrometer
The purified peptide was re-suspended in 50% of ACN with 0.1% formic acid and directly infused into Orbitrap Elite mass spectrometer (Thermo Fisher Scientific, Bremen, Germany) via syringe pump at a flow rate of 0.3 μL/ml. The peptide parent ions were selected with an isolation window of 6 Da and submitted to HCD fragmentation with 30% of normalized collision energy. The data was acquired for 1000 scans to generate a high quality HCD MS/MS spectrum with a resolving power of 60,000. The data processing method was the same as off-line top-down method described above.
2.6 Database search and data interpretation by Mascot and PEAKS
Peptides were identified by searching against a NCBInr protein database using the Mascot v2.1 search engine. Trypsin was selected as the enzyme allowing up to 2 missed cleavages. Carbamidomethyl cysteine was specified as fixed modifications, and methionine oxidation and pyro-Glu as variable modifications. Precursor and MS/MS tolerances were both set within 0.1 Da using monoisotopic mass. Peptide charge states include 1+, 2+ and 3+ charged peptides.
The data acquired by bottom-up strategy on Q Exactive were processed by Peaks Studio 5.2 (BSI, Canada) for spectral interpretation [24, 31, 32]. First, data was refined and subjected to Auto De Novo program for sequencing with the mass tolerance at 0.1 Da. Trypsin was specified for enzyme cleavage. Variable PTMs included C-terminal amidation, pyro-Glu and methionine oxidation, and fixed PTM was carbamidomethyl on cysteine. Second, the homologous CHH sequences obtained from Mascot search were constructed into the small database I. The data from Auto De Novo was subsequently subjected to Spider Homology Search against the small database I with the same settings as above. Third, the predicted tryptic peptides were assembled to generate a predicted CHH sequence and the small database II. The data from Auto De Novo was searched against the small database II to match all the tryptic peptides in the sample. The settings were also the same as above.
2.7 Quantitative experiments and data analysis
The tissue extract samples from feeding experiments were analyzed by top-down MS on the Q Exactive system in targeted MS/MS mode. The LC-MS/MS conditions were the same as decribed above, except for the difference of the MS/MS isolation window. Specifically, a 15-Da isolation window was used to select both the light- and heavy-labeled peptides for HCD fragmentation. In the resulting top-down MS/MS spectra, the ion intensity ratio (light to heavy) of the monoisotopic peaks of FH-y9 2+ and FH-y13 2+ were used to provide the quantitative information. Three biological replicate experiments were performed, and each biological replicate consisted of two technical replicates. Student's t-test was performed to evaluate the quantitative data, and the p-value <0.05 was considered to be statistically significant.
3 Results and discussion
3.1 Identification of novel CHHs in Dungeness crab by a refined peptide discovery pipeline
The Dungeness crab C. magister is a favored animal model for neurobiologists due to their relativiely simple and well-organized nervous system [33]. However, its genome has not been sequenced yet and thus no protein/cDNA database is currently available. Although the presence of CHH of Dungeness crab sinus gland has been documented by immunocytochemistry using an antibody staining against a homologous CHH of Cancer pagurus [34], the exact amino acid sequence has not been determined. In this work, we refine our peptide discovery pipeline to determine the full amino acid sequence of the Dungeness crab CHHs and study its dynamic changes in response to food intake.
CHH-family neuropeptides have two unique features, namely the presence of three disulfide bonds and molecular weights ranging from 8 to 10 kDa [13, 19], which are criteria for screening peptide candidates. The tissue extract of Dungeness crab sinus glands was treated with DTT and kept in acidic solvent to prevent the free sulfhydryl from reforming disulfide bonds. To measure the accurate molecular weights of intact and DTT-reduced CHHs, the original and reduced tissue extract samples were respectively analyzed by LC-MS/MS under data-dependent mode on a Q Exactive hybrid quadrupole-Orbitrap mass spectrometer [22, 23, 35]. By comparing the mass differences of the detected peptides between the two runs, two CHH candidates (MWs, 8453.824 and 8470.848 Da) were found by observing 6 Da of mass increase due to DTT reduction as shown in Figure 1. The 17 Da of mass difference between the two peptides could be attributed to N-terminal pyro-Gln modification. The two candidates were tentatively named as Cam-CHHpQ and Cam-CHH. We then performed de novo sequencing of Cam-CHHpQ.
Figure 1. Discovery and identification of novel CHHs in the sinus gland of Dungeness crabs.

(A) High resolution isotopic distributions of intact and DTT-reduced CHHs. (B) Refined workflow for de novo sequencing of CHHs.
To find homologous preprohormone and predict putative sequence, we performed bottom-up sequencing on the CHH candidates. They were purified by RPLC and digested by trypsin, respectively. The tryptic digests were analyzed by LC-MS/MS on Q Exactive mass spectrometer, followed by Mascot searching against a NCBI database. The first hit was Cancer productus CHH-preprohormone [36] (Figure S1) with Mascot score of 2562 and homologous sequence coverage of 40%. In total, eighty nine peptides (including duplicate hits) were matched with a significance threshold p<0.05. Subsequently, we used this homologous sequence as a reference to search the bottom-up data by PEAKS Spider homology search [24, 32]. One set of tryptic peptides, Cam-CHHpQ[1-8], [32-40], [41-50], [32-50], and [41-67] in Table 1, were determined with significant Spider scores [24, 32], each of which contained one substituted residue in comparison to the homologous sequence. Figure 2 A, B and C show three representative MS/MS spectra of these tryptic peptides (other spectra are shown in Figure S2-S8 in Supporting Information). In addition, there are other tryptic peptides, Cam-CHHpQ[14-31], [51-64], and [51-67] in Table 1, were also matched, which contained the same residues as the homologous sequence. Subsequently, the residues 6Ser, 37Ser, and 47Val were substituted by the newly identified ones, 6Thr, 37Thr, and 47Leu (Figure 2D) to generate a putative sequence. This sequence was used to search the bottom-up data again by means of PEAKS database search [24], and all the tryptic peptides were identified with significant -10logP scores as shown in Table 1 except for the unidentified residues 68Xxx-72Xxx. The sequence coverage of bottom-up sequencing was illustrated in Figure 3A. The remaining residues 68Xxx-72Xxx was further identified by top-down HCD fragmentation of the intact CHH peptide (Figure 2E), where the purified peptide was off-line injected into the Orbitrap Elite mass spectrometer. One set of large b ions, b54~b71 deriving from enhanced cleavage of C-terminal amide bonds, were observed, indicative of the residues 55Xxx-72Xxx. Finally, the DTT-reduced tissue extract was submitted to Q Exactive by means of LC-targeted MS/MS to acquire a high quality of top-down HCD spectrum, enabling validation of the newly identified sequence. Figure 3B shows the fragmentation map of this peptide, and with a 53% of sequence coverage and 65% of amide bond cleavage being attained, confirming the sequences of Cam-CHHpQ as identified above with great confidence. It should be noted that the experiment in Figure 2E can also be performed on Q Exactive mass spectrometer by either off-line or on-line top-down MS/MS. The reason of using the Orbitrap Elite instrument here is to demonstrate that our approach is applicable to diverse Orbitrap instruments. In addition, leucine and isoleucine in Cam-CHHpQ was assigned based on the homologous sequence. For the substituted residue #47 in two CHHs, our data (Figure 2C and Figure S6) suggested that this could be either a leucine or an isoleucine. Unfortunately, our current MS-based approach lacks the capability to differentiate them. Therefore, the amino acid residue at position 47 is tentatively assigned as leucine based on sequence homology to the CHH sequence in Carcinus maenas [37]. Similarly, bottom-up identification of the unmodified Cam-CHH (MW 8470.848, no pyro-Gln) yielded the same tryptic peptides as Cam-CHHpQ, except for the observation of N-terminal tryptic segments without pyro-Gln (Figure S9). In addition, top-down HCD fragmentation of the intact Cam-CHH produced one set of large b ions without pyro-Gln at the N-terminus (Figure S10). These results confirmed the identity of Cam-CHH.
Table 1.
Tryptic peptides identified in bottom-up sequencing of Cam-CHHpQ.
| Tryptic peptidesa | Position | Spider scoreb | −10logP scorec | Mascot Scored | mass | m/z | ppm | Fig.# |
|---|---|---|---|---|---|---|---|---|
| pQIYDTSC*K | CHH[1-8] | 24.00 | 108.88 | – | 996.422 | 499.218 | −1.8 | Fig.2A |
| pQIYDTSC*KGVYDR | CHH[1-13] | – | 148.94 | – | 1586.704 | 529.908 | −0.3 | Fig.S2 |
| pQIYDTSC*KGVYDRGLFSDLEHVC*DDC*YNLYR | CHH[1-31] | – | 139.66 | – | 3843.660 | 961.918 | −4.8 | Fig.S3 |
| GLFSDLEHVC*DDC*YNLYR | CHH[14-31] | 60.00 | 161.28 | 47 | 2274.967 | 1138.488 | −2.4 | Fig.S4 |
| NSYVATAC*R | CHH[32-40] | 25.50 | 116.61 | – | 1040.471 | 521.240 | −5.3 | Fig.2B |
| SNC*YSNLVFR | CHH[41-50] | 27.75 | 115.28 | – | 1258.576 | 420.532 | −2.8 | Fig.2C |
| NSYVATAC*RSNC*YSNLVFR | CHH[32-50] | 55.00 | 152.35 | – | 2281.037 | 761.351 | −2.0 | Fig.S5 |
| SNC*YSNLVFRQC*MEELLLMEEFDKYAR | CHH[41-67] | 41.45 | 128.47 | – | 3444.561 | 862.146 | −1.4 | Fig.S6 |
| QC*MEELLLMEEFDK | CHH[51-64] | 44.50 | 125.56 | 99 | 1813.794 | 907.901 | −2.6 | Fig.S7 |
| QC*MEELLLMEEFDKYAR | CHH[51-67] | 54.00 | 154.11 | 69 | 2203.995 | 1103.003 | −1.8 | Fig.S8 |
The substituted residues are underlined. p, pyro-Gln. * carbamidomethylation.
The score is obtained from PEAKS Spider Homology Search. Some tryptic peptides are not identified in this run.
The score is obtained from PEAKS database search.
The tryptic peptides with the substituted residues are predicted by PEAKS. Therefore, there are no Mascot scores for these tryptic peptides.
Figure 2. Mass spectral sequencing of Cam-CHHpQ.

MS/MS spectra of tryptic peptides [1-8] (A), [32-40] (B) and [41-50] (C). Sequence assembly of CHH (D). Top-down HCD MS/MS spectrum of intact CHH (E). The spectra in Panel A, B, and C are exported from PEAKS after deconvolution and deisotoping. The spectrum in Panel E is processed by Xtract for deconvolution. The substituted residues of Cam-CHHpQ are highlighted with red font in panel D. *, carbamidomethyl; pQ, pyro-Gln; a, amidation.
Figure 3.

Sequence coverage map (A) and fragmentation maps (B) of Cam-CHHpQ respectively obtained by bottom-up and top-down sequencing strategies. In panel A, the blue bars below sequence represent tryptic peptide sequences being detected and identified; the bold type letters are identified residues. pQ, pyro-Gln; a, amidation.
In our previous studies, we established a MS-based platform for confident de novo sequencing of large neuropeptides [14]. This multi-faceted pipeline, while effective, was time consuming due to the need for manual inspection of the MS/MS spectra of tryptic peptides to locate the substituted residues in the target peptides that were distinct from the homologous sequences. In this study, we take advantage of Orbitrap instruments with capability of HR/AM measurement and HCD technique [22], which greatly improves the quality of MS/MS spectra for both bottom-up and top-down analysis. By processing the data with PEAKS Spider homology search, the tryptic peptides containing substituted residues can be predicted in an automatic and confident manner. The modification of this aspect of the methodology greatly enhanced the throughput of the peptide discovery pipeline. Previously, we also tested the data acquired by mass spectrometers with TOF analyzers to perform PEAKS Spider Homology Search [38], but nothing was obtained presumably due to lower mass accuracy of TOF analyzers and fragmentation efficiency of CID. Zhang and co-workers [31, 32] have successfully applied this method to characterize mammalian neuropeptides with molecular weight less than 5 kDa. To the best of our knowledge, our study represents the first application of this method to sequence large neuropeptides.
3.2 Isotopic labeling-assisted quantitative top-down MS for monitoring the changes of CHHs at endogenous level
To monitor the relative abundance of the newly identified CHHs in neural tissue, we developed an isotopic labeling-assisted quantitative top-down strategy. The reductive methylation using formaldehyde (FH) and cyanoboroydride has been reported as a fast and simple reaction that is highly selective to N-termini and lysine side chain [25, 26, 39, 40]. This reaction has been reported to label intact proteins resulting in high labeling yield [39, 41, 42]. The Cam-CHHpQ (Figure 3) contains two lysines and the Cam-CHH has an extra free N-terminus, which are active sites for dimethyl labeling. Two aliquots of crude tissue extracts were respectively treated with light and heavy FH and mixed at an equal ratio, followed by LC-MS analysis (Figure 4A). In the full scan spectrum (Figure 4B), the isotopic peaks of light- and heavy-FH labeled Cam-CHHpQ were significantly overlapped, leading to inaccurate and ambiguous quantitative information. Herein, we employed a top-down MS-based strategy that both light- and heavy-FH labeled Cam-CHHpQ were selected in C-trap [22] under LC-targeted MS/MS mode with a 15 Da of mass isolation window and subsequently fragmented in HCD cell [22], followed by parallel mass measurement in the orbitrap. In the resulting top-down MS/MS spectrum (Figure 4C), one set of FH-labeled y ions, FH-y9~ FH-y17, were observed, which could be used as quantitative reporter ions indicative of relative abundance ratios of the two labeled samples. Figures 4D, 4E and 4F illustrate the zoom-in spectra of FH-y9 ions at light to heavy ratios of 1:1, 1:2 and 1:10 (the ion intensity ratio of the monoisotopic peak), demonstrating a straightforward and accurate quantitation approach. Finally, FH-y9 and FH-y13 were chosen as reporter ions because of no background interference around them. In addition, the accurate quantitation of large neuropeptides benefits from the paralleled detection [43] of Q Exactive instrument that allows all the fragment ions of light-and heavy-labeled large neuropeptides to be simultaneously measured in the orbitrap cell, which cannot be realized by TOF instruments. Coon and co-workers [43] reported that this paralleled detection was able to enhance run-to-run reproducibility and measurement accuracy in targeted proteomics. Similarly, we take advantage of this unique feature from advancement of instrumentation and introduced the isotopic labeling-assisted quantitative top-down strategy into the domain of large neuropeptide analysis.
Figure 4. Isotopic labeling-assisted quantitative top-down MS/MS strategy.

(A) Total ion chromatogram of sinus gland tissue extract treated with FH-labeling. (B) Isotopic distributions of light and heavy FH-labeled Cam-CHHpQ. (C) Top-down HCD MS/MS spectrum of light and heavy FH-labeled Cam-CHHpQ represented by red and blue dots, respectively. Zoom-in spectra showing light and heavy FH-labeled y9 2+ ions at ratios of 1:1 (D), 1:2 (E), and 1:10 (F).
We also examined the potential deuterium effect [25] on RPLC retentions of labeled CHHs. Figure S11 shows the extracted ion chromatograms of the light- and heavy-labeled Cam-CHHpQ with the identical retention time at 47.19 min, suggesting that the deuterium effect is negligible in isotopic labeling of large peptides. To achieve a complete labeling by FH, we optimized the solvent composition for labeling reaction and found that the use of 90% of ACN resulting in better than 95% of labeling efficiency presumably due to denaturation of large peptides in the high organic solvent. In addition, it should be noted that our method enables relative quantitation of large neuropeptides, instead of absolute quantitation. Therefore, a control sample is needed for each quantitative analysis.
3.3 Alteration of CHH expression levels in response to feeding
Feeding behavior is crucial for animal survival and is a fundamental aspect of energy homeostasis [3, 13]. Our previous study has observed expression level changes of multiple small neuropeptides in brain and pericardial organ upon feeding [6, 7]. In this study, we examined the relative changes of large CHH peptide expression in the sinus gland from three groups of fasting and satiated crabs. The tissue samples were prepared according to the workflow shown in Figure 5A, followed by differential analysis with the newly developed quantitative top-down tandem MS approach. Significant increases of both Cam-CHH and Cam-CHHpQ abundances were observed (Figure 5B), showing 3 to 4 fold of elevation after food intake. In order to examine the reliability of our experiment, two unfed crabs from control groups were respectively labeled with light- and heavy-FH and measured by the top-down strategy. A 1:1 ratio of light- to heavy-labeled reporter ions was detected (Figure S12). CHH is a multifunctional hormone and plays important roles throughout the life cycle of crustaceans [44]. The primary role of CHH in decapods is to induce hyperglycemia and hyperlipidemia to meet the energy requirements of the organs and tissues [13]. It has been reported that at the membrane level CHH is able to stimulate the GMP synthesis by activating guanylate cyclase [45] and at the tissue level, CHH inhibits glycogen synthase and activates glycogen phosphorylase, thus improving glycogenolysis in muscle and midgut gland [46]. In addition to the downstream regulatory pathways, the secretion and release of CHH is subjected modulation by a feedback control system. D-glucose inhibits the release of CHH by activating a K+ current that induces hyperpolarization of CHH-secreting cells [47].
Figure 5. Monitoring of relative changes of CHH expression in the sinus glands of Dungeness crabs in response to food intake.
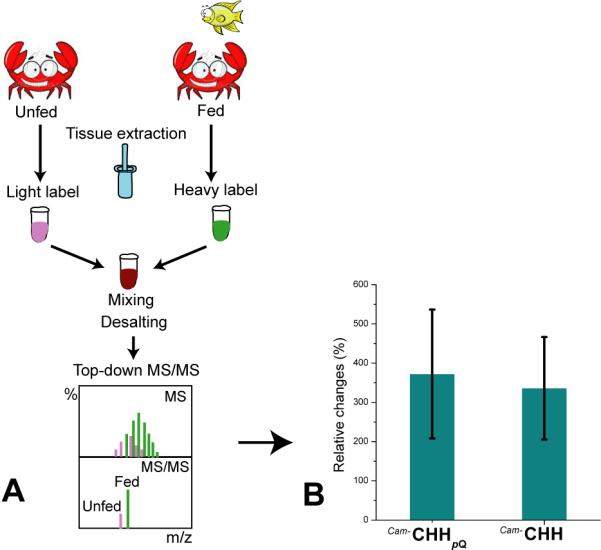
(A) The workflow of feeding and quantitation experiments. (B) Significant changes of Cam-CHH and Cam-CHHpQ in the sinus gland upon feeding. Error bars indicate SEM calculated from three feeding experiments (p-value < 0.05).
Our quantitative data (Figure 5B) indicates that the CHH level in crustacean sinus gland is dramatically elevated after feeding. Presumably, one of the reasons is due to the increasing glucose level after feeding that is commonly observed in most of organisms after eating [48]. The elevation of glucose level could initiate the feedback control system to inhibit the release of CHH, thus causing accumulation of CHH in the sinus glands. Our results suggest that the tissue level of CHH from neuroendocrine organ can be altered and associated with feeding behavior. To probe the potential roles of CHH played in regulation of feeding, further experiments will need to be designed and conducted. In this study, the utility and efficiency of the newly developed quantitative top-down strategy has been demonstrated for monitoring expression changes of CHH at the tissue level. More systematic and in-depth investigation of CHH changes in both tissue expression and circulation in response to feeding coupled with physiological studies will provide more complete understanding of the functional roles of this important class of peptide hormones.
4 Concluding remarks
This study demonstrates the utility of an improved peptide discovery pipeline for qualitative and quantitative analysis of large neuropeptide hormones and related physiological study. First, the refinement of qualitative analysis targets at a significant bottleneck that hindered the overall throughput of homologous peptide discovery. By incorporating the HR/AM capability of Orbitrap instruments with PEAKS spider homology search, the substituted residues of target large peptides can be accurately and rapidly predicted according to homologous sequences. Second, because the traditional label-free and isotopic labeling methods cannot provide accurate quantitation for large neuropeptides, we developed a novel quantitative top-down tandem MS strategy with assistance of isotopic labeling, greatly improving the quantitation accuracy. Third, by applying the qualitative and quantitative approaches to peptide discovery in Dungeness crab, novel CHHs were confidently de novo sequenced without assistance of genome information, and quantitative monitoring of the abundance changes at the tissue level was achieved. Forth, the quantitative analysis of CHH peptides in response to food intake indicates alteration of CHH abundances in the sinus glands upon feeding, suggesting potential link of CHH expression and secretion with feeding behavior. Collectively, this peptide discovery pipeline highlights the ability for qualitative and quantitative analysis of large neuropeptides and is expected to aid in future research efforts to unravel large complex signaling peptides employed by other biological systems.
Supplementary Material
Acknowledgments
This work is supported in part by the National Institutes of Health (NIH) grant (R01DK071801 to LL) and the National Science Foundation grant (CHE-0957784 to LL). We would like to acknowledge NIH shared instrument program for funding the instrument purchase (S10 RR029531). LL acknowledges an H. I. Romnes Faculty Research Fellowship. We are also grateful to the UW School of Pharmacy Analytical Instrumentation Center for access to Q Exactive and Elite Orbitrap mass spectrometers.
Footnotes
The authors have declared no conflicts of interest.
References
- 1.Li L, Sweedler JV. Peptides in the brain: mass spectrometry-based measurement approaches and challenges. Annu Rev Anal Chem (Palo Alto Calif) 2008;1:451–483. doi: 10.1146/annurev.anchem.1.031207.113053. [DOI] [PubMed] [Google Scholar]
- 2.Frese CK, Boender AJ, Mohammed S, Heck AJ, et al. Profiling of diet-induced neuropeptide changes in rat brain by quantitative mass spectrometry. Anal Chem. 2013;85:4594–4604. doi: 10.1021/ac400232y. [DOI] [PubMed] [Google Scholar]
- 3.Morton GJ, Cummings DE, Baskin DG, Barsh GS, Schwartz MW. Central nervous system control of food intake and body weight. Nature. 2006;443:289–295. doi: 10.1038/nature05026. [DOI] [PubMed] [Google Scholar]
- 4.Fricker LD. Analysis of mouse brain peptides using mass spectrometry-based peptidomics: implications for novel functions ranging from non-classical neuropeptides to microproteins. Mol Biosyst. 2010;6:1355–1365. doi: 10.1039/c003317k. [DOI] [PMC free article] [PubMed] [Google Scholar]
- 5.Jing J, Vilim FS, Horn CC, Alexeeva V, et al. From hunger to satiety: reconfiguration of a feeding network by Aplysia neuropeptide Y. J Neurosci. 2007;27:3490–3502. doi: 10.1523/JNEUROSCI.0334-07.2007. [DOI] [PMC free article] [PubMed] [Google Scholar]
- 6.Chen R, Hui L, Cape SS, Wang J, Li L. Comparative Neuropeptidomic Analysis of Food Intake via a Multi-faceted Mass Spectrometric Approach. ACS Chem Neurosci. 2010;1:204–214. doi: 10.1021/cn900028s. [DOI] [PMC free article] [PubMed] [Google Scholar]
- 7.Hui L, Zhang Y, Wang J, Cook A, et al. Discovery and functional study of a novel crustacean tachykinin neuropeptide. ACS Chem Neurosci. 2011;2:711–722. doi: 10.1021/cn200042p. [DOI] [PMC free article] [PubMed] [Google Scholar]
- 8.Yu N, Nachman RJ, Smagghe G. Characterization of sulfakinin and sulfakinin receptor and their roles in food intake in the red flour beetle Tribolium castaneum. Gen Comp Endocrinol. 2013;188:196–203. doi: 10.1016/j.ygcen.2013.03.006. [DOI] [PubMed] [Google Scholar]
- 9.Matsuda K, Sakashita A, Yokobori E, Azuma M. Neuroendocrine control of feeding behavior and psychomotor activity by neuropeptideY in fish. Neuropeptides. 2012;46:275–283. doi: 10.1016/j.npep.2012.09.006. [DOI] [PubMed] [Google Scholar]
- 10.Lee KS, You KH, Choo JK, Han YM, Yu K. Drosophila short neuropeptide F regulates food intake and body size. J Biol Chem. 2004;279:50781–50789. doi: 10.1074/jbc.M407842200. [DOI] [PubMed] [Google Scholar]
- 11.Verri T, Mandal A, Zilli L, Bossa D, et al. D-glucose transport in decapod crustacean hepatopancreas. Comp Biochem Physiol A Mol Integr Physiol. 2001;130:585–606. doi: 10.1016/s1095-6433(01)00434-2. [DOI] [PubMed] [Google Scholar]
- 12.Woods SC, Lutz TA, Geary N, Langhans W. Pancreatic signals controlling food intake; insulin, glucagon and amylin. Philos Trans R Soc Lond B Biol Sci. 2006;361:1219–1235. doi: 10.1098/rstb.2006.1858. [DOI] [PMC free article] [PubMed] [Google Scholar]
- 13.Fanjul-Moles ML. Biochemical and functional aspects of crustacean hyperglycemic hormone in decapod crustaceans: review and update. Comp Biochem Physiol C Toxicol Pharmacol. 2006;142:390–400. doi: 10.1016/j.cbpc.2005.11.021. [DOI] [PubMed] [Google Scholar]
- 14.Jia C, Hui L, Cao W, Lietz CB, et al. High-definition de novo sequencing of crustacean hyperglycemic hormone (CHH)-family neuropeptides. Mol Cell Proteomics. 2012;11:1951–1964. doi: 10.1074/mcp.M112.020537. [DOI] [PMC free article] [PubMed] [Google Scholar]
- 15.Mazur MT, Cardasis HL, Spellman DS, Liaw A, et al. Quantitative analysis of intact apolipoproteins in human HDL by top-down differential mass spectrometry. Proc Natl Acad Sci U S A. 2010;107:7728–7733. doi: 10.1073/pnas.0910776107. [DOI] [PMC free article] [PubMed] [Google Scholar]
- 16.Cabras T, Pisano E, Montaldo C, Giuca MR, et al. Significant modifications of the salivary proteome potentially associated with complications of Down syndrome revealed by top-down proteomics. Mol Cell Proteomics. 2013;12:1844–1852. doi: 10.1074/mcp.M112.026708. [DOI] [PMC free article] [PubMed] [Google Scholar]
- 17.Castagnola M, Messana I, Inzitari R, Fanali C, et al. Hypo-phosphorylation of salivary peptidome as a clue to the molecular pathogenesis of autism spectrum disorders. J Proteome Res. 2008;7:5327–5332. doi: 10.1021/pr8004088. [DOI] [PubMed] [Google Scholar]
- 18.Tran JC, Zamdborg L, Ahlf DR, Lee JE, et al. Mapping intact protein isoforms in discovery mode using top-down proteomics. Nature. 2011;480:254–258. doi: 10.1038/nature10575. [DOI] [PMC free article] [PubMed] [Google Scholar]
- 19.Chung JS, Zmora N, Katayama H, Tsutsui N. Crustacean hyperglycemic hormone (CHH) neuropeptidesfamily: Functions, titer, and binding to target tissues. Gen Comp Endocrinol. 2010;166:447–454. doi: 10.1016/j.ygcen.2009.12.011. [DOI] [PubMed] [Google Scholar]
- 20.Collier TS, Muddiman DC. Analytical strategies for the global quantification of intact proteins. Amino acids. 2012;43:1109–1117. doi: 10.1007/s00726-012-1285-z. [DOI] [PubMed] [Google Scholar]
- 21.Waanders LF, Hanke S, Mann M. Top-down quantitation and characterization of SILAC-labeled proteins. J Am Soc Mass Spectrom. 2007;18:2058–2064. doi: 10.1016/j.jasms.2007.09.001. [DOI] [PubMed] [Google Scholar]
- 22.Michalski A, Damoc E, Hauschild JP, Lange O, et al. Mass spectrometry-based proteomics using Q Exactive, a high-performance benchtop quadrupole Orbitrap mass spectrometer. Mol Cell Proteomics. 2011;10:M111, 011015. doi: 10.1074/mcp.M111.011015. [DOI] [PMC free article] [PubMed] [Google Scholar]
- 23.Zubarev RA, Makarov A. Orbitrap mass spectrometry. Anal Chem. 2013;85:5288–5296. doi: 10.1021/ac4001223. [DOI] [PubMed] [Google Scholar]
- 24.Zhang J, Xin L, Shan B, Chen W, et al. PEAKS DB: de novo sequencing assisted database search for sensitive and accurate peptide identification. Mol Cell Proteomics. 2012;11:M111, 010587. doi: 10.1074/mcp.M111.010587. [DOI] [PMC free article] [PubMed] [Google Scholar]
- 25.Hsu JL, Huang SY, Chow NH, Chen SH. Stable-isotope dimethyl labeling for quantitative proteomics. Anal Chem. 2003;75:6843–6852. doi: 10.1021/ac0348625. [DOI] [PubMed] [Google Scholar]
- 26.Boersema PJ, Raijmakers R, Lemeer S, Mohammed S, Heck AJ. Multiplex peptide stable isotope dimethyl labeling for quantitative proteomics. Nat Protoc. 2009;4:484–494. doi: 10.1038/nprot.2009.21. [DOI] [PubMed] [Google Scholar]
- 27.Iliuk A, Galan J, Tao WA. Playing tag with quantitative proteomics. Anal Bioanal Chem. 2009;393:503–513. doi: 10.1007/s00216-008-2386-0. [DOI] [PubMed] [Google Scholar]
- 28.Hu S, Xie Y, Ramachandran P, Ogorzalek Loo RR, et al. Large-scale identification of proteins in human salivary proteome by liquid chromatography/mass spectrometry and two-dimensional gel electrophoresis-mass spectrometry. Proteomics. 2005;5:1714–1728. doi: 10.1002/pmic.200401037. [DOI] [PubMed] [Google Scholar]
- 29.Fang L, Kaake RM, Patel VR, Yang Y, et al. Mapping the protein interaction network of the human COP9 signalosome complex using a label-free QTAX strategy. Mol Cell Proteomics. 2012;11:138–147. doi: 10.1074/mcp.M111.016352. [DOI] [PMC free article] [PubMed] [Google Scholar]
- 30.Yu Y, Leng T, Yun D, Liu N, et al. Global analysis of the rat and human platelet proteome - the molecular blueprint for illustrating multi-functional platelets and cross-species function evolution. Proteomics. 2010;10:2444–2457. doi: 10.1002/pmic.200900271. [DOI] [PMC free article] [PubMed] [Google Scholar]
- 31.Ranc V, Petruzziello F, Kretz R, Argandona EG, et al. Broad characterization of endogenous peptides in the tree shrew visual system. J Proteomics. 2012;75:2526–2535. doi: 10.1016/j.jprot.2012.01.028. [DOI] [PubMed] [Google Scholar]
- 32.Petruzziello F, Fouillen L, Wadensten H, Kretz R, et al. Extensive characterization of Tupaia belangeri neuropeptidome using an integrated mass spectrometric approach. J Proteome Res. 2012;11:886–896. doi: 10.1021/pr200709j. [DOI] [PubMed] [Google Scholar]
- 33.Verley DR, Doan V, Trieu Q, Messinger DI, Birmingham JT. Characteristic differences in modulation of stomatogastric musculature by a neuropeptide in three species of Cancer crabs. J Comp Physiol A Neuroethol Sens Neural Behav Physiol. 2008;194:879–886. doi: 10.1007/s00359-008-0359-6. [DOI] [PubMed] [Google Scholar]
- 34.Hsu YW, Messinger DI, Chung JS, Webster SG, et al. Members of the crustacean hyperglycemic hormone (CHH) peptide family are differentially distributed both between and within the neuroendocrine organs of Cancer crabs: implications for differential release and pleiotropic function. J Exp Biol. 2006;209:3241–3256. doi: 10.1242/jeb.02372. [DOI] [PubMed] [Google Scholar]
- 35.Kharchenko A, Vladimirov G, Heeren RM, Nikolaev EN. Performance of Orbitrap mass analyzer at various space charge and non-ideal field conditions: simulation approach. J Am Soc Mass Spectrom. 2012;23:977–987. doi: 10.1007/s13361-011-0325-3. [DOI] [PubMed] [Google Scholar]
- 36.Hsu YW, Weller JR, Christie AE, de la Iglesia HO. Molecular cloning of four cDNAs encoding prepro-crustacean hyperglycemic hormone (CHH) from the eyestalk of the red rock crab Cancer productus: identification of two genetically encoded CHH isoforms and two putative post-translationally derived CHH variants. Gen Comp Endocrinol. 2008;155:517–525. doi: 10.1016/j.ygcen.2007.09.001. [DOI] [PubMed] [Google Scholar]
- 37.Kegel G, Reichwein B, Weese S, Gaus G, et al. Amino acid sequence of the crustacean hyperglycemic hormone (CHH) from the shore crab, Carcinus maenas. FEBS letters. 1989;255:10–14. doi: 10.1016/0014-5793(89)81051-8. [DOI] [PubMed] [Google Scholar]
- 38.Jia C, Lietz CB, Ye H, Hui L, et al. A multi-scale strategy for discovery of novel endogenous neuropeptides in the crustacean nervous system. J Proteomics. 2013 doi: 10.1016/j.jprot.2013.06.021. doi: 10.1016/j.jprot.2013.1006.1021. [DOI] [PMC free article] [PubMed] [Google Scholar]
- 39.Kovanich D, Cappadona S, Raijmakers R, Mohammed S, et al. Applications of stable isotope dimethyl labeling in quantitative proteomics. Anal Bioanal Chem. 2012;404:991–1009. doi: 10.1007/s00216-012-6070-z. [DOI] [PubMed] [Google Scholar]
- 40.Sun Z, Qin H, Wang F, Cheng K, et al. Capture and dimethyl labeling of glycopeptides on hydrazide beads for quantitative glycoproteomics analysis. Anal Chem. 2012;84:8452–8456. doi: 10.1021/ac302130r. [DOI] [PubMed] [Google Scholar]
- 41.Dottavio-Martin D, Ravel JM. Radiolabeling of proteins by reductive alkylation with [14C]formaldehyde and sodium cyanoborohydride. Anal Biochem. 1978;87:562–565. doi: 10.1016/0003-2697(78)90706-6. [DOI] [PubMed] [Google Scholar]
- 42.Means GE, Feeney RE. Reductive alkylation of proteins. Anal Biochem. 1995;224:1–16. doi: 10.1006/abio.1995.1001. [DOI] [PubMed] [Google Scholar]
- 43.Peterson AC, Russell JD, Bailey DJ, Westphall MS, Coon JJ. Parallel reaction monitoring for high resolution and high mass accuracy quantitative, targeted proteomics. Mol Cell Proteomics. 2012;11:1475–1488. doi: 10.1074/mcp.O112.020131. [DOI] [PMC free article] [PubMed] [Google Scholar]
- 44.Aquiloni L, Giulianini PG, Mosco A, Guarnaccia C, et al. Crustacean hyperglycemic hormone (cHH) as a modulator of aggression in crustacean decapods. PLoS One. 2012;7:e50047. doi: 10.1371/journal.pone.0050047. [DOI] [PMC free article] [PubMed] [Google Scholar]
- 45.Goy MF. Activation of membrane guanylate cyclase by an invertebrate peptide hormone. J Biol Chem. 1990;265:20220–20227. [PubMed] [Google Scholar]
- 46.Sedlmeier D. The crustacean hyperglycemic hormone (CHH) releases amylase from the crayfish midgut gland. Regul Pept. 1988;20:91–98. doi: 10.1016/0167-0115(88)90042-0. [DOI] [PubMed] [Google Scholar]
- 47.Glowik RM, Golowasch J, Keller R, Marder E. D-glucose-sensitive neurosecretory cells of the crab Cancer borealis and negative feedback regulation of blood glucose level. J Exp Biol. 1997;200:1421–1431. doi: 10.1242/jeb.200.10.1421. [DOI] [PubMed] [Google Scholar]
- 48.Sanchez-Paz A, Garcia-Carreno F, Muhlia-Almazan A, Peregrino-Uriarte AB, et al. Usage of energy reserves in crustaceans during starvation: status and future directions. Insect Biochem Mol Biol. 2006;36:241–249. doi: 10.1016/j.ibmb.2006.01.002. [DOI] [PubMed] [Google Scholar]
Associated Data
This section collects any data citations, data availability statements, or supplementary materials included in this article.