

Abstract
An understanding of the mechanisms regulating cellular responses has recently been augmented by innovations enabling the observation of phenotypes at high spatiotemporal resolution. Technologies such as microfluidics have sought to expand the throughput of these methods, although assimilation with advanced imaging strategies has been limited. Here, we describe the pairing of high resolution time-lapse imaging with microfluidic multiplexing for the analysis of cellular dynamics, utilizing a design selected for facile fabrication and operation, and integration with microscopy instrumentation. This modular, medium-throughput platform enables the long-term imaging of living cells at high numerical aperture (via oil immersion) by using a conserved 96-well, ~6 × 5 mm2 imaging area with a variable input/output channel design chosen for the number of cell types and microenvironments under investigation. In the validation of this system, we examined fundamental features of cell cycle progression, including mitotic kinetics and spindle orientation dynamics, through the high-resolution parallel analysis of model cell lines subjected to anti-mitotic agents. We additionally explored the self-renewal kinetics of mouse embryonic stem cells, and demonstrate the ability to dynamically assess and manipulate stem cell proliferation, detect rare cell events, and measure extended time-scale correlations. We achieved an experimental throughput of >900 cells/experiment, each observed at >40× magnification for up to 120 h. Overall, these studies illustrate the capacity to probe cellular functions and yield dynamic information in time and space through the integration of a simple, modular, microfluidics-based imaging platform.
Keywords: live cell imaging, cell cycle kinetics, embryonic stem cells, multiplexed microscopy, fluorescent-tagged molecules
Insight, innovation, integration
The dynamics of regulatory networks that underlie cellular functions are increasingly studied by live cell microscopy. However, current lab-scale approaches to capture cellular kinetics are often optimized either for high spatial resolution, high temporal resolution, or high experimental throughput. Here, we developed a microfluidic imaging platform that balances spatiotemporal resolution, experimental throughput, and ease of operation and construction. We explored cell cycle and proliferation kinetics for model cell lines and embryonic stem cells, simultaneously analyzing >900 cells, under multiple perturbations, per 5 day experiment. We identified rare and prolonged mitotic events, including slippage under mitotic arrest and long-term synchronous division timing, highlighting the potential of this technology to measure extended time-scale correlations in the investigation of cellular dynamics.
Introduction
Cell signaling pathways provide the central circuitry to respond to environmental changes, influence internal programs for growth and differentiation, and cooperatively integrate various inputs for cellular homeostasis. Increasingly, the kinetics of these signaling processes are being interrogated by microscopic tracking of fluorescently-tagged molecules in living cells1, 2. High-resolution spatial observations have demonstrated the role of molecular, organelle, and cytoskeletal compartmentalization in directing cellular responses3, whereas coupled high-fidelity temporal measurements provide the ordering of these signaling events. For example, these techniques revealed internal cellular dynamics (such as membrane receptor and signaling molecule turnover4) that affect cell fate decisions (e.g., migration and cell division5, 6) and multi-cellular tissue interactions (e.g., during embryonic development and disease7, 8). However, in these examples, the detailed understanding of cellular kinetics has been slowed, on the one hand, by the inadequate throughput of high-resolution microscopy and, on the other, by the limited range of cellular measurements which can be obtained in current high-throughput (but low spatiotemporal resolution) screening systems. Accelerating the throughput of these experiments would not only reveal the comprehensive capabilities of regulatory networks9, but also enhance applications such as drug screening by elucidating new compound actions10.
Progress in cellular dynamics has mirrored improvements in microscopic imaging systems, including environmental controls to permit cell growth during extended time-lapse recording and autofocus systems for image stability. Currently, microscopic observations at high resolution require dedicated imaging instrumentation and are primarily restricted to serial analysis. Miniaturized platforms, including multiwell configurations and microfabrication technologies, have facilitated the assessment of cellular responses to many stimuli in parallel. Microfluidics-based approaches, in particular, provide substantial spatial and temporal control over soluble environments, and have been developed for the culture of a wide range of cell types11–19. However, widespread utilization of these platforms has been limited, either due to the complex fabrication and operation of multi-layer valved devices, or to the cost of automated commercial systems. As such, the potential benefits of integrating microfluidic technologies with high spatiotemporal resolution microscopy have yet to be fully realized9.
Here, we present a microfluidic platform for live cell imaging in multiple isolated microenvironments longitudinally in time. The design of this platform incorporates a balance between imaging resolution, experimental throughput, and simplicity for ease of construction and implementation. The platform is compatible with high numerical aperture oil-immersion objectives for high-resolution subcellular imaging. Its modular, multiplexed design permits the simultaneous time-lapse microscopy of many cell types, harboring various biomolecular reporters, under numerous perturbations, and within the same device over many days, thereby increasing the throughput available on a single imaging workstation. We obtained a number of key measurements such as mitotic timing and spindle orientation for immortalized cell lines as well as temporal profiling of cell proliferation and lineage analysis for mouse embryonic stem (ES) cells. These data, consistent with standard tissue culture and further enabling the novel detection of rare and long-duration cellular events, demonstrate the benefit of a simple microfluidic platform in which high-resolution time-lapse microscopy can be carried out for many cell types, under an array of experimental conditions, and over long time courses.
Results and Discussion
Microdevice design and operation
Figure 1 illustrates the single-layer microfluidic design for multiplexed high-resolution time-lapse microscopy within devices that are inexpensive, disposable, easy to fabricate and operate, and compatible with highly sensitive cell types. For high-resolution microscopy using high numerical aperture (NA) oil-immersion objectives, we designed a 96-microwell array (8 rows × 12 columns) within a scanning region of ~5 × 6 mm (Fig. 1A, B), smaller than the typical lens excursion limit (~10 mm) before oil reapplication is required. This miniaturized array footprint also reduced stage translation distances, speeding multi-position image capture and increasing temporal resolution.
Figure 1.
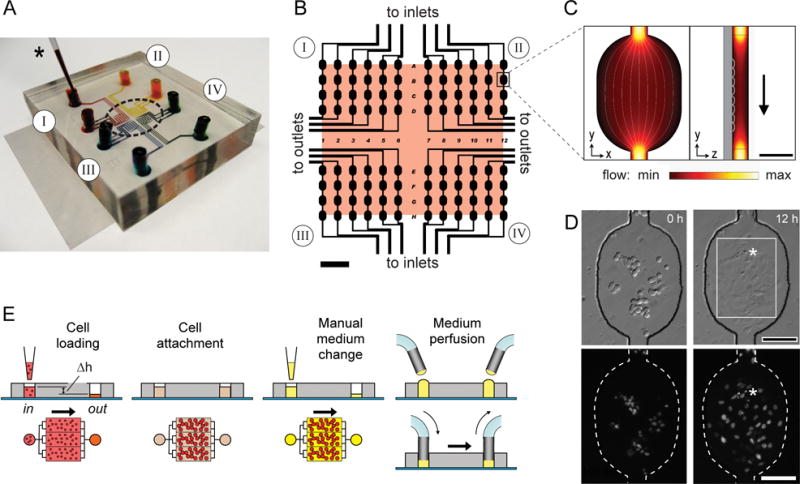
Microfluidic cell culture array design and operation. (A) Photograph of a device with 4 separate fluidic circuits (I–IV), each filled with a different dye loaded by pipet (*) and containing a single inlet and outlet reservoir. (B) Schematic of the microarray layout with 96 wells with the 6 × 5 mm2 scanning area shaded. Inlet and outlet channels are connected to one or more reservoirs to subdivide the cell and medium conditions (SI Fig. 1). (C) Fluid flow through a microwell is visualized using a finite element model. Cells preferentially attach in the microwells, where flow is slower than in connecting channels. (D) H2B-EYFP-labeled PtK2 cells in a single microwell are shown after seeding (left); 12 h later (right), they attached, spread, and divided (*). A 40× objective field of view is indicated (white box). (E) Cells are gently seeded by gravity, driven by the difference in fluid height in the inlet and outlet reservoirs (Δh). For cell attachment, reservoir levels are equalized to halt fluid flow. Medium is refreshed either by manual pipetting or by connection of sterile tubing for periodic or continuous perfusion. Scale bars: 1 mm (B), 100 μm (C, D).
The microwell array comprised a single-layer microfluidic network cast in elastomeric polydimethylsiloxane (PDMS) and bonded to a 35 × 50 mm glass coverslip (Fig. 1A). Each microwell (250 × 350 μm; 50 or 100 μm deep) provided a cell-adhesive surface area of 0.074 mm2 and a volume of 3.7 or 7.4 nL (Fig. 1C), for ~400× lower surface area and >10,000× lower volume compared to a standard 96-well microtiter plate. Cells preferentially attached in the microwell center, where fluid velocity is decreased relative to the 50 μm wide connecting channels (Fig. 1 C and D). The microwell configuration also promoted imaging over multiple days, as the cells (typically 10–30 per well) were less likely to traverse from one microwell to another (SI Movie 1). Initial designs included catching pillars17 to increase cell seeding efficiency (SI Fig. 2), but these were removed in the final design as cells crawled up the pillars and out of the microscope focal plane after ~1 day. Considerable versatility in dividing the 96 wells across multiple independent cell/environment combinations is afforded by connecting inlet and outlet channels to one or more reservoirs each (SI Fig. 1). 96 wells were chosen for the design as it provided flexibility for subdividing the microenvironments, although this number could be expanded based on device requirements. For these studies, we commonly used a device with four independent fluidic networks (I – IV), each separated by at least 500 μm to prevent cross-contamination of hydrophobic molecules which can penetrate ~300 μm PDMS over several days (SI Fig. 3).
The fluidic circuit design enables gentle cell seeding into the microdevice by gravity-driven flow (Fig. 1E). Adding 5 μL cell suspension to the inlet reservoir raised the fluid height by ~1mm and induced cells to flow through the device in <1 min. Equalizing inlet and outlet volumes then halted fluid flow, allowing cells to settle and attach to the glass substrate. Fresh media were added by micropipette or, for remote feeding during long-term experiments, by perfusion through sterile tubing added to the reservoirs. Cell culture within microfluidic channels also requires the balanced optimization of nutrient transport and protection from shear forces. The modular design of this platform enabled specific tailoring of these parameters to sensitive cell types such as ES cells, without changing the microchannel pattern. These modifications are addressed in greater detail in SI Methods. Overall, this platform enables the rapid and facile loading of many different cell types, without multilayer interconnects that exist in more complex devices, and the establishment of many isolated soluble microenviroments for imaging at high numerical apertures. Further, the devices are reconfigurable both to the physical and nutritive requirements of the cell types under investigation, and to the multiplexing needs of the researcher.
Near-simultaneous microscopy of cell cycle perturbation by multiple anti-mitotic drugs
As a case study, we first used the microfluidic imaging platform to quantify the effects of several anti-mitotic drugs on cell cycle kinetics in two mammalian cell lines, a Potorous tridactylis (kangaroo rat) kidney cell line (PtK2) and a human cervical carcinoma (HeLa). PtK2 cells, which remain flattened during mitosis and contain only a few large chromosomes, are ideal for mitotic imaging studies20. HeLa cells represent model human cancerous targets of anti-mitotic agents. Both cell types harbored fluorescent protein fusions to monitor chromosome dynamics (histone H2B-EYFP, enhanced yellow fluorescent protein) or mitotic spindle dynamics (EYFP-tubulin)21. We monitored cell division in an array of cell types, subcellular EYFP markers, and anti-mitotic agents at high resolution using a 40× (1.3 NA) oil-immersion objective. It is important to note that these anti-mitotic drugs, which are hydrophobic small molecules, were used at concentrations well above their EC50s22, in part due to the potential for loss into the PDMS device walls (see SI Fig. 3). The effectiveness of the drug treatments were verified by monitoring microtubule morphology. Near simultaneous observation of these distinct experimental conditions taken at five minute intervals over five days demonstrates the increased throughput of the platform (Fig. 2, SI Movie 1). Cells survived, divided, and responded to exogenous agents within the device in a manner similar to that of bulk tissue culture.
Figure 2.
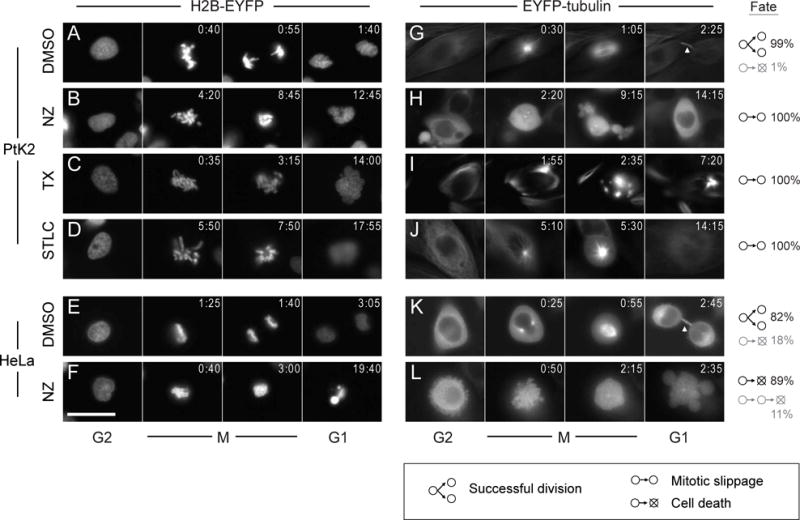
Time-lapse montage of cells subjected to drugs altering microtubule stability or Eg5 activity in the microfluidic device. Individual PtK2 and HeLa cells are shown before (G2), during (M) and after (G1) mitosis at the indicated elapsed times (h:min). The frequency of cell fates after mitotic entry (division, slippage, or apoptosis) is shown for each condition. Histone H2B-EYFP labels chromosomal DNA (A–F), and EYFP-tubulin labels microtubules (G–L). Cells subject to vehicle control (0.1% DMSO) mostly divided successfully (A,E,G,K). Nocodazole (NZ; 300 nM) destabilized microtubules (H,L) preventing chromosomal separation, after which PtK2 cells exit mitosis and survive (B) but HeLa cells die (F). Taxol (TX; 10 μM) induced ectopic microtubule foci (I) preventing chromosomal alignment; PtK2 chromosomes decondensed into micronuclei after mitotic slippage (C). Treatment with Eg5 inhibitor STLC (10 μM) caused monopolar mitotic spindles (J) and a characteristic rosette configuration of misaligned chomosomes (D); PtK2 cells survived following mitotic exit. Scale bar: 25 μm.
Successful cell division in the microfluidic device was observed in nearly all PtK2 cells (99%, n=139) and most HeLa cells (82%, n=112) exposed to vehicle control conditions. Nocodazole (NZ) destabilizes microtubules, disrupting metaphase spindle attachment to kinetochores23, and causing prometaphase arrest and, in many cell types, subsequent cell death24. In the microfluidic device, treatment with 300 nM NZ prevented the alignment and segregation of condensed chromosomes. Whereas NZ-exposed HeLa cells exhibited hypercondensed chromosomes and blebbing (Fig. 2 F and L) characteristic of apoptotic death, all PtK2 cells survived and decondensed their chromosomes again after mitotic slippage (Fig. 2B)25. Taxol (TX) stabilizes microtubules and interferes with their normal breakdown during cell division26. Treatment of cells with 10 μM TX induced ectopic microtubule foci (Fig. 2I) and prevented chromosomal alignment and separation. All TX-treated PtK2 cells exited mitosis without cell division and decondensed chromosomes into micronuclei (Fig. 2C). Surprisingly, PtK2 cells with fragmented nuclei were still able to enter mitosis a second time (SI Fig. 4B), although this event was observed infrequently. The mitotic inhibitor S-trityl-L-cysteine (STLC) targets mitotic kinesin Eg5, thereby preventing the formation of the bipolar mitotic spindle27. Treatment of cells with 10 μM STLC resulted in monopolar mitotic spindles (Fig. 2J) and a characteristic rosette configuration of misaligned chomosomes (Fig. 2D). All STLC-treated PtK2 cells were able to decondense their chromosomes and exit mitosis, similar to cells with NZ- and TX-induced microtubule perturbations.
Overall, mitosis in the microfluidic platform closely matched behaviors in bulk tissue culture25, 28, 29. Moreover, the ability to query multiple cell types with different fluorescently-tagged proteins under the perturbation of many drugs, all in a single device, increased experimental throughput and permitted the observation of population variations and rare events (e.g. multiple divisions under taxol arrest). Simultaneous measurements during multiplexed experiments also eliminated the conventional daily variations that can increase intrinsic biological variability in serially-performed experiments.
Temporal quantification of mitotic delay
We next sought to quantify how perturbation of microtubules or mitotic spindles affects mitotic progression in PtK2 and HeLa cells. We identified the initiation time and duration of each mitotic phase in H2B-EYFP-labeled cells exposed to multiple drug treatments (Fig. 3A and B, SI Fig. 4A). Chromosome condensation timing (prophase length) was unaffected in NZ-treated PtK2 cells, suggesting that microtubule polymerization plays no role in condensation or early mitotic entry. We measured drug-induced mitotic delays from prometaphase to mitotic exit, since prometaphase initiation was more reliably identified by morphological cues. Cells treated with TX exited mitosis most quickly (4.1 ± 1.5 h, mean ± S.D.), followed by STLC (6.6 ± 2.5 h), and NZ-treated cells (9.0 ± 2.9 h); DMSO-treated control PtK2 cells completed cell division in 1.41 ± 0.33 h. The mitotic slippage time appeared inversely correlated with the number of attached kinetochores: TX (1–2 attached) ~ STLC (~1 attached) < NZ (none attached), consistent with a role for the spindle assembly checkpoint in mitotic slippage time, in addition to its role in delaying anaphase onset28, 29.
Figure 3.
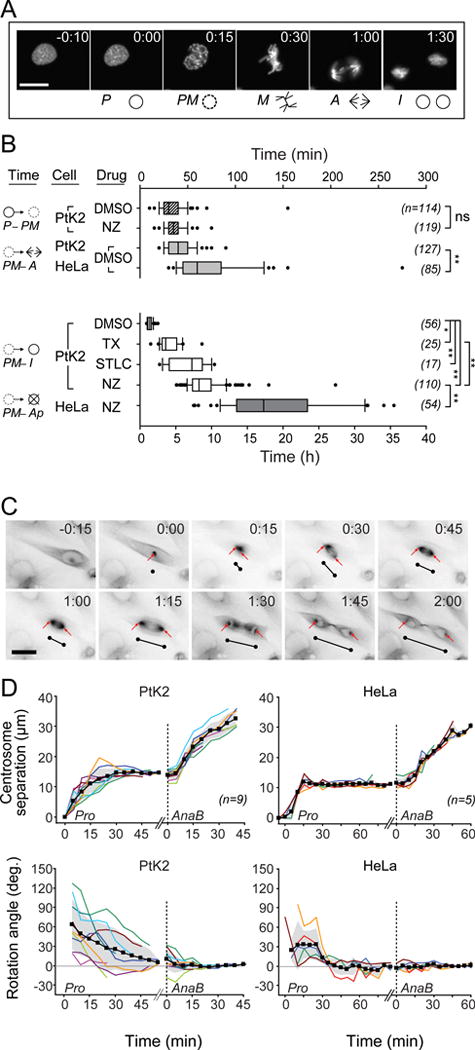
Temporal and spatial measurements of mitosis in the device. (A) Representative frames show initiation of mitotic stages in H2B-EYFP-expressing cells: prophase (P), prometaphase (PM), metaphase (M), anaphase (A), and interphase (I). (B) PtK2 and HeLa cells were exposed to anti-mitotic drugs as in Fig. 2. Mitotic interval times represent chromosome condensation (P–PM), alignment to the metaphase plate (PM–A), and resolution to successful division or mitotic slippage (PM–I) or apoptosis (PM–Ap). NZ affected chromosome separation but not condensation (P–PM). Mitotic delay (PM-I/Ap) correlated with the number of unattached chromosomes (NZ > STLC ~ TX > DMSO). HeLa cells initiated anaphase later than PtK2 cells (PM–A), and did not survive NZ treatment. Box plots indicate median, percentiles (box: 25–75%; whiskers: 10–90%), and outliers. ns, not significant; *, p<0.01; **, p<0.001 by Mann-Whitney or Kruskal-Wallace tests. (C) Time series of mitosis in EYFP-tubulin-labeled PtK2 cells. Arrows mark centrosome position; black lines indicate separation distance and orientation, offset from the cell for clarity. (D) Spindle pole separation and rotation (relative to the cytokinesis axis) were quantified from calibrated video images, showing mean (black), S.D. (gray shading) and individual cells (colors). Due to variation in metaphase timing, curves are broken to align anaphase B (AnaB, dotted line) and prophase (Pro) movements. Scale bars: 25 μm (A, C).
HeLa cells progressed through mitosis more slowly than PtK2 cells. In vehicle controls, HeLa chromosome alignment and separation (prometaphase to anaphase) was 37% (10% – 58% interquartile range) slower than PtK2 cells; HeLa cells also showed more variability in this period (SI Fig. 5B). Unlike PtK2 cells, NZ-treated HeLa cells all underwent cell death following failed mitoses after ~18 h (mean), consistent with previous measurements in standard bulk cell culture22, 25, 30, 31. A small fraction (11%, n=54) of NZ-treated HeLa cells recovered briefly with decondensed chromosomes, attempted mitosis again, but did not survive thereafter (SI Fig. 5D). The observation of rare and prolonged events in these devices (here, 20 to 35 h elapsed between the first mitotic initiation and eventual apoptosis) underscore a key benefit of long-term multiplexed imaging experiments. Furthermore, the large data set generated for this analysis (two cell lines, two fluorescent markers, and four microenvironmental conditions) was carried out in three 3–5 day time-lapse experiments imaging 504 mitotic events among ~1200 cells in 48 microwells. A serial approach, by contrast, would have required months to acquire the same sample size.
Spatial dynamics of subcellular components during mitosis
As an example of spatial quantification in the microdevice, we compared spindle pole separation and rotation during mitosis in EYFP-tubulin-expressing PtK2 versus HeLa cells (Fig. 3C). PtK2 centrosomes reached their metaphase separation distance (14.1 ± 1.7 μm) asymptotically in ~30 min; HeLa centrosomes reached their 11.2 ± 0.6 μm metaphase distance twice as quickly despite similar maximum velocities (0.83 ± 0.09 vs. 0.82 ± 0.27 μm/min). Initial centrosome separation often did not coordinate with the eventual cytokinesis axis, especially in PtK2 cells (Fig. 3D). The centrosome pair smoothly rotated to the cytokinesis axis just before chromosome separation in PtK2 cells or ~45 min prior in HeLa cells. We measured centrosome separation velocity during anaphase B/telophase in PtK2 cells (0.89 ± 0.23 μm/min) to be nearly twice that of HeLa cells (0.46 ± 0.09 μm/min). Similar spatiotemporal measurements, such as nuclear translocation of proteins or cytoskeletal movements, represent additional phenotypic dimensions quantifiable with high-resolution microscopy and useful for elucidating compound targets in secondary drug screens32, 33.
Time-lapse analysis of embryonic stem cell proliferation kinetics
ES cells, both mouse and human, exhibit distinctive cell cycle features that have been linked with self-renewal and the maintenance of pluripotency34. We explored the utility of the microfluidic imaging platform for investigating stem cell proliferation kinetics with improved temporal fidelity. Initial experiments utilizing the devices configured for cell line studies demonstrated a decline in ES cell survival and proliferation over time. Consequently, we further optimized the microfluidic device for mouse ES cell culture through a series of straightforward modifications outlined in SI Methods and SI Fig. 6. SI Tables 1 and 2 specifically illustrate the perfusion parameters explored. To promote adequate nutrient delivery to ES cells, the height of the channels was doubled, continuous low-shear flow conditions were instituted, and the material thickness of the PDMS above the internal imaging areas was minimized to promote gas exchange. Through incorporation of these parameters we accomplished efficient loading, attachment, and survival of mouse ES cells in the microfluidic channels, and observed ES cell proliferation with concurrent maintenance of the pluripotency marker, Oct4, over 4 days of analysis (SI Fig. 7).
Analogous to the cell line studies, we used mouse ES cells expressing an H2B-EGFP fusion protein to facilitate examination of ES cell proliferation dynamics (Fig. 4). In these studies, mouse ES cells were cultured within the microfluidic device on previously incorporated mouse embryonic fibroblast (MEF) feeder layers with perfusion of ES cell growth medium containing leukemia inhibitory factor (LIF). The time-lapse imaging interval was set to every 3 min to obtain sufficient temporal resolution of ES cell kinetics, and 24–32 independent positions were interrogated per experiment. Representative images sampled at 8 h intervals from the time-lapse acquisition of a single position demonstrate the proliferation of the ES cells under these conditions (Fig. 4A). A complete time-lapse sequence for 24 positions acquired in parallel over the course of a 60 h experiment is shown in SI Movie 2. An overlaid fluorescence/phase contrast sequence for one position highlights the highly dynamic movement of the ES cells and the MEF feeder layer concomitant with the extensive ES cell proliferation (SI Movie 3). The compatibility of this platform with both feeder independent mouse ES cell lines and co-cultures of mouse ES cells with supportive feeder layers effectively expands the scope of stem cell lines and culture conditions that can be examined in the device. Taken together, these results suggest that the device parameters employed provided sufficient nutrients, balanced with local or upstream cell-derived factors for ES cell survival and proliferation. Future experiments could continue to explore these mechanisms by manipulating flow rates, examining co-culture systems, and adjusting device configurations for analyzing microwells that are connected in series. Previous reports have indicated that a number of parameters (e.g. delivery of nutrients and paracrine signaling) can be precisely varied utilizing microfluidic control. For example, features inherent to microfluidic stem cell culture platforms, such as device configurations and perfusion conditions, dictate delivery of nutrients and paracrine stimuli and have been shown to influence cell functions16, 35, 36.
Figure 4.
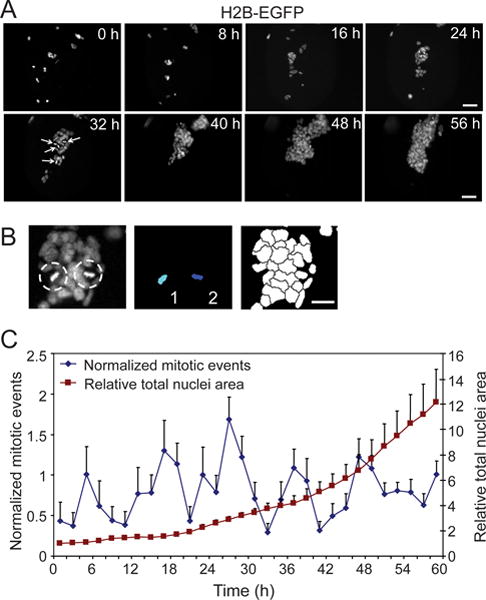
Quantification of embryonic stem cell division frequency. (A) Image frames selected at 8h intervals from the time-lapse acquisition of a single microwell position. The proliferation of H2B-EGFP mouse ES cells, under self-renewing conditions within the microfluidic device, is demonstrated. Arrows (32 h time point) indicate cells in metaphase-early anaphase. (B) (top) Representative image field illustrating two H2B-EGFP ES cells with characteristic metaphase morphology (dashed circles). Automated image analysis was utilized in combination with manual inspection to identify and quantify metaphase nuclei (middle), and measure total nuclei area (bottom) for each time-lapse frame. (C) The quantification of the number of mitotic events, defined by the presence of metaphase nuclei, and displayed per 2 h increments (blue line, n=11 microwells ± S.D.). Total nuclei area (red line, n=11 microwells ± S.D.) was used to control for the increase in cell number during proliferation and to normalize the mitotic frequency. Scale bars: 50 μm (A), 20 μm (B).
Tracking chromosomal movements not only provides information about the cell cycle kinetics of individual cells, but it can also be used to elucidate overall trends within a population. For example, the recognition of typical nuclear/chromosome morphologies indicative of cell proliferation or other cell fates have been routinely used in high-throughput screens that employ imaging readouts37–39. Here, we took advantage of the time-lapse acquisition of multiple positions in parallel to obtain a collective measurement of ES cell proliferation within the context of the microfluidics platform. For this analysis, the identification of cell divisions, or ‘mitotic events’, was principally based on the characteristic morphology of the H2B-EGFP during metaphase (Fig. 4B). The mitotic events were identified either through manual inspection or automated image analysis (Fig. 4B), and together with automated measurements of total nuclei area to normalize for cell numbers, the number of mitotic events within 2 h time blocks was calculated (Fig. 4C). Interestingly, an apparent synchronization in division frequency was observed, even when assessed as a collective average of numerous positions from separate quadrants in the device. The periods between the peaks in division frequency suggest an average cell cycle time of 10–12 h, an estimation that is within the reported range for mouse ES cells40, 41. The presence of this trend derived from the collective proliferation dynamics is indicative of the tightly regulated cell cycle time for mouse ES cells, with the substantially reduced G1 phase recognized for ES cells likely contributing to this process42–45. Future experiments could exploit features of the microfluidics system to study mechanisms that contribute to this synchronization effect. These include the capacity to manipulate soluble environments during time-lapse observation. For example, as a demonstration of dynamic perturbation in the context of cell cycle analysis, we explored the manipulation of mouse ES cell cycle progression, through the introduction of the mitotic inhibitor STLC during the course of microfluidic cell culture with continuous image acquisition (SI Fig. 8). Overall, the means to acquire temporal measurements suitable for the dual assessment of stem cell kinetics at the single cell as well as a population level is a key feature of this type of platform.
Lineage tracking and assessment of cell cycle kinetics for embryonic stem cells
The ability to track cell divisions and chromosomal dynamics for the statistically rigorous examination of cell cycle kinetics can be augmented by the assimilation of lineage relationships, which can provide additional insights regarding regulatory mechanisms. Displayed in Figure 5A are segments of 20 lineage relationships and their division timings, some through 4 generations, identified from the analysis of 7 different positions from a single experiment. Select images from one of these lineage hierarchies are highlighted in Figure 5B, showing the progression of a single ES cell to 8 cells under self-renewing conditions on a MEF feeder layer over approximately 25 h, with the associated divisions demarcated. Within this sampling of lineage relationships, the direct quantification of the complete cell cycle times (metaphase-metaphase) for the first division generation demonstrates an average cycle timing of 11.53 h ± 2.70 h, n=40 (Fig. 5C). This duration corresponds closely with the measurements based on the collective proliferation dynamics (Fig. 4C). The direct quantification analysis additionally illustrated the presence of select cell divisions that exhibited more substantial deviations from this average, which were more prevalent among second and third generation divisions (Fig. 5A, C). Furthermore, in order to specifically assess differences between the division timings of sister-related cells, metaphase-metaphase times for sister pairings, from first through third generation divisions, were plotted against each other (Fig. 5D). A tight correlation was observed, demonstrated by the slope of the best-fit linear regression that approached 1.00 (0.96, R2=0.94), and the average difference in sister division times which was 0.80 h ± 0.80 h, n=40. Interestingly, the subset of cells which demonstrated the extended mitotic timings similarly exhibited a strong correlation between sister pairings (Fig. 5D), suggesting that the factors responsible for the division synchronicity of sister-related cells operate independent of the cell cycle duration. Currently, the mechanisms that influence deviations from the average timing in this culture context remain unidentified. However, further studies utilizing the microfluidics platform could facilitate the examination of promising regulatory mechanisms, including any potential role of localized soluble factors, early stages of differentiation induction, or stochastic variation in ES cell proliferation kinetics46–48.
Figure 5.
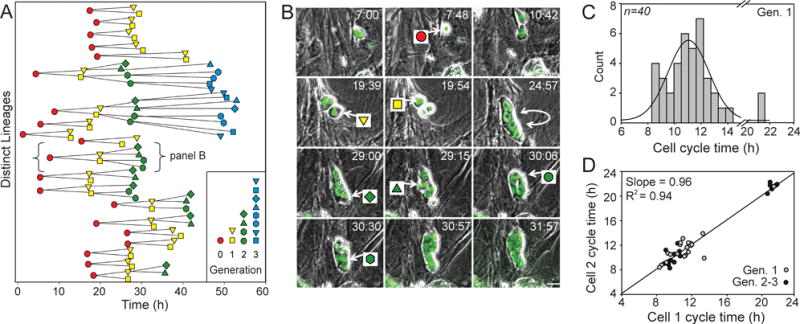
Analysis of cell cycle kinetics and lineage relationships of embryonic stem cells. (A) The cell division time points for identifiable stages of 20 distinct H2B-EGFP ES cell lineage hierarchies, some through 4 generations, were compiled from the analysis of 7 separate microwells from a single representative experiment under self-renewing conditions (+LIF, MEF feeder layer). (B) Overlaid fluorescent and phase contrast image frames for an example lineage relationship. This image sequence illustrates 7 cell divisions, corresponding to the divisions indicated in the bracketed hierarchy in panel A. (C) Histogram demonstrating the complete cell cycle durations, based on metaphase to metaphase times, for generation #1 (Gen. 1) divisions within the depicted lineage relationships (n=40). (D) Metaphase to metaphase times for sister pairings plotted against each other, for generation #1 (gray circles, n=20) and generation #2 and #3 (black circles, n=20) divisions. Linear regression analysis showed a strong positive correlation between sister division timings (slope=0.96, R2=0.94). Scale bar, 20 μm.
Microfluidics-integrated imaging platform: summary of enabling features
In these studies, we describe a device platform that permits high numerical aperture imaging of numerous isolated environments with high temporal resolution. To illustrate the multiplexing capacity of this platform, the cell line studies quantifying mitotic kinetics utilized three microfluidic devices and monitored 48 microwells in total for up to 120 h in ~2 weeks of recording. With additional seeding inlets to load more cell types per device (SI Fig. 1), and making use of all 96 microwells in the current device configuration (experiments shown here used less than 40% of the total device capacity), these studies could potentially be performed in a single 5 day experiment. In contrast, serial time-lapses of this length with conventional, single well microscopy would require months and introduce significant day-to-day variability. Modern high throughput systems (HTS) for imaging (e.g. Perkin-Elmer Opera, GE InCell, Cellomics KineticScan, BD Pathway, etc.) provide some of the functionality that we have developed in our platform, but often cannot be modified easily for other imaging modalities9. In the development of this system, we aimed to achieve such advantageous multiplexing properties in conjunction with several additional features: a miniaturized device footprint, which enables the effective utilization of rapid imaging protocols with high numerical aperture objectives, and a simple and modular design for promoting broad applicability for biological experimentation. Towards wider dissemination of simple microfluidics platforms in biology, this platform is amenable to methods of construction and operation within the context of limited microfabrication and automation resources, such as the casting of devices from inexpensive plastic mold masters49 and the compatibility with micropipette fluid handling.
By increasing experimental throughput and spatiotemporal imaging resolution, this platform aids higher-content quantification of cellular dynamics. Analysis of dividing mammalian cells revealed the timing of cell fate choices and subcellular movements, and enabled the identification of rare and prolonged events in the mitotic process. Whereas some of these analyses used manual tracking of video frames, the stem cell experiments employed automated identification of metaphase nuclei to quantify self-renewal kinetics within the microfluidics context. Effective data analysis approaches are critical towards further expansions in throughput. Such automation speeds image analysis but also increases data content50. For example, the spatial registration of cellular events enables correlation with local microenvironment features such as cell-cell interactions at the center or periphery of multicellular bodies (SI Fig. 9). Overall, this approach could facilitate studies examining the effects of microenvironmental factors, including physical cues, such as extracellular matrix, and a range of autocrine and paracrine signals.
The rapid accumulation of large-scale chemical and genome-wide RNA interference-based cellular assays based on end-point analysis (so-called high content analyses)51–53 has provided large numbers of “hits” indicating some biological influence of compounds and genes. The coupled microfluidics and imaging method described here, together with automated analysis software, can serve as a key tool in measuring quantitative spatial and temporal responses that probe the results of these screening experiments more deeply toward understanding their biological targets. In addition, a wide range of traditionally lower-throughput biological assays may benefit from features of this integrated approach, particularly the capacity to speed data acquisition, control environmental variability, and interrogate signaling pathway components simultaneously through parallel analysis.
Materials and Methods
Fabrication and Loading of Cellular Imaging Devices
The microwell array was fabricated in poly(dimethylsiloxane) (PDMS) using soft lithography techniques54 and outlined in detail in SI Methods. Briefly, SU8-50 photoresist (Microchem) was spin-coated on silicon wafers to a thickness of 50 μm, crosslinked by UV exposure through a high-resolution photomask, and developed. PDMS prepolymer and curing agent were mixed in a 10:1 ratio and poured onto the silicon/SU8 mold masters to a depth of 5 mm and cured. Following coring of the inlet and outlet reservoirs, PDMS devices were bonded to 35 × 50 mm glass coverslips using oxygen plasma activation. For ES cell studies, photoresist thickness was increased to 100 μm and PDMS casting depth was reduced to 1 mm, and an unpatterned PDMS layer, covering the inlets and outlets only, was bonded on top of the device layer for structural support. Devices were sterilized and channels treated with serum containing medium (PtK2 or HeLa cells) or 0.1% gelatin solution (ES cells) to provide a cell-adhesive surface. 5 μL PtK2 or HeLa cells were loaded at a concentration of 15 × 106/mL (75,000 total), and allowed to adhere for >8 h prior to time-lapse analysis. Culture medium within the device was refreshed with periodic perfusion. For MEF-ES co-cultures, MEF cells were loaded into 0.1% gelatin treated devices at 2 × 10⁶/mL. After overnight incubation, mouse ES cells were loaded at 2 × 10⁶/mL. For feeder-free ES cell experiments, ES cells were loaded at 5 × 10⁶/mL into 0.1% gelatin coated devices. ES media was refreshed by continuous perfusion (1 μl/h) during time-lapse imaging. Additional details regarding cell culture, device seeding, and medium changes are described in SI Methods.
Time-lapse Imaging
Time-lapse imaging was carried out on a Nikon Ti Eclipse microscope configured with the Perfect Focus drift compensation systems and a high-precision XY stage (Ludl model 96S108-LE; 0.25 μm repeatability). Environmental conditions were controlled by a whole-microscope enclosure (In Vivo Scientifics, St. Louis, MO) that permitted regulation of temperature, humidity and CO2 gas perfusion. Image acquisition and position control was carried out by Nikon Elements software. Experiments typically observed 24–36 microwell positions, selected from multiple quadrants at regular intervals representing a range of sections in the device, and with an imaging interval of 5 min (PtK2 and HeLa cells) or 3 min (mouse ES cells). Acquisition time per well averaged 3–4 s, including XY stage translation, Z focus, and ≤500 ms exposure for each fluorescent color and brightfield image; each “round-trip” required ~2 minutes.
Temporal and Spatial Measurements
For the analysis of PtK2 and HeLa cell cycle kinetics, image sequences were assessed by manually identifying the initiation of mitotic stages for each cell and well, as defined in SI Fig. 4. To quantify spindle dynamics, image sequences were loaded in ImageJ software and centrosome positions were selected as the brightest pixel in the vicinity of centrosomes in tubulin-EYFP-labeled cells. Centrosome separation distance and angle were then calculated from calibrated X-Y position data with a spatial resolution of 1 pixel (0.33 μm). For ES cell proliferation experiments, cellular divisions were quantified based on chromosome morphologies indicated by H2B-EGFP fluorescence. Metaphase nuclei and total nuclei area were quantified utilizing an image analysis pipeline developed with CellProfiler™ analysis software55, and confirmed by manual inspection and enumeration performed in parallel. Details regarding automated analysis are included in SI Methods. Mitotic kinetics within ES cell lineage hierarchies were evaluated by manual tracking of cell divisions and progeny through sequential time-lapse frames.
Supplementary Material
Acknowledgments
We are grateful to Dr. Douglas Melton’s laboratory (Harvard University) for providing the H2B-EGFP fusion mouse ES cell line and the Oct4/EGFP reporter mouse ES cell line, and to Yinghua Guan and David Wood for helpful insights regarding microscopy instrumentation and device fabrication. This work was supported in part by a Seed Grant from the Harvard Stem Cell Institute to SNB and an NIH U54/R21 grant from the NIH SysCODE consortium (5RL2EB008541) to JVS. DRA holds a Career Award at the Scientific Interface from the Burroughs Wellcome Fund.
Footnotes
Author Contributions: DRA, GHU, SNB, and JVS designed research; DRA, GHU, JR, and AM performed research; DRA, GHU, JR, and JVS contributed reagents; DRA, GHU, JR, and AM analyzed data; and DRA, GHU, SNB, and JVS wrote the paper.
References
- 1.Megason SG, Fraser SE. Cell. 2007;130:784–795. doi: 10.1016/j.cell.2007.08.031. [DOI] [PubMed] [Google Scholar]
- 2.Gerlich D, Ellenberg J. Nat Cell Biol. 2003;(Suppl):S14–19. [PubMed] [Google Scholar]
- 3.Kholodenko BN. Nat Rev Mol Cell Biol. 2006;7:165–176. doi: 10.1038/nrm1838. [DOI] [PMC free article] [PubMed] [Google Scholar]
- 4.Yudushkin IA, Schleifenbaum A, Kinkhabwala A, Neel BG, Schultz C, Bastiaens PI. Science. 2007;315:115–119. doi: 10.1126/science.1134966. [DOI] [PubMed] [Google Scholar]
- 5.Lampson MA, Renduchitala K, Khodjakov A, Kapoor TM. Nat Cell Biol. 2004;6:232–237. doi: 10.1038/ncb1102. [DOI] [PubMed] [Google Scholar]
- 6.Machacek M, Hodgson L, Welch C, Elliott H, Pertz O, Nalbant P, Abell A, Johnson GL, Hahn KM, Danuser G. Nature. 2009;461:99–103. doi: 10.1038/nature08242. [DOI] [PMC free article] [PubMed] [Google Scholar]
- 7.Perez-Pomares JM, Foty RA. Bioessays. 2006;28:809–821. doi: 10.1002/bies.20442. [DOI] [PubMed] [Google Scholar]
- 8.Czirok A, Zamir EA, Szabo A, Little CD. Curr Top Dev Biol. 2008;81:269–289. doi: 10.1016/S0070-2153(07)81009-X. [DOI] [PMC free article] [PubMed] [Google Scholar]
- 9.Pepperkok R, Ellenberg J. Nat Rev Mol Cell Biol. 2006;7:690–696. doi: 10.1038/nrm1979. [DOI] [PubMed] [Google Scholar]
- 10.Loo LH, Wu LF, Altschuler SJ. Nat Methods. 2007;4:445–453. doi: 10.1038/nmeth1032. [DOI] [PubMed] [Google Scholar]
- 11.Gomez-Sjoberg R, Leyrat AA, Pirone DM, Chen CS, Quake SR. Anal Chem. 2007;79:8557–8563. doi: 10.1021/ac071311w. [DOI] [PubMed] [Google Scholar]
- 12.King KR, Wang S, Irimia D, Jayaraman A, Toner M, Yarmush ML. Lab Chip. 2007;7:77–85. doi: 10.1039/b612516f. [DOI] [PMC free article] [PubMed] [Google Scholar]
- 13.Wang HY, Bao N, Lu C. Biosens Bioelectron. 2008;24:613–617. doi: 10.1016/j.bios.2008.06.005. [DOI] [PubMed] [Google Scholar]
- 14.Hung PJ, Lee PJ, Sabounchi P, Lin R, Lee LP. Biotechnology and Bioengineering. 2005;89:1–8. doi: 10.1002/bit.20289. [DOI] [PubMed] [Google Scholar]
- 15.Hsieh CC, Huang SB, Wu PC, Shieh DB, Lee GB. Biomed Microdevices. 2009;11:903–913. doi: 10.1007/s10544-009-9307-7. [DOI] [PubMed] [Google Scholar]
- 16.Kim L, Vahey MD, Lee HY, Voldman J. Lab Chip. 2006;6:394–406. doi: 10.1039/b511718f. [DOI] [PubMed] [Google Scholar]
- 17.Zhang B, Kim MC, Thorsen T, Wang Z. Biomed Microdevices. 2009 [Google Scholar]
- 18.Luo C, Zhu X, Yu T, Luo X, Ouyang Q, Ji H, Chen Y. Biotechnology and Bioengineering. 2008;101:190–195. doi: 10.1002/bit.21877. [DOI] [PubMed] [Google Scholar]
- 19.Cheong R, Wang CJ, Levchenko A. Mol Cell Proteomics. 2009;8:433–442. doi: 10.1074/mcp.M800291-MCP200. [DOI] [PMC free article] [PubMed] [Google Scholar]
- 20.Roos UP. Chromosoma. 1973;40:43–82. doi: 10.1007/BF00319836. [DOI] [PubMed] [Google Scholar]
- 21.Botvinick EL, Venugopalan V, Shah JV, Liaw LH, Berns MW. Biophys J. 2004;87:4203–4212. doi: 10.1529/biophysj.104.049528. [DOI] [PMC free article] [PubMed] [Google Scholar]
- 22.Shi J, Orth JD, Mitchison T. Cancer Res. 2008;68:3269–3276. doi: 10.1158/0008-5472.CAN-07-6699. [DOI] [PubMed] [Google Scholar]
- 23.Mullins JM, Snyder JA. Chromosoma. 1981;83:493–505. doi: 10.1007/BF00328275. [DOI] [PubMed] [Google Scholar]
- 24.Jordan MA, Thrower D, Wilson L. J Cell Sci. 1992;102(Pt 3):401–416. doi: 10.1242/jcs.102.3.401. [DOI] [PubMed] [Google Scholar]
- 25.Rieder CL, Maiato H. Dev Cell. 2004;7:637–651. doi: 10.1016/j.devcel.2004.09.002. [DOI] [PubMed] [Google Scholar]
- 26.Green KJ, Goldman RD. Cell Motil. 1983;3:283–305. doi: 10.1002/cm.970030402. [DOI] [PubMed] [Google Scholar]
- 27.Skoufias DA, DeBonis S, Saoudi Y, Lebeau L, Crevel I, Cross R, Wade RH, Hackney D, Kozielski F. J Biol Chem. 2006;281:17559–17569. doi: 10.1074/jbc.M511735200. [DOI] [PubMed] [Google Scholar]
- 28.Rieder CL, Schultz A, Cole R, Sluder G. J Cell Biol. 1994;127:1301–1310. doi: 10.1083/jcb.127.5.1301. [DOI] [PMC free article] [PubMed] [Google Scholar]
- 29.Yang Z, Kenny AE, Brito DA, Rieder CL. J Cell Biol. 2009;186:675–684. doi: 10.1083/jcb.200906150. [DOI] [PMC free article] [PubMed] [Google Scholar]
- 30.Orth JD, Tang Y, Shi J, Loy CT, Amendt C, Wilm C, Zenke FT, Mitchison TJ. Mol Cancer Ther. 2008;7:3480–3489. doi: 10.1158/1535-7163.MCT-08-0684. [DOI] [PMC free article] [PubMed] [Google Scholar]
- 31.Gascoigne KE, Taylor SS. Cancer Cell. 2008;14:111–122. doi: 10.1016/j.ccr.2008.07.002. [DOI] [PubMed] [Google Scholar]
- 32.Watson P. Drug News Perspect. 2009;22:69–79. doi: 10.1358/dnp.2009.22.2.1334450. [DOI] [PubMed] [Google Scholar]
- 33.Price JH, Goodacre A, Hahn K, Hodgson L, Hunter EA, Krajewski S, Murphy RF, Rabinovich A, Reed JC, Heynen S. J Cell Biochem Suppl. 2002;39:194–210. doi: 10.1002/jcb.10448. [DOI] [PubMed] [Google Scholar]
- 34.Orford KW, Scadden DT. Nat Rev Genet. 2008;9:115–128. doi: 10.1038/nrg2269. [DOI] [PubMed] [Google Scholar]
- 35.Ellison D, Munden A, Levchenko A. Mol Biosyst. 2009;5:1004–1012. doi: 10.1039/b905602e. [DOI] [PMC free article] [PubMed] [Google Scholar]
- 36.Faley SL, Copland M, Wlodkowic D, Kolch W, Seale KT, Wikswo JP, Cooper JM. Lab Chip. 2009;9:2659–2664. doi: 10.1039/b902083g. [DOI] [PubMed] [Google Scholar]
- 37.Moffat J, Grueneberg DA, Yang X, Kim SY, Kloepfer AM, Hinkle G, Piqani B, Eisenhaure TM, Luo B, Grenier JK, Carpenter AE, Foo SY, Stewart SA, Stockwell BR, Hacohen N, Hahn WC, Lander ES, Sabatini DM, Root DE. Cell. 2006;124:1283–1298. doi: 10.1016/j.cell.2006.01.040. [DOI] [PubMed] [Google Scholar]
- 38.Neumann B, Held M, Liebel U, Erfle H, Rogers P, Pepperkok R, Ellenberg J. Nat Methods. 2006;3:385–390. doi: 10.1038/nmeth876. [DOI] [PubMed] [Google Scholar]
- 39.Jones TR, Carpenter AE, Lamprecht MR, Moffat J, Silver SJ, Grenier JK, Castoreno AB, Eggert US, Root DE, Golland P, Sabatini DM. Proc Natl Acad Sci U S A. 2009;106:1826–1831. doi: 10.1073/pnas.0808843106. [DOI] [PMC free article] [PubMed] [Google Scholar]
- 40.Burdon T, Smith A, Savatier P. Trends Cell Biol. 2002;12:432–438. doi: 10.1016/s0962-8924(02)02352-8. [DOI] [PubMed] [Google Scholar]
- 41.Fluckiger AC, Marcy G, Marchand M, Negre D, Cosset FL, Mitalipov S, Wolf D, Savatier P, Dehay C. Stem Cells. 2006;24:547–556. doi: 10.1634/stemcells.2005-0194. [DOI] [PMC free article] [PubMed] [Google Scholar]
- 42.Savatier P, Huang S, Szekely L, Wiman KG, Samarut J. Oncogene. 1994;9:809–818. [PubMed] [Google Scholar]
- 43.Stead E, White J, Faast R, Conn S, Goldstone S, Rathjen J, Dhingra U, Rathjen P, Walker D, Dalton S. Oncogene. 2002;21:8320–8333. doi: 10.1038/sj.onc.1206015. [DOI] [PubMed] [Google Scholar]
- 44.White J, Stead E, Faast R, Conn S, Cartwright P, Dalton S. Mol Biol Cell. 2005;16:2018–2027. doi: 10.1091/mbc.E04-12-1056. [DOI] [PMC free article] [PubMed] [Google Scholar]
- 45.Jirmanova L, Afanassieff M, Gobert-Gosse S, Markossian S, Savatier P. Oncogene. 2002;21:5515–5528. doi: 10.1038/sj.onc.1205728. [DOI] [PubMed] [Google Scholar]
- 46.Becker KA, Stein JL, Lian JB, van Wijnen AJ, Stein GS. J Cell Physiol. 2009 [Google Scholar]
- 47.Peerani R, Rao BM, Bauwens C, Yin T, Wood GA, Nagy A, Kumacheva E, Zandstra PW. EMBO J. 2007;26:4744–4755. doi: 10.1038/sj.emboj.7601896. [DOI] [PMC free article] [PubMed] [Google Scholar]
- 48.Hoffmann M, Chang HH, Huang S, Ingber DE, Loeffler M, Galle J. PLoS One. 2008;3:e2922. doi: 10.1371/journal.pone.0002922. [DOI] [PMC free article] [PubMed] [Google Scholar]
- 49.Desai SP, Freeman DM, Voldman J. Lab Chip. 2009;9:1631–1637. doi: 10.1039/b822081f. [DOI] [PubMed] [Google Scholar]
- 50.Harder N, Mora-Bermudez F, Godinez WJ, Wunsche A, Eils R, Ellenberg J, Rohr K. Genome Res. 2009 doi: 10.1101/gr.092494.109. [DOI] [PMC free article] [PubMed] [Google Scholar]
- 51.Mayer TU, Kapoor TM, Haggarty SJ, King RW, Schreiber SL, Mitchison TJ. Science. 1999;286:971–974. doi: 10.1126/science.286.5441.971. [DOI] [PubMed] [Google Scholar]
- 52.Mukherji M, Bell R, Supekova L, Wang Y, Orth AP, Batalov S, Miraglia L, Huesken D, Lange J, Martin C, Sahasrabudhe S, Reinhardt M, Natt F, Hall J, Mickanin C, Labow M, Chanda SK, Cho CY, Schultz PG. Proc Natl Acad Sci U S A. 2006;103:14819–14824. doi: 10.1073/pnas.0604320103. [DOI] [PMC free article] [PubMed] [Google Scholar]
- 53.Xu Y, Shi Y, Ding S. Nature. 2008;453:338–344. doi: 10.1038/nature07042. [DOI] [PubMed] [Google Scholar]
- 54.McDonald JC, Duffy DC, Anderson JR, Chiu DT, Wu H, Schueller OJ, Whitesides GM. Electrophoresis. 2000;21:27–40. doi: 10.1002/(SICI)1522-2683(20000101)21:1<27::AID-ELPS27>3.0.CO;2-C. [DOI] [PubMed] [Google Scholar]
- 55.Carpenter AE, Jones TR, Lamprecht MR, Clarke C, Kang IH, Friman O, Guertin DA, Chang JH, Lindquist RA, Moffat J, Golland P, Sabatini DM. Genome Biol. 2006;7:R100. doi: 10.1186/gb-2006-7-10-r100. [DOI] [PMC free article] [PubMed] [Google Scholar]
Associated Data
This section collects any data citations, data availability statements, or supplementary materials included in this article.