

Abstract
BACKGROUND
MicroRNAs (miRNAs) are RNA molecules that are involved in the regulation of many cellular processes, including those related to human cancers. The aim of this study was to determine, as a proof of principle, whether specific candidate miRNAs could be detected in fine-needle aspirate (FNA) biopsies of pancreatic ductal adenocarcinoma (PDAC) and could accurately differentiate malignant from benign pancreatic tissues.
METHODS
We used TaqMan® assays to quantify miRNA levels in FNA samples collected in RNARetain (n = 16) and compared the results with a training set consisting of frozen macrodissected pancreatic samples (n = 20).
RESULTS
Quantitative reverse-transcription PCR analysis confirmed that miRNA levels are affected in PDAC FNAs and correlate well with the changes observed in the training set of frozen pancreatic samples. Analysis of the amounts produced for a few specific miRNAs enabled identification of PDAC samples. The combination of miR-196a and miR-217 biomarkers further improved the ability to distinguish between healthy tissue, PDAC, and chronic pancreatitis in the training set (P = 8.2 × 10⁻¹⁰), as well as segregate PDAC FNA samples from other FNA samples (P = 1.1 × 10⁻⁵). Furthermore, we showed that miR-196a production is likely specific to PDAC cells and that its incidence paralleled the progression of PDAC.
CONCLUSIONS
To the best of our knowledge, this study is the first to evaluate the diagnostic potential of miRNAs in a clinical setting and has shown that miRNA analysis of pancreatic FNA biopsy samples can aid in the pathologic evaluation of suspicious cases and may provide a new strategy for improving the diagnosis of pancreatic diseases.
Pancreatic cancer is the fourth-leading cause of cancer-related deaths in the US, with a 5-year survival rate of <5%. Approximately 37 000 new cases and 33 000 pancreatic cancer–related deaths will have occurred in the US in 2007 (1). Eighty-five percent of pancreatic tumors originate from the epithelium lining of the pancreatic duct [pancreatic ductal adenocarcinomas (PDACs)7] (2). Routine imaging techniques alone, such as computed tomography or MRI, can neither detect PDAC at early stages nor differentiate between benign and malignant lesions. In fact, van Gulik et al. reported that up to 6% of the cases suspected of being malignant were found to be benign at surgery, which was associated with a postsurgical complication rate of up to 21% for these cases (3). Recently, endoscopic ultrasound-guided fine-needle aspiration (EUS-FNA) has emerged as a very specific and minimally invasive modality for preoperative diagnosis and staging of pancreatic cancer (4–8). When performed by experienced endosonographers, the EUS-FNA procedure exhibits complication rates of < 1.6% (9).
Because of their invasive nature, FNAs of the pancreas are not likely to be used routinely for early detection or screening for PDAC. By contrast, these procedures may have benefits in screening high-risk individuals, as well as for the prognosis and predicting the response to treatment in the numerous cases in which the tumor is inoperable. The concentrations of the mRNA biomarkers for human equilibrative nucleoside transporter 1 (hENT1) and deoxycytidine kinase, which participate in the metabolism of gemcitabine, were correlated with the outcomes of patients with pancreatic cancer (10). The EUS-FNA sampling method has also been shown to provide enough material of sufficient quality to carry out biomarker-discovery studies (11). The presence of molecular biomarkers in EUS-FNA samples is quantifiable and can be standardized. For example, increased concentrations of the proteins encoded by MUC48 (mucin 4, cell surface associated), BIRC5 (baculoviral IAP repeat-containing 5; survivin), and PLAUR (also known as UPAR) (plasminogen activator, urokinase receptor) have been linked to the progression of pancreatic cancer (7, 12–14), and the expression signatures of these genes along with those of 6 other genes were able to segregate PDAC from chronic pancreatitis (5). High expression of the CEACAM6 gene [carcinoembryonic antigen-related cell adhesion molecule 6 (non-specific cross-reacting antigen)] was observed in more than 90% of PDAC samples and was correlated with lymph node–positive disease and extrapancreatic spread of the carcinoma (14, 15). Despite several advances in our basic understanding and clinical management of pancreatic cancer, there is currently a lack of effective biomarker-based strategies useful for the early detection of pancreatic cancer or for differentiating between PDAC and benign disease, such as chronic pancreatitis.
Changes in the production of mature microRNAs (miRNAs), which are small regulatory biomolecules of 19–23 nucleotides, have also been linked to pancreatic cancer. Deregulation of the production of as few as 2 miRNAs (i.e., miR-196a and miR-217) was shown to distinguish PDAC samples from healthy pancreatic tissue and chronic pancreatitis (16). In a later study, increases in miR-196a were determined to predict poor survival of patients with PDAC (17). In this study, we evaluated the utility of miRNA-production profiles in FNA samples to reliably identify the disease status of pancreatic tissue and to distinguish between benign and malignant pancreatic tissues.
Materials and Methods
SAMPLE COLLECTION
This study was approved by the Dartmouth Committee for the Protection of Human Subjects and the Norris Cotton Cancer Center Research Committee. All patients signed an informed-consent form before FNA was performed. Fourteen patients (Table 1) with suspected pancreatic masses underwent EUS-FNA with either a 22- or 25-gauge needle designed for standard cytologic examination; 2–3 additional aspirations were made from each mass and collected in RNARetain™ Preanalytical RNA Stabilization Solution (Asuragen). The cytopathologist assessed the adequacy of these samples with standard techniques at the time of the biopsy. The samples were kept at room temperature for 20–30 min and then stored frozen at −80 °C. With a primary goal of evaluating the rate at which miRNAs can be obtained from tumor tissue, the 14 cases would be sufficient for detecting a failure rate of 20% or greater. We expected the success rate to be very high (100%) and therefore expected no experimental failures. With no observed failures from the 14 samples, we were able to statistically rule out a failure rate of ≥20% (P = 0.04).
Table 1.
Patient and tumor characteristics.
| Sample type | ID | Sex | Age, years | Diagnosis | Comment |
|---|---|---|---|---|---|
| Pancreatic cancer FNA | FNA-1 | Female | 74 | PDAC | MXa |
| FNA-2 | Female | 72 | PDAC | MX | |
| FNA-3 | Female | 72 | PDAC | MX | |
| FNA-4 | Female | 65 | PDAC | MX, extensive necrosis | |
| FNA-5 | Female | 68 | PDAC | M1 | |
| FNA-6 | Female | 84 | PDAC | M0 | |
| FNA-7 | Male | 84 | PDAC | MX | |
| FNA-9 | Male | 72 | PDAC | M1 | |
| FNA-11 | Female | 57 | PDAC | M1 | |
| FNA-14 | Female | 85 | PDAC | MX, extensive necrosis | |
| Other FNA | FNA-8 | Female | 59 | Suspected PDAC | M0 |
| FNA-12 | Female | 46 | Neoplasm of endocrine pancreas | M1 | |
| FNA-13 | Male | 59 | Atypical | MX | |
| Nonpathologic FNA | FNA-15 | Male | 76 | Healthy pancreas |
MX, metastasis status unknown; M1, known metastasis; M0, no metastasis.
RNA ISOLATION
Total RNA from the FNA samples collected in RNARetain was isolated with the mirVana™ miRNA Isolation Kit (Ambion/Applied Biosystems) according to the manufacturer’s protocol and with modifications to maximize RNA recovery from the small amounts of tissue. In brief, we thawed samples on ice and pelleted the resulting cell suspensions at 370gfor 5 min at 4 °C. We removed the RNARetain supernatant and incubated the FNAs on ice in 1.2 mL of Lysis/Binding Buffer (Ambion/Applied Biosystems) for 20 min with occasional mixing. The extraction of RNA from lysed tissues and the remaining steps followed the manufacturer’s protocol.
We used the RNAqueous®-Micro Kit (Ambion/Applied Biosystems) to prepare total RNA from approximately 1 000 microdissected cells of each cell type [nonpathologic ducts, acinar cells, and pancreatic intraepithelial neoplasia 1b (PanIN-1b), PanIN-2, and PanIn-3 lesions]. We performed microdissection from step sections of individual lesions and cases as previously described (18).
We measured the concentration and purity of total-RNA samples with the NanoDrop 1000 spectrophotometer (NanoDrop Technologies/Thermo Scientific) and assessed RNA integrity with the Agilent 2100 Bioanalyzer and the RNA 6000 LabChip Kit (Agilent Technologies).
miRNA ANALYSES
We used TaqMan® miRNA Assays (Applied Biosystems) to quantify miRNA as follows: We added 10 ng total RNA, carried out reverse transcription in duplicate (16 °C for 30 min, 42 °C for 30 min, 85 °C for 5 min, and then to 4 °C), and then conducted PCRs in duplicate from each reverse-transcription reaction (95 °C for 1 min and 40 cycles of 95 °C for 15 s and 60 °C for 30 s). All PCR amplifications were performed on a 7900HT Fast Real-Time PCR System with the 7900HT Fast System SDS Software (version 2.3; Applied Biosystems). We carried out quantitative analyses of individual miRNAs, as well as their combinations, by normalizing raw quantified values to those of the miR-24 miRNA to generate relative miRNA abundance values.
For every TaqMan miRNA assay used in this study, we built 7-point calibration curves with chemically synthesized oligonucleotides (5–50 × 106 copies) spiked into a background of 5 ng yeast tRNA, and 2 operators performed the assays in triplicate (n = 6). We used synthetic oligonucleotides and various input concentrations of RNA from PDAC and non-PDAC samples to further evaluate the miR-196a and miR-217 assays for analytical sensitivity (n = 10), analytical specificity (n = 24), and reproducibility between runs with a single operator (n = 20), between operators on a single instrument (n = 20), and between reagent lots (n = 20).
End-point reverse-transcription PCRs (RT-PCRs) for miR-196a were performed with 5 ng of total RNA with SuperTaq Polymerase and the mirVana qRT-PCR miRNA Detection Kit and Primer Sets (Ambion/Applied Biosystems) according to the manufacturer’s instructions. PCR amplifications (95 °C for 3 min and 35 cycles of 95 °C for 15 s, 60 °C for 30 s, and 78.5 °C for 5 s) were performed on an MJ Research Opticon 2 thermocycler PCR system (Biozym) in a 25-μL reaction containing 4.8 μL cDNA. PCR products were analyzed on a standard 15 g/L agarose gel.
Results
FNA COLLECTION AND RNA ISOLATION
Pancreatic tissue samples (n = 16) were obtained by FNA biopsy from 14 patients. Ten patients had diagnosed PDAC, and one each had carcinoma of endocrine pancreas, “suspected” PDAC, and pancreatic tissue with “atypical” features (see Table 1). The non-pathologic sample from the control individual was sampled in triplicate from 3 different parts of the pancreas (head, body, and tail) after pancreatectomy. Because pancreatic tissues contain high concentrations of nucleases, all FNA samples were immediately collected and stored in RNARetain. The average yield of RNA recovered from triple-pass FNA samples was 4.9 μg. The RNA purity was high, as demonstrated by a mean 260 nm/280 nm absorbance ratio of 1.82. Eleven of 16 samples had distinct 18S and 28S rRNA electrophoresis bands, which are characteristic of intact RNA. Although the Agilent electropherograms for the remaining 5 FNA samples lacked distinguishable 18S and 28S peaks, we concluded that the overall yield and quality of the RNA extracted from pancreatic FNA samples was sufficient to carry out quantitative RT-PCR (qRT-PCR) expression profiling.
QUANTITATIVE ANALYSIS OF miRNAs IN FROZEN PANCREATIC TISSUES AND RNARetain-PRESERVED FNAs
We had previously used microarray expression profiling and real-time SYBR Green RT-PCR to characterize deregulation of miRNA production in frozen PDAC samples (16). In this study, we selected a panel of 12 miRNAs and interrogated their production with TaqMan miRNA Assays validated in house and a training set consisting of frozen samples from 6 nonpathologic pancreas, 6 patients with chronic pancreatitis, and 8 PDAC patients. As illustrated in Fig. 1 (right panels), the production levels for miR-148a, miR-196a, miR-217, and miR-375 normalized to the level of the miR-24 internal control were characteristic of the patients’ corresponding disease states. The mean fold changes (2ΔCt) and P values indicated clear segregation of healthy, chronic pancreatitis, and PDAC samples (Table 2). An analysis of 8 additional miRNAs further confirmed the differential production of miR-96, miR-130b, miR-155, and miR-210 for PDAC vs nonneoplastic samples and miR-143 and miR-145 for healthy vs disease tissue. miR-31 and miR-205 showed a broad range of production levels (Table 2).
Fig. 1. Relative expression of miR-148a, miR-196a, miR-217, and miR-375 in the frozen and FNA sets of pancreatic tissues.
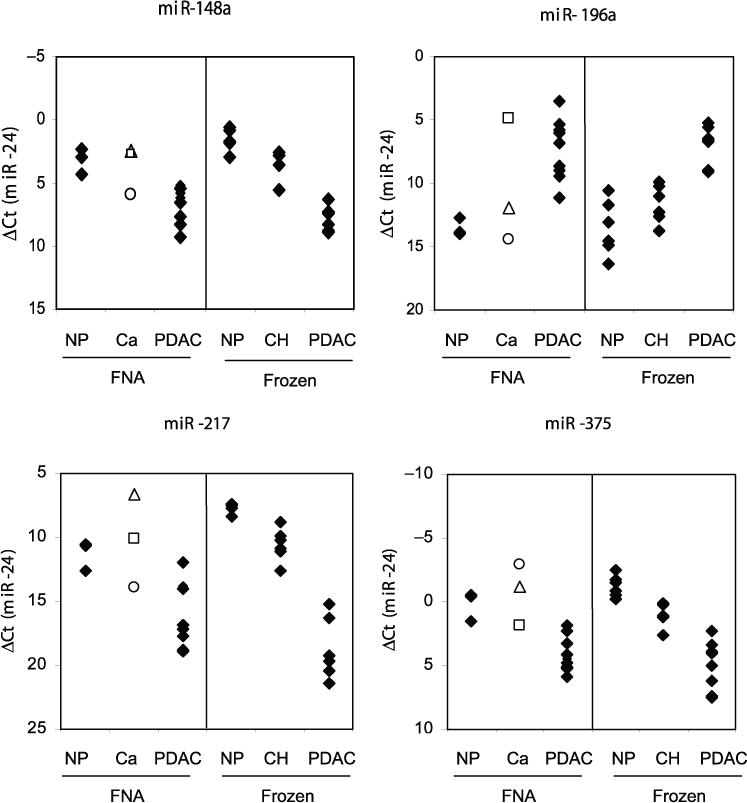
The indicated miRNA targets were interrogated by real-time qRT-PCR in nonneoplastic (NP) (n = 3), PDAC (n = 10), and other (Ca) (n = 3) pancreatic FNAs preserved in RNARetain (left panels), and in NP (n = 6), chronic pancreatitis (CH) (n = 6), and PDAC (n = 8) frozen tissue samples (right panels). The Ct values for individual miRNA biomarkers were normalized to those of miR-24. □, FNA-8 (suspected pancreatic adenocarcinoma); Δ, FNA-13 (atypical); ○, FNA-12 (neoplasia of endocrine pancreas).
Table 2.
Mean production of miRNA targets normalized to miR-24 production, their differential production, and associated P values for the set of frozen tissues.
| Target |
P (ANOVA) |
Mean, ΔCta |
P (CH – NP) |
ΔΔCtc (CH – NP) |
P (CH – PDAC) |
ΔΔCtc (CH – PDAC) |
P (NP – PDAC) |
ΔΔCtc (NP – PDAC) |
||
|---|---|---|---|---|---|---|---|---|---|---|
| CHb | NP | PDAC | ||||||||
| miR-196a | 3.51 × 10⁻⁶ | 11.61 | 13.51 | 6.92 | 6.79 × 10⁻² | −1.90 | 8.00 × 10⁻⁵ | 4.69 | 1.39 × 10⁻⁶ | 6.59 |
| miR-217 | 1.30 × 10⁻⁹ | 10.59 | 7.67 | 18.48 | 5.93 × 10⁻³ | 2.92 | 6.33 × 10⁻⁸ | −7.89 | 5.85 × 10⁻¹⁰ | −10.81 |
| miR-148a | 2.58 × 10⁻⁹ | 3.47 | 1.59 | 7.75 | 3.20 × 10⁻³ | 1.88 | 2.01 × 10⁻⁷ | −4.28 | 9.79 × 10⁻¹⁰ | −6.15 |
| miR-130b | 2.65 × 10⁻⁷ | 7.31 | 5.90 | 9.76 | 7.13 × 10⁻³ | 1.41 | 2.78 × 10⁻⁵ | −2.45 | 7.85 × 10⁻⁸ | −3.86 |
| miR-375 | 8.88 × 10⁻⁷ | 0.91 | −1.24 | 4.95 | 1.69 × 10⁻² | 2.15 | 5.62 × 10⁻⁵ | −4.05 | 2.81 × 10⁻⁷ | −6.20 |
| miR-210 | 3.54 × 10⁻⁴ | 7.53 | 7.38 | 5.08 | 8.06 × 10⁻¹ | 0.15 | 3.42 × 10⁻⁴ | 2.45 | 6.08 × 10⁻⁴ | 2.31 |
| miR-155 | 8.48 × 10⁻⁴ | 3.96 | 5.19 | 2.16 | 9.83 × 10⁻² | −1.22 | 1.37 × 10⁻² | 1.80 | 2.45 × 10⁻⁴ | 3.02 |
| miR-143 | 1.42 × 10⁻² | 8.78 | 10.20 | 8.84 | 1.04 × 10⁻² | −1.43 | 8.92 × 10⁻¹ | −0.06 | 9.12 × 10⁻³ | 1.36 |
| miR-145 | 2.11 × 10⁻² | 6.98 | 8.39 | 6.83 | 2.36 × 10⁻² | −1.41 | 7.90 × 10⁻¹ | 0.14 | 9.37 × 10⁻³ | 1.56 |
| miR-223 | 2.73 × 10⁻³ | 1.40 | 2.59 | 0.37 | 5.48 × 10⁻² | −1.19 | 7.18 × 10⁻² | 1.03 | 7.08 × 10⁻⁴ | 2.22 |
| miR-96 | 1.72 × 10⁻⁴ | 13.77 | 11.12 | 15.47 | 6.14 × 10⁻³ | 2.65 | 4.69 × 10⁻² | −1.70 | 4.02 × 10⁻⁵ | −4.35 |
| miR-31 | 6.04 × 10⁻² | 5.01 | 6.52 | 4.04 | 1.62 × 10⁻¹ | −1.51 | 3.26 × 10⁻¹ | 0.97 | 1.96 × 10⁻² | 2.48 |
| miR-205 | 3.05 × 10⁻¹ | 16.29 | 14.65 | 12.96 | 4.75 × 10⁻¹ | 1.64 | 1.30 × 10⁻¹ | 3.34 | 4.29 × 10⁻¹ | 1.70 |
Data are ΔCt values (normalized to miR-24 Ct values).
CH, chronic pancreatitis; NP, nonneoplastic.
Difference in ΔCt values (ΔΔCt) between the indicated experimental groups.
We next interrogated the 16 pancreatic FNA samples for the same set of miRNA targets. We determined that miRNAs identified as differentially produced in the training set were also deregulated in the PDAC FNA samples (Fig. 1). The mean production levels of the 12 miRNAs in the PDAC FNA set were highly similar to those of the training set (paired Pearson correlation coefficient, 0.97). Interestingly, the FNA sample from the patient with the diagnosis of “neoplasm of endocrine pancreas” did not exhibit miRNA-production patterns characteristic of PDAC. In contrast, the production levels of particular miRNAs, such as miR-196a and miR-375, in the FNA sample suspicious for adenocarcinoma were indicative of pancreatic cancer.
We also noted that miR-196a was detected above the background level only in samples diagnosed as PDAC. Because a healthy pancreas consists mainly of acinar cells, which could mask the low-level production of miR-196a in healthy nonneoplastic ductal cells, we next assessed miR-196a production in fresh frozen microdissected samples. We performed end-point RT-PCR followed by gel analysis to rule out any nonspecific background signal (Fig. 2). No bands specific for miR-196a were observed in 5 independent preparations of nonpathologic ductal cells, in 5 independent preparations of acinar cells, or in 4 hyperplastic PanIN lesions (PanIN-1b). In contrast, 11 of 11 PDAC samples, 1 of 4 PanIN-2 samples, and 3 of 5 PanIN-3 samples were positive for miR-196a. Thus, miR-196a production is likely specific for PDAC cells, and its incidence seems to parallel PDAC progression.
Fig. 2. Analysis of miR-196a production in microdissected tissue samples.
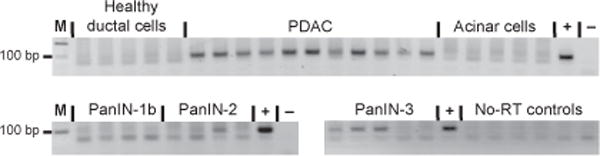
End-point RT-PCRs were performed with total RNA isolated from healthy ductal, PDAC, acinar, PanIN-1b, PanIN-2, and PanIN-3 microdissected cells. Only representative reactions without reverse transcriptase (No-RT) are shown. M, molecular size marker; +, positive control; −, no-template negative control.
AN miRNA SIGNATURE FOR CLASSIFYING PDAC SAMPLES
To identify the best single marker or combination of markers for PDAC classification, we used miRNA delta threshold cycle (ΔCt) values normalized to miR-24 to develop a multiclass classifier. To select features that are highly correlated with the class labels (PDAC vs non-PDAC), the feature-selection algorithm combined a genetic-algorithm search method with a correlation-based subset evaluator. Optimization of the feature selection with the training set yielded a 5-miRNA classifier (miR-130b, miR-148a, miR-196a, miR-210, and miR-217) and a 2-miRNA classifier (miR-196a and miR-217) with similar performances. The second classifier has the advantage that it is a difference between 2 features and therefore does not require the inclusion of a normalizer [miR-196a ΔCt – miR-217 ΔCt = (miR-196a Ct – miR-24 Ct) – (miR-217 Ct – miR-24 Ct) = miR-196a Ct – miR-217 Ct]. Subtraction of raw miR-196a and miR-217 Ct values perfectly segregated the 8 PDAC samples from the 12 nonneoplastic tissues, including 6 chronic pancreatitis cases (P = 8.18 × 10⁻¹⁰, 3-way ANOVA; Fig. 3). For the training set, the P value for the comparison of PDAC vs non-PDAC samples was 4.3 × 10⁻⁹, and the spread between the highest PDAC index value (−6.24) and the lowest non-PDAC index value (−2.34) was approximately 4 Ct.
Fig. 3. Multiclass classifiers for pancreatic diseases.
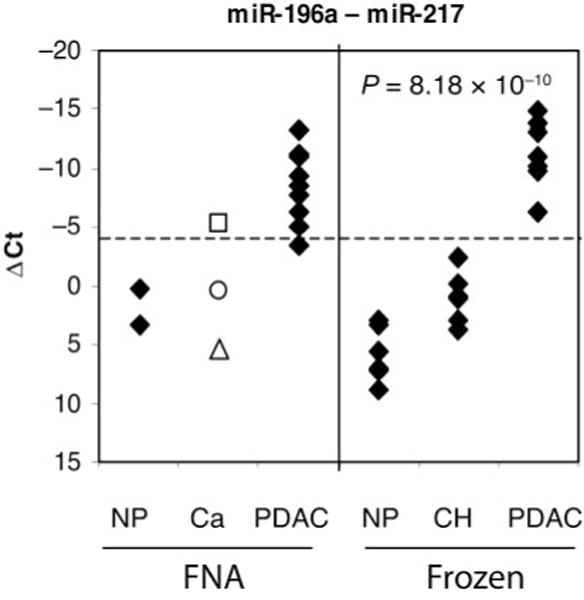
The graph shows the difference between miR-196a and miR-217 production levels (miR-196a Ct – miR-217 Ct). The dotted line represents the cutoff index value (−4) separating PDAC and nonneoplastic (NP) samples, as determined with the training set of frozen tissues. The indicated P value is for a 3-way ANOVA of the training set of frozen tissues. Also indicated are data for other samples (Ca): □, FNA-8 (suspected pancreatic adenocarcinoma); Δ, FNA-13 (atypical); ○, FNA-12 (neoplasia of endocrine pancreas).
When we used a cutoff index value of – 4 in applying the same classifier to the FNA set, we correctly identified 9 of 10 FNAs as being from PDAC samples (Fig. 3, left panel). Interestingly, the FNA-8 sample, which was from a patient suspected of having adenocarcinoma, was clearly identified as PDAC (index value of −5.2), whereas the FNAs from atypical pancreas and neoplasm of endocrine pancreas were not. For this sample set, the assay sensitivity was 90% (95% confidence interval, 62%–98%) with 100% specificity (95% confidence interval, 56%–100%), and the difference between PDAC (including FNA-8) samples and non-PDAC samples obtained with this assay was highly significant (P = 1.1 × 10⁻⁵).
To further evaluate our optimal miRNA classifier, we used chemically synthesized oligonucleotides spiked into a background of 5 ng yeast tRNA to test the individual TaqMan assays for analytical sensitivity, precision, and linearity. Both assays had a 7-log dynamic range with a limit of detection of 5–10 copies per reverse-transcription reaction (Fig. 4A). The reproducibilities between runs with a single operator, between operators on a single instrument, and between different reagent lots were high with all SDs <0.5 Ct (data not shown). Linearity was also good with all r2 values >0.99 and all slopes of the fitted lines between −3.22 and −3.4. Finally, a titration experiment with total RNA from a pancreatic FNA sample showed that the assay was accurate between 5 ng and 50 ng of added RNA (Fig. 4B). We concluded that the measurement of miR-196a and miR-217 production levels with TaqMan miRNA assays is a robust method and can be performed with pancreatic FNA samples. Analysis of the difference in production of the 2 miRNAs can be used to track the proliferation of ductal adenocarcinoma cells relative to acinar cells and warrants further evaluation with a larger set of FNAs and archived clinical samples.
Fig. 4. Performance of the miRNA classifier assay.
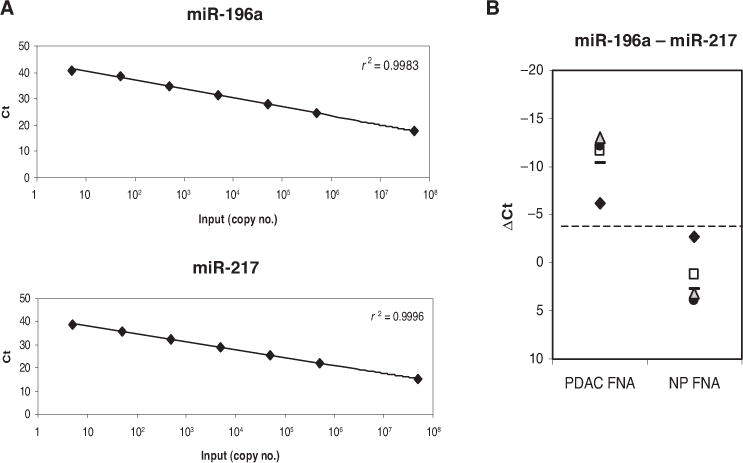
(A), Calibration curves for both TaqMan miRNA assays were built by spiking in the indicated copy number of chemically synthesized oligonucleotides in the reverse transcription reaction. Each dilution point represents 80 replicates. (B), TaqMan assays were performed with 1, 5, 10, 25, and 50 ng total RNA from 2 FNA samples: 1 nonneoplastic (NP) and 1 PDAC. The dotted line represents the cutoff index value (−4) separating PDAC and NP samples, as in Fig. 3. The difference between production of miR-196a and miR-217 was similar for total-RNA inputs from 5–50 ng: ◆, 1–5 ng; □, 10 ng; ●, 25 ng;
 , 50 ng.
Discussion
Successful management and treatment of PDAC remains one of the key challenges in clinical oncology. Although early-stage pancreatic carcinoma can be treated surgically, most cases present at an advanced stage, when surgical resection is not possible because of vascular dissemination of tumor and its spread to regional lymph nodes. In addition, the differential diagnosis of pancreatic carcinoma and pseudotumoral masses caused by chronic pancreatitis is often difficult because of their similar imaging features and clinical presentations. Several protein and nucleic acid markers identified in blood have been shown to have diagnostic potential, but they lack specificity and sensitivity (19–24).
In this study, we examined the feasibility of the use of real-time RT-PCR to detect miRNA markers in FNA biopsies of pancreatic tissue. Because pancreatic tissues contain high concentrations of ribonucleases, we took special steps to ensure immediate transfer of FNA samples into a vial containing RNARetain. This reagent rapidly permeates excised tissue, inactivating nucleases and thereby stabilizing and protecting RNA. We have shown that total RNA is efficiently extracted from FNA samples preserved in RNARetain, with an average yield of 4.9 μg for triple-passage FNA. This yield is comparable to yields described in previous reports for fresh FNAs that were stored in RNAlater® Solution (Ambion/Applied Biosystems) (25). The stability of RNA is known to be low in environments rich in ribonucleases [e.g., blood; 99% of added free RNA was degraded within 15 s (26)]. Similar rates of RNA degradation have been reported for FNA samples of breast (15%) and lung (50%) tissues (27–29). Although RNA degradation can decrease the ability to detect mRNA (30), miRNAs are more robust and therefore superior analytes to mRNAs. Their production can be measured reliably in compromised clinical samples, such as formalin-fixed paraffin-embedded tissue samples, including pancreas samples (16, 17, 31, 32).
We previously identified miRNAs that showed changes in production that were indicative of pancreatic cancer (16). In this study, we set out to determine whether deregulation of these miRNAs can be used to identify malignancy in pancreatic FNAs preserved in RNARetain. As a first step, we used TaqMan qRT-PCR assays to compare the production levels of selected miRNAs in a subset of 20 previously studied frozen tissue samples and 16 pancreatic FNA biopsies. We found that the differential patterns of miRNA production in the frozen tissue samples correlated well with our previously reported results. In addition, the differences in miRNA production between the nonpathologic and cancer FNA samples were nearly identical to those between the corresponding frozen pancreas samples (Fig. 1). Further data analysis revealed that the difference between miR-196a and miR-217 in raw Ct values clearly separated malignant and benign tissues for both the frozen and FNA sets of samples. This finding suggests that the quality and amounts of cells sampled with EUS-FNA are sufficient for successful qRT-PCR analysis of pancreatic tissues. It also confirms that the observed differences in miRNA production are specific to the disease state of the tissue and are independent of the method of tissue preservation (i.e., frozen vs RNARetain). qRT-PCR analysis of these 2 miRNAs (miR-196a and miR-217) could be used in clinical practice as an ancillary method to improve the diagnostic potential of the FNA procedure (33–35). In addition, a combination of these diagnostic procedures could improve the negative predictive value of pancreatic FNAs.
Interestingly, the patterns of miR-196a and miR-217 production are diametrically opposed: The concentration of miR-217 is high only in healthy pancreatic tissues, and miR-196a is detected above the background level only in PDAC samples. Because healthy pancreas consists of approximately 90% acinar cells, this observation suggests that miR-217 is produced primarily in acinar cells. In contrast to miR-217, we have demonstrated that miR-196a is produced only in ductal adenocarcinoma cells and not in healthy acinar or ductal cells (Fig. 2). Thus, our miRNA classifier consisting of an acinar cell–specific marker (miR-217) and a PDAC-specific marker (miR-196a) may in fact measure proliferation of ductal adenocarcinoma cells relative to the decline in acinar cells, a change that may also be accompanied by an increase in desmoplastic tissue. In addition, the cell specificity of miR-196a together with the observation of its high concentration in various PDAC cell lines (16) suggests that this miRNA may be an excellent target candidate for the development of PDAC therapeutics. In the future, it will be important to understand what cellular pathways are affected by blocking the production of miR-196a in ductal cells.
Another important finding of our end-point RT-PCR analysis of microdissected pancreatic tissues is the lack of miR-196a production in PanIN-1b lesions, which are likely to have a low propensity for progressing into PDAC. In contrast, 60% of PanIN-3 lesions, which are regarded both genetically and clinically as high-risk early lesions (36), were positive for miR-196a. The incidence of miR-196a production dropped to 25% in PanIN-2 lesions, the intermediate type of pancreatic early lesions. Our data indicate that positivity for miR-196a production in an FNA is expected to correlate with either a frank carcinoma or a clinically important advanced high- or intermediate-risk early lesion. Most mRNA biomarker data published thus far do not offer such a sharp distinction between healthy tissue or benign precursor lesions and carcinoma. We had also interrogated our training and FNA sets for specific mRNA biomarkers encoded by the CEACAM6, BIRC5, MUC4, and PLAUR genes (5, 14, 15, 37–40). Although comparison of the mean concentrations of mRNAs encoded by CEACAM6, BIRC5, MUC4, and PLAUR for frozen samples of normal, chronic pancreatitis, and PDAC tissues demonstrated a general up-regulation of these genes in PDAC, an analysis of these genes’ expression in individual samples revealed no clear segregation of these experimental groups for either the frozen or FNA sets (data not shown). This observation indicates the superior specificity of miRNA biomarkers and suggests that longer mRNA species, which are more sensitive to RNA degradation, may not be as robust as miRNAs for diagnostic procedures with such challenging clinical samples as FNAs or formalin-fixed paraffin-embedded tissue blocks.
For the 3 non-PDAC FNA samples analyzed in this study, the individual patterns of miRNA production depended on the interrogated marker. Combining miR-196a with miR-217 allowed us to confirm that the FNA-8 sample, which was suspected to be from a carcinoma, was in fact a PDAC sample (Fig. 3). The pattern of miRNA production generated for FNA-13, which was from a case initially diagnosed as “atypical,” indicated a disease status intermediate between chronic pancreatitis and a healthy pancreas. We also observed that FNA-12, from the carcinoma of endocrine pancreas, could be easily distinguished from a PDAC sample with the difference in production of miR-196a and miR-217 (miR-196a Ct – miR-217 Ct) alone. These results demonstrate that profiles of miRNA production can aid in the pathologic evaluation of suspicious cases and may become a valuable asset in obtaining a definitive diagnosis of PDAC. Additional studies are needed to retrospectively analyze archived formalin-fixed paraffin-embedded samples and prospectively evaluate the utility of the use of miR-196a and miR-217 in conjunction with the EUS-FNA procedure to complement the current standard histologic and cytologic diagnosis of pancreatic diseases.
Acknowledgments
The authors thank Deepa Eveleigh and Frederik A. Fletcher for their technical evaluation of the TaqMan miRNA assay performance and Chip Cole for his help with the biostatistics to determine the adequate sample number.
Research Funding: This work was supported in part by US Public Health Service Grant CA-133715 to M. Korc.
Role of Sponsor: The funding organizations played no role in the design of study, choice of enrolled patients, review and interpretation of data, or preparation or approval of manuscript.
Footnotes
Nonstandard abbreviations: PDAC, pancreatic ductal adenocarcinoma; EUS-FNA, endoscopic ultrasound-guided fine-needle aspiration; miRNA, microRNA; PanIN, pancreatic intraepithelial neoplasia; RT-PCR, reverse-transcription PCR; qRT-PCR, quantitative RT-PCR; Ct, threshold cycle.
Human genes: MUC4, mucin 4, cell surface associated; BIRC5, baculoviral IAP repeat-containing 5; survivin; PLAUR (also known as UPAR), plasminogen activator, urokinase receptor; CEACAM6, carcinoembryonic antigen-related cell adhesion molecule 6 (non-specific cross-reacting antigen).
Author Contributions: All authors confirmed they have contributed to the intellectual content of this paper and have met the following 3 requirements: (a) significant contributions to the conception and design, acquisition of data, or analysis and interpretation of data; (b) drafting or revising the article for intellectual content; and (c) final approval of the published article.
Authors’ Disclosures of Potential Conflicts of Interest: Upon submission, all authors completed the Disclosures of Potential Conflict of Interest form. Potential conflicts of interest:
Employment or Leadership: Anna E. Szafranska, Asuragen, Inc.; Martina Doleshal, Asuragen, Inc.; Emmanuel Labourier, Asuragen, Inc.
Consultant or Advisory Role: None declared.
Stock Ownership: None declared.
Honoraria: None declared.
Expert Testimony: None declared.
References
- 1.Jemal A, Siegel R, Ward E, Murray T, Xu J, Thun MJ. Cancer statistics, 2007. CA Cancer J Clin. 2007;57:43–66. doi: 10.3322/canjclin.57.1.43. [DOI] [PubMed] [Google Scholar]
- 2.Garcea G, Neal CP, Pattenden CJ, Steward WP, Berry DP. Molecular prognostic markers in pancreatic cancer: a systematic review. Eur J Cancer. 2005;41:2213–36. doi: 10.1016/j.ejca.2005.04.044. [DOI] [PubMed] [Google Scholar]
- 3.van Gulik TM, Reeders JW, Bosma A, Moojen TM, Smits NJ, Allema JH, et al. Incidence and clinical findings of benign, inflammatory disease in patients resected for presumed pancreatic head cancer. Gastrointest Endosc. 1997;46:417–23. doi: 10.1016/s0016-5107(97)70034-8. [DOI] [PubMed] [Google Scholar]
- 4.Vilmann P, Saftoiu A. Endoscopic ultrasound-guided fine needle aspiration biopsy: equipment and technique. J Gastroenterol Hepatol. 2006;21:1646–55. doi: 10.1111/j.1440-1746.2006.04475.x. [DOI] [PubMed] [Google Scholar]
- 5.Chen Y, Zheng B, Robbins DH, Lewin DN, Mikhitarian K, Graham A, et al. Accurate discrimination of pancreatic ductal adenocarcinoma and chronic pancreatitis using multimarker expression data and samples obtained by minimally invasive fine needle aspiration. Int J Cancer. 2007;120:1511–7. doi: 10.1002/ijc.22487. [DOI] [PubMed] [Google Scholar]
- 6.Eloubeidi MA, Jhala D, Chhieng DC, Chen VK, Eltoum I, Vickers S, et al. Yield of endoscopic ultrasound-guided fine-needle aspiration biopsy in patients with suspected pancreatic carcinoma. Cancer. 2003;99:285–92. doi: 10.1002/cncr.11643. [DOI] [PubMed] [Google Scholar]
- 7.Jhala N, Jhala D, Vickers SM, Eltoum I, Batra SK, Manne U, et al. Biomarkers in diagnosis of pancreatic carcinoma in fine-needle aspirates. Am J Clin Pathol. 2006;126:572–9. doi: 10.1309/cev30be088cbdqd9. [DOI] [PubMed] [Google Scholar]
- 8.Jhala NC, Jhala D, Eltoum I, Vickers SM, Wilcox CM, Chhieng DC, Eloubeidi MA. Endoscopic ultrasound-guided fine-needle aspiration biopsy: a powerful tool to obtain samples from small lesions. Cancer. 2004;102:239–46. doi: 10.1002/cncr.20451. [DOI] [PubMed] [Google Scholar]
- 9.O’Toole D, Palazzo L, Arotc¸arena R, Dancour A, Aubert A, Hammel P, et al. Assessment of complications of EUS-guided fine-needle aspiration. Gastrointest Endosc. 2001;53:470–4. doi: 10.1067/mge.2001.112839. [DOI] [PubMed] [Google Scholar]
- 10.Nakano Y, Tanno S, Koizumi K, Nishikawa T, Nakamura K, Minoguchi M, et al. Gemcitabine chemoresistance and molecular markers associated with gemcitabine transport and metabolism in human pancreatic cancer cells. Br J Cancer. 2007;96:457–63. doi: 10.1038/sj.bjc.6603559. [DOI] [PMC free article] [PubMed] [Google Scholar]
- 11.Laurell H, Bouisson M, Berthelemy P, Rochaix P, Dejean S, Besse P, et al. Identification of biomarkers of human pancreatic adenocarcinomas by expression profiling and validation with gene expression analysis in endoscopic ultrasound-guided fine needle aspiration samples. World J Gastroenterol. 2006;12:3344–51. doi: 10.3748/wjg.v12.i21.3344. [DOI] [PMC free article] [PubMed] [Google Scholar]
- 12.Ebert M, Schandl L, Schmid RM. Differentiation of chronic pancreatitis from pancreatic cancer: recent advances in molecular diagnosis. Dig Dis. 2001;19:32–6. doi: 10.1159/000050651. [DOI] [PubMed] [Google Scholar]
- 13.Grote T, Logsdon CD. Progress on molecular markers of pancreatic cancer. Curr Opin Gastroenterol. 2007;23:508–14. doi: 10.1097/MOG.0b013e3282ba5724. [DOI] [PubMed] [Google Scholar]
- 14.Iacobuzio-Donahue CA, Ashfaq R, Maitra A, Adsay NV, Shen-Ong GL, Berg K, et al. Highly expressed genes in pancreatic ductal adenocarcinomas: a comprehensive characterization and comparison of the transcription profiles obtained from three major technologies. Cancer Res. 2003;63:8614–22. [PubMed] [Google Scholar]
- 15.Duxbury MS, Ito H, Benoit E, Ashley SW, Whang EE. CEACAM6 is a determinant of pancreatic adenocarcinoma cellular invasiveness. Br J Cancer. 2004;91:1384–90. doi: 10.1038/sj.bjc.6602113. [DOI] [PMC free article] [PubMed] [Google Scholar]
- 16.Szafranska AE, Davison TS, John J, Cannon T, Sipos B, Maghnouj A, et al. MicroRNA expression alterations are linked to tumorigenesis and nonneoplastic processes in pancreatic ductal adenocarcinoma. Oncogene. 2007;26:4442–52. doi: 10.1038/sj.onc.1210228. [DOI] [PubMed] [Google Scholar]
- 17.Bloomston M, Frankel WL, Petrocca F, Volinia S, Alder H, Hagan JP, et al. MicroRNA expression patterns to differentiate pancreatic adenocarcinoma from normal pancreas and chronic pancreatitis. JAMA. 2007;297:1901–8. doi: 10.1001/jama.297.17.1901. [DOI] [PubMed] [Google Scholar]
- 18.Heidenblut AM, Lüttges J, Buchholz M, Heinitz C, Emmersen J, Nielsen KL, et al. aRNA-longSAGE: a new approach to generate SAGE libraries from microdissected cells. Nucleic Acids Res. 2004;32:e131. doi: 10.1093/nar/gnh130. [DOI] [PMC free article] [PubMed] [Google Scholar]
- 19.Gold DV, Modrak DE, Ying Z, Cardillo TM, Sharkey RM, Goldenberg DM. New MUC1 serum immunoassay differentiates pancreatic cancer from pancreatitis. J Clin Oncol. 2006;24:252–8. doi: 10.1200/JCO.2005.02.8282. [DOI] [PubMed] [Google Scholar]
- 20.Simeone DM, Ji B, Banerjee M, Arumugam T, Li D, Anderson MA, et al. CEACAM1, a novel serum biomarker for pancreatic cancer. Pancreas. 2007;34:436–43. doi: 10.1097/MPA.0b013e3180333ae3. [DOI] [PubMed] [Google Scholar]
- 21.Koopmann J, Buckhaults P, Brown DA, Zahurak ML, Sato N, Fukushima N, et al. Serum macrophage inhibitory cytokine 1 as a marker of pancreatic and other periampullary cancers. Clin Cancer Res. 2004;10:2386–92. doi: 10.1158/1078-0432.ccr-03-0165. [DOI] [PubMed] [Google Scholar]
- 22.Marchese R, Muleti A, Pasqualetti P, Bucci B, Stigliano A, Brunetti E, et al. Low correspondence between K-ras mutations in pancreatic cancer tissue and detection of K-ras mutations in circulating DNA. Pancreas. 2006;32:171–7. doi: 10.1097/01.mpa.0000202938.63084.e3. [DOI] [PubMed] [Google Scholar]
- 23.Ishizone S, Yamauchi K, Kawa S, Suzuki T, Shimizu F, Harada O, et al. Clinical utility of quantitative RT-PCR targeted to α1,4-N-acetylglucosaminyl-transferase mRNA for detection of pancreatic cancer. Cancer Sci. 2006;97:119–26. doi: 10.1111/j.1349-7006.2006.00148.x. [DOI] [PMC free article] [PubMed] [Google Scholar]
- 24.Hoffmann K, Kerner C, Wilfert W, Mueller M, Thiery J, Hauss J, Witzigmann H. Detection of disseminated pancreatic cells by amplification of cytokeratin-19 with quantitative RT-PCR in blood, bone marrow and peritoneal lavage of pancreatic carcinoma patients. World J Gastroenterol. 2007;13:257–63. doi: 10.3748/wjg.v13.i2.257. [DOI] [PMC free article] [PubMed] [Google Scholar]
- 25.Symmans WF, Ayers M, Clark EA, Stec J, Hess KR, Sneige N, et al. Total RNA yield and microarray gene expression profiles from fine-needle aspiration biopsy and core-needle biopsy samples of breast carcinoma. Cancer. 2003;97:2960–71. doi: 10.1002/cncr.11435. [DOI] [PubMed] [Google Scholar]
- 26.Tsui NB, Ng EK, Lo YM. Stability of endogenous and added RNA in blood specimens, serum, and plasma. Clin Chem. 2002;48:1647–53. [PubMed] [Google Scholar]
- 27.Lim EH, Aggarwal A, Agasthian T, Wong PS, Tan C, Sim E, et al. Feasibility of using low-volume tissue samples for gene expression profiling of advanced non-small cell lung cancers. Clin Cancer Res. 2003;9:5980–7. [PubMed] [Google Scholar]
- 28.Wang E, Miller LD, Ohnmacht GA, Mocellin S, Perez-Diez A, Petersen D, et al. Prospective molecular profiling of melanoma metastases suggests classifiers of immune responsiveness. Cancer Res. 2002;62:3581–6. [PMC free article] [PubMed] [Google Scholar]
- 29.Sotiriou C, Powles TJ, Dowsett M, Jazaeri AA, Feldman AL, Assersohn L, et al. Gene expression profiles derived from fine needle aspiration correlate with response to systemic chemotherapy in breast cancer. Breast Cancer Res. 2002;4:R3. doi: 10.1186/bcr433. [DOI] [PMC free article] [PubMed] [Google Scholar]
- 30.Godfrey TE, Kim SH, Chavira M, Ruff DW, Warren RS, Gray JW, Jensen RH. Quantitative mRNA expression analysis from formalin-fixed, paraffin-embedded tissues using 5′ nuclease quantitative reverse transcription-polymerase chain reaction. J Mol Diagn. 2000;2:84–91. doi: 10.1016/S1525-1578(10)60621-6. [DOI] [PMC free article] [PubMed] [Google Scholar]
- 31.Doleshal M, Magotra AA, Choudhury B, Cannon BD, Labourier E, Szafranska AE. Evaluation and validation of total RNA extraction methods for microRNA expression analyses in formalin-fixed, paraffin-embedded tissues. J Mol Diagn. 2008;10:203–11. doi: 10.2353/jmoldx.2008.070153. [DOI] [PMC free article] [PubMed] [Google Scholar]
- 32.Xi Y, Nakajima G, Gavin E, Morris CG, Kudo K, Hayashi K, Ju J. Systematic analysis of microRNA expression of RNA extracted from fresh frozen and formalin-fixed paraffin-embedded samples. RNA. 2007;13:1668–74. doi: 10.1261/rna.642907. [DOI] [PMC free article] [PubMed] [Google Scholar]
- 33.Suits J, Frazee R, Erickson RA. Endoscopic ultrasound and fine needle aspiration for the evaluation of pancreatic masses. Arch Surg. 1999;134:639–42. doi: 10.1001/archsurg.134.6.639. discussion 642–3. [DOI] [PubMed] [Google Scholar]
- 34.Chang KJ, Nguyen P, Erickson RA, Durbin TE, Katz KD. The clinical utility of endoscopic ultrasound-guided fine-needle aspiration in the diagnosis and staging of pancreatic carcinoma. Gastrointest Endosc. 1997;45:387–93. doi: 10.1016/s0016-5107(97)70149-4. [DOI] [PubMed] [Google Scholar]
- 35.Shin HJ, Lahoti S, Sneige N. Endoscopic ultrasound-guided fine-needle aspiration in 179 cases: the M. D. Anderson Cancer Center experience. Cancer. 2002;96:174–80. doi: 10.1002/cncr.10614. [DOI] [PubMed] [Google Scholar]
- 36.Lüttges J, Galehdari H, Bröcker V, Schwarte-Waldhoff I, Henne-Bruns D, Klöppel G, et al. Allelic loss is often the first hit in the biallelic inactivation of the p53 and DPC4 genes during pancreatic carcinogenesis. Am J Pathol. 2001;158:1677–83. doi: 10.1016/S0002-9440(10)64123-5. [DOI] [PMC free article] [PubMed] [Google Scholar]
- 37.Balague C, Audie JP, Porchet N, Real FX. In situ hybridization shows distinct patterns of mucin gene expression in normal, benign, and malignant pancreas tissues. Gastroenterology. 1995;109:953–64. doi: 10.1016/0016-5085(95)90406-9. [DOI] [PubMed] [Google Scholar]
- 38.Bhanot U, Heydrich R, Möller P, Hasel C. Survivin expression in pancreatic intraepithelial neoplasia (PanIN): steady increase along the developmental stages of pancreatic ductal adenocarcinoma. Am J Surg Pathol. 2006;30:754–9. doi: 10.1097/00000478-200606000-00013. [DOI] [PubMed] [Google Scholar]
- 39.Hollingsworth MA, Strawhecker JM, Caffrey TC, Mack DR. Expression of MUC1, MUC2, MUC3 and MUC4 mucin mRNAs in human pancreatic and intestinal tumor cell lines. Int J Cancer. 1994;57:198–203. doi: 10.1002/ijc.2910570212. [DOI] [PubMed] [Google Scholar]
- 40.Lopes RB, Gangeswaran R, McNeish IA, Wang Y, Lemoine NR. Expression of the IAP protein family is dysregulated in pancreatic cancer cells and is important for resistance to chemotherapy. Int J Cancer. 2007;120:2344–52. doi: 10.1002/ijc.22554. [DOI] [PubMed] [Google Scholar]