Abstract
Simulations with a regional chemical transport model show that anthropogenic emissions of volatile organic compounds and nitrogen oxides (NOx = NO + NO2) lead to a dramatic diurnal variation of surface ozone (O3) in Houston, Texas. During the daytime, photochemical oxidation of volatile organic compounds catalyzed by NOx results in episodes of elevated ambient O3 levels significantly exceeding the National Ambient Air Quality Standard. The O3 production rate in Houston is significantly higher than those found in other cities over the United States. At night, a surface NOx maximum occurs because of continuous NO emission from industrial sources, and, consequently, an extensive urban-scale “hole” of surface ozone (<10 parts per billion by volume in the entire Houston area) is formed as a result of O3 removal by NO. The results suggest that consideration of regulatory control of O3 precursor emissions from the industrial sources is essential to formulate ozone abatement strategies in this region.
Elevated levels of airborne pollutants have been a widespread environmental problem in urban and rural areas throughout the United States (1–5). In particular, Houston, Texas, has received considerable scientific and political attention because of its ozone nonattainment over the National Ambient Air Quality Standard (NAAQS) (5–7). In addition to being one of the largest metropolitan areas in the United States, Houston houses one of the world's largest petrochemical complexes and contains a concentrated network of large coal-fired power plants. Anthropogenic emissions of volatile organic compounds (VOCs) and nitrogen oxides (NOx = NO + NO2) lead to distinct chemical features in the atmosphere. Most noticeably, elevated ozone levels are produced as a result of photochemical oxidation of VOCs catalyzed by NOx in the presence of sunlight (8–10). High concentrations of surface ozone have been shown to impose deleterious effects on human health and the ecosystem (11). Regulation of ozone precursor emissions under the United States Clean Air Act of 1970 and its subsequent amendments have been developed to reduce human exposure. Early ozone management strategies emphasized reduction of VOC and NOx emissions from on- and off-road automobiles, and recent attention under the state implementation plan (SIP) has been focused on NOx from electric utility power plants and VOCs and NOx from petrochemical plants. Development and enforcement of SIP, however, have been often hindered because of inadequate scientific understanding of the causes of high-ozone episodes and have invoked legal disputes between the state environmental agency and the industry. Although several observational results on O3 formation and budget issues in this region have been published, to date very few results attained by using scientifically oriented chemical transport models (CTMs) have been published in the refereed literature.
In this study, we simulated the spatial and temporal distributions of O3 and its precursors in the Houston metropolitan area by employing a regional CTM. The relationship between the rapid production, daily peak, and diurnal variation of surface O3 and the concurrence of high anthropogenic VOC and NOx emissions in this region is assessed.
Methods
The CTM was modified from a regional chemical transport model developed at the National Center for Atmospheric Research (NCAR) (12, 13). The horizontal grid resolution of 12 × 12 km was used, and there were 38 layers in the vertical direction from the surface to 100 mbar (1 bar = 100 kPa) in a terrain-following coordinate system with 7 layers in the lowest 50-mbar altitudes. The chemistry in the CTM included treatment of standard gas-phase and heterogeneous chemistry (12, 13). The inorganic chemistry part is similar to the original NCAR model (12), and the organic part is based on the CB-4 mechanism used in the Comprehensive Air Quality Model with the extension Version 3.1 (camx v3.1) (14). The CB-4 mechanism was modified to represent both polluted and remote tropospheric atmosphere (13). The isoprene oxidation mechanism was updated to accommodate the recent advances (15, 16). The heterogeneous reactions of NOx on black carbon aerosol (soot) (17, 18) and N2O5 on sulfate aerosol (19) were included in the model. The chemical initial and lateral boundary conditions were interpolated from Modeling OZone And Related chemical Tracers (mozart v.2), a global CTM (20). The CTM was driven by the output circulation field from a meteorological model, the Penn State/NCAR Mesoscale Model, Version 5 (MM5) (21). The diurnally varied sea/land breeze dominates the circulation pattern in this region (22). Throughout the simulation episode, the meteorological fields obtained by MM5 well reproduced available observed daytime and nighttime surface wind and temperature fields and the planetary boundary layer structures (13).
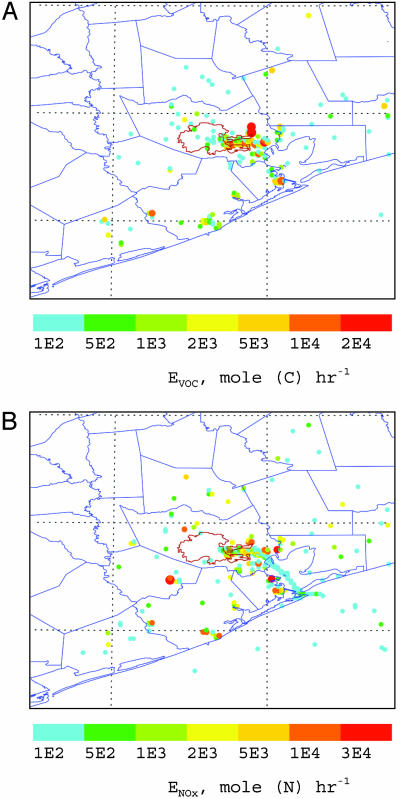
A stagnant ozone pollution episode (September 7–11, 1993) was chosen for the model study. This period is selected because a strong diurnal variability of ozone occurred with the maximum concentration of larger than 200 parts per billion by volume (ppbv) during the day and the minimum concentration <10 ppbv during night. A surface emission inventory (EI) of chemically speciated (based on the CB-4 mechanism), spatially gridded (16 × 16 km), and temporally resolved (1-h averaged) was provided by the Texas Commission on Environmental Quality (TCEQ) (23, 24). Emissions beyond the TCEQ EI spatial coverage were interpolated from the mozart input EI (1° × 1° resolution and daily averaged) (20). The industrial emission of olefins was adjusted according to recent field measurements from the 2000 Texas Air Quality Study (5). An extensive ground-based observation of O3, NOx, and other pollutants was conducted during the same time period associated with the Coastal Oxidant Assessment for Southern Texas (COAST) field project (23, 24). Industrial sources contribute significantly to the total VOC and NOx emissions (Fig. 1). For example, the industrial emissions comprise ≈50% of the total NOx over the Houston Metropolitan area and more in the industrial districts. The high emissions of VOCs and NOx concentrating near the Houston Ship Channel and along the west coastline of the Galveston Bay are from petrochemical plants. Another intensive NOx emission to the southwest of the Houston downtown area is from utility power plants. Diurnal variations of the industrial VOC and NOx emissions are generally within 20%.
Fig. 1.
Daily averaged industrial point emissions of VOCs (A) and NOx (B) in the Houston metropolitan area during the model simulation period. The thin red lines mark the Houston City limit, and the blue lines label the county limits near Houston. In the NOx panel, the blue dotted line along the Galveston Bay corresponds to ship emissions. The sizes of the symbols correlate to the emission strengths. The high emissions of VOCs and NOx concentrating near the Houston Ship Channel and along the west coastline of the Galveston Bay are from petrochemical plants. Another intensive NOx emission to the southwest of the Houston downtown area is from utility power plants. Diurnal variations of the industrial VOC and NOx emissions are generally within 20%.
Results and Discussion
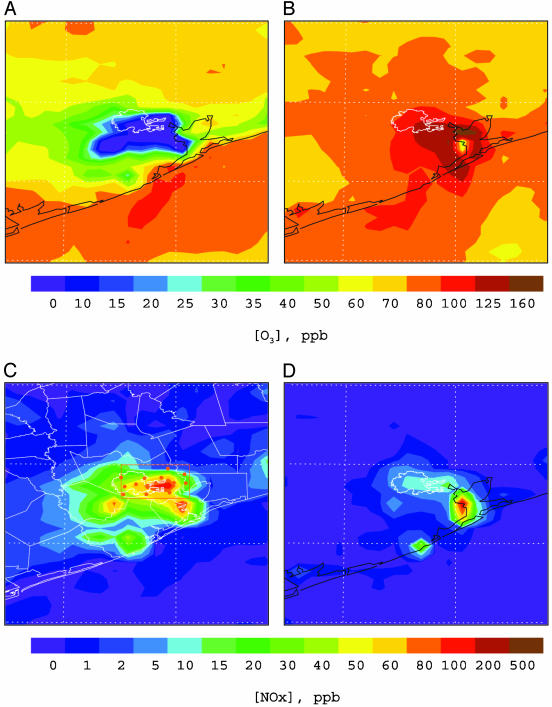
The simulated spatial distributions of the daytime [3 p.m. central daylight time (CDT)] and nighttime (11 p.m. CDT) O3 and NOx in the lowest model layer (about 30 m above ground level) are depicted in Fig. 2. A maximal zone of daytime surface ozone with concentrations exceeding 125 ppbv is located to the southeast region of the Houston downtown area, extending from the Houston Ship Channel to the Galveston Bay (Fig. 2B). The occurrence of this zone coincides with the industrial corridor with high VOC and NOx emissions from petrochemical plants (Fig. 1). During the daytime, photochemical oxidation of VOCs initiated by hydroxyl radicals OH produces organic peroxy radicals (RO2), facilitating cycling of NO to NO2 and formation of tropospheric ozone.
 |
[1] |
 |
[2] |
 |
[3] |
 |
[4] |
Fig. 2.
Simulated surface O3 (A and B) and NOx (C and D) distributions at 11 p.m. (A and C) and 3 p.m. (B and D) CDT during the time period of September 7–8, 1993. The Houston City limit is marked by thin white lines, and the other white lines in C label the county limits near Houston. Also shown in C are the locations of surface air quality monitoring stations marked by the brown dots. The brown frame encompassing all of the stations is defined as the Houston domain in the text.
The model calculates a highest surface O3 concentration of 212 ppbv at 3 p.m. located slightly southeast to the Houston Ship Channel, in agreement with the ground-based ozone observations showing that a 1-h averaged daily O3 peak of 214 ppbv was measured during the same time period at a nearby monitoring site. A narrow O3 deficit zone roughly along the west coastline of the Galveston Bay divides the maximal ozone region. This O3 minimum may be explained because of NOx emissions from petrochemical plants and ships on either side of this region (Fig. 1B). Because the daytime temperature over the ocean surface is relatively lower than that over the land surface, vertical mixing is rather insufficient over the ocean surface and along the coastline (13). NOx emitted from this region is not efficiently transported vertically, resulting in the maximal NOx zone (Fig. 2D). At high NOx, the reaction OH + NO2 → HNO3 becomes important, leading to removal of OH radicals and hence inhibiting photochemical O3 formation.
In contrast to the daytime O3 maximum, the model simulations show exceedingly low levels of nighttime surface ozone: an extensive O3 hole covers much of the Houston metropolitan area (Fig. 2 A) and persists throughout the night (i.e., from 8 p.m. to 6 a.m. CDT). It is evident that the surface O3 hole correlates with a NOx maximum (Fig. 2C). The elevated NOx levels are attributed to continuous nighttime NO emissions from utility power plants located to the southwest of the downtown area and from petrochemical plants along the Houston Ship Channel and the Galveston Bay (Fig. 1). In addition, meteorological and chemical processes are also responsible for the nighttime NOx maximum. During the night, the atmosphere is characterized by a more stability condition (no solar radiation) and hence inefficient vertical mixing, and NOx emitted from industrial sources is trapped within the planetary boundary layer. Also, the photo-chemical process ceases at night, terminating chemical NOx removal such as by the reaction of OH with NO2 to form HNO3 (23). Consequently, the large abundance of NOx near the surface level leads to nearly complete removal of ozone by the reaction NO + O3 → NO2 + O2. We also assessed other plausible chemical and physical removal processes for the surface ozone. For example, ozone undergoes efficient dry deposition (25) and reacts with olefins (26, 27) that also are abundant because of emissions from petrochemical plants. Model sensitivity simulations reveal that those O3 destruction and removal processes contribute negligibly to the nighttime O3 loss in the Houston metropolitan area. In addition, we found that heterogeneous chemistry occurring on soot accounts for <5% of the nighttime NOx removal.
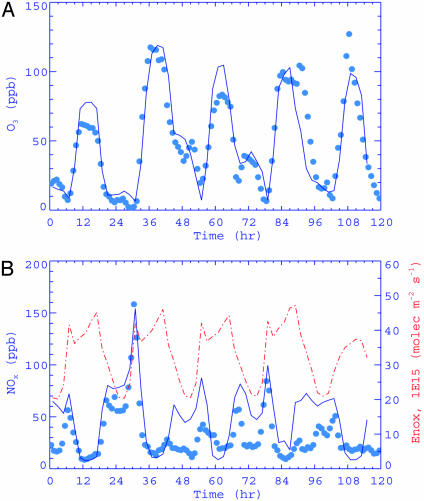
The modeled diurnal variations of O3 and NOx over the Houston metropolitan area are displayed and compared to atmospheric observations in Fig. 3. The locations of the monitoring stations are marked as the brown dots in Fig. 2C (delimited within a brown rectangle which is referred as the Houston domain). The modeled values at the lowest model layer are linearly interpolated to a monitoring site from the four cells surrounding the monitoring station, and the comparisons are made for the O3 and NOx averaged over the monitoring stations (15 for O3 and 12 for NOx, and 3 stations within the rectangle do not have NOx data). The observation data are 1-h averaged values, whereas the model values are instantaneous. Also shown in Fig. 3B as the red dashed–dotted line (right vertical axis) is the NOx emission rate averaged over the same domain. The two daily peaks of NOx emission occurring around 6 a.m. and 4 p.m. CDT correspond to the morning and afternoon traffic peaks, respectively. The modeled temporal O3 evolution confirms the drastic diurnal variation of surface ozone (Fig. 3A). The O3 concentration rises rapidly after sunrise, reaches a peak in the early afternoon hours, and drops sharply after sunset, consistent with efficient photochemical ozone production during the daytime and rapid O3 removal by NO at night. Similarly, the modeled NOx evolution also exhibits a pronounced diurnal pattern (Fig. 3B). NOx typically peaks before sunrise because of nighttime accumulation of industrially emitted NO and increasing automobile emission associated with the morning traffic. A NOx minimum is maintained during the daytime hours because of vertical dilution and chemical processing, even if the NOx emission remains high. Our modeled O3 and NOx diurnal variations are consistent with atmospheric measurements (Fig. 3). Throughout the episode, ozone is reasonably simulated, and the integral (time-averaged) agreement over the 5 days is within 10%. The model also captures the diurnal NOx changes. The difference between the model and observation may be attributed to several factors, including the difference in the monitoring and model height and the horizontal and vertical resolutions of the model.
Fig. 3.
Temporal evolution of simulated (solid lines) and observed (filled circles) surface O3 (A) and NOx (B) concentrations averaged over the Houston domain during September 7–11, 1993.
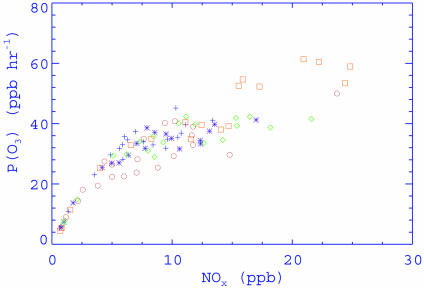
To quantify photochemical ozone formation, we computed the O3 production rate as a function of NOx concentration (Fig. 4). The chemical production rate of ozone is defined as P(O3) = d(Ox)/dt, where Ox = O(1D) + O3 + NO2. Note that during the daytime NO2 can be reasonably assumed to achieve a steady state so that d(Ox)/dt ≈ d(O3)/dt. It is commonly believed that the O3 production rate increases at low NOx until a maximum is reached and then decreases at high NOx (8, 13). This behavior occurs because high NOx promotes removal of OH radicals by the OH reaction with NO2 and hence reduces photochemical O3 formation. In addition to NOx, P(O3) is also dependent on VOC reactivity, sunlight, and radical precursors (8). Our calculations show that P(O3) does not exhibit the expected decrease at high NOx and that the maximal O3 production rate is not attained for the NOx concentration as high as 20 ppbv. The O3 production rates of >20 ppbv·h-1 prevail over much the Houston domain, and the largest P(O3) values (>40 ppbv·h-1) occur exclusively in the industrial Houston Ship Channel region, both reflecting very high anthropogenic VOC reactivity. Our calculated O3 production efficiency in the Houston metropolitan area is distinct from those found in other cities of the United States, such as Nashville, TN; New York; Philadelphia; and Phoenix (2, 5). Those cities have much less industrial emissions of VOCs and NOx, with P(O3) being typically <20 ppbv·h-1. Our results, however, are similar to another recent study that also shows high ozone production efficiency in heavily polluted industrial plumes over the Houston metropolitan area by analyzing aircraft data of VOCs, NOx, and other ozone precursors measured during the recent Texas Air Quality Study (TexAQS 2000) (5).
Fig. 4.
Calculated O3 production rate as a function of NOx concentration at 3 p.m. CDT on the model grids within the Houston domain. The symbols represent the following simulation dates: +, 0907; *, 0908; ⋄, 0909; □, 0910; ○, 0911.
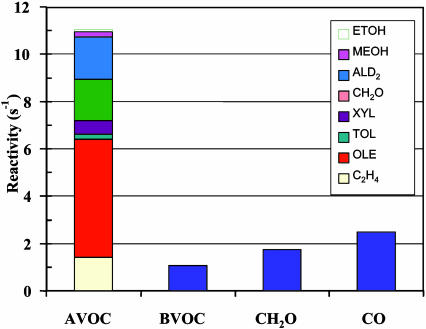
The fact that the ozone production rate does not exhibit the expected decrease at high NOx is explained by the very high VOC reactivity in this region that leads to abundant organic peroxy radicals (RO2) to react with NO to produce O3. The calculated VOC reactivity, defined as the product of the concentration of a VOC species and its rate constant with OH, is shown in Fig. 5. Anthropogenic VOCs (AVOCs) account for ≈50% of the total VOC reactivity, whereas biogenic VOCs (BVOCs) and CO account for 19% and 18%, respectively. Clearly, industrial VOCs such as alkenes (C2H4, OLE, and part of ALD2) dominate AVOCs in the O3 production. Hence, the large abundance and high reactivity of AVOCs and the coexistence of abundant AVOCs and NOx are responsible for the high O3 production rates in this area.
Fig. 5.
Calculated VOC reactivity averaged over the entire episode within the bottom model layer in the Houston domain. AVOC, anthropogenic VOC; BVOC, biogenic VOC.
Conclusions
Our model simulations reveal that ozone formation in the Houston metropolitan area is governed by complex interplay of chemical transformation, transport and mixing by meteorological circulation, and emissions from anthropogenic sources. The results show a striking pattern of the diurnal variation of surface ozone (O3) in this region. During the daytime, photochemical oxidation of VOCs catalyzed by NOx in the presence of sunlight results in episodes of high ambient O3 levels of >200 ppbv, and at night an urban-scale surface ozone hole is formed. Our work unambiguously establishes the links between the rapid production, daily peak, and diurnal variation of surface O3 and the concurrence of high anthropogenic VOC and NOx emissions. Regulatory control of industrial VOC and NOx emissions, hence, will not only suppress the daytime O3 peak but also will modulate the extreme diurnal variation of surface O3 in this region.
Acknowledgments
We thank John Nielsen-Gammon (Texas A&M University) for assistance with the MM5 simulations, Jim Smith (Texas Commission on Environmental Quality) for providing the emission inventory data used in the simulations, and Robert A. Duce (Texas A&M University) for helpful comments on the manuscript. This work was supported by the Texas Air Research Center and the National Aeronautics and Space Administration New Investigator Program in Earth Science. The National Center for Atmospheric Research is supported by the National Science Foundation.
Abbreviations: CDT, central daylight time; CTM, chemical transport model; NOx,NO + NO2; ppbv, parts per billion by volume; VOC, volatile organic compound.
References
- 1.Chameides, W. L., Salyer, R. D. & Cowling, E. B. (1997) Science 276, 916-916. [DOI] [PubMed] [Google Scholar]
- 2.Ryerson, T. B., Trainer, M., Holloway, J. S., Parrish, D. D., Huey, L. G., Sueper, D. T., Frost, G. J., Donnelly, S. G., Schauffler, S., Atlas, E. L., et al. (2001) Science 292, 719-723. [DOI] [PubMed] [Google Scholar]
- 3.Thornton, J. A., Wooldridge, P. J., Cohen, R. C., Martinez, M., Harder, H., Brune, W. H., Williams, E. J., Roberts, J. M., Fehsenfeld, F. C. Hall, S. R., et al. (2002) J. Geophys. Res. 107, 4146. [Google Scholar]
- 4.Chameides, W. L., Lindsay, R. W., Richardson, J. & Kiang, C. S. (1988) Science 241, 1473-1475. [DOI] [PubMed] [Google Scholar]
- 5.Kleinman, L. I., Daum, P. H., Imre, D., Lee, Y.-N., Nunnermacker, L. J., Weinstein-Lloyd, S. & Rudolph, J. (2002) Geophys. Res. Lett. 29, 1467. [Google Scholar]
- 6.Carroll, R. J., Chen, R., George, E. I., Li, T. H., Newton, H. J., Schmiediche, H. & Wang, N. (1997) J. Am. Stat. Assoc. 438, 392-404. [Google Scholar]
- 7.U.S. Environmental Protection Agency (1998) National Air Quality and Emissions Trends Report 1998 (U.S. Environmental Protection Agency, Washington, DC), EPA 454/R-00-003.
- 8.Sillman, S., Logan, J. A. & Wofsy, S. C. (1990) J. Geophys. Res. 95, 1837-1851. [Google Scholar]
- 9.Thompson, A. M. (1992) Science 256, 1157-1165. [DOI] [PubMed] [Google Scholar]
- 10.Zhang, R., Tie, X. & Bond, D. W. (2003) Proc. Natl. Acad. Sci. USA 100, 1505-1509. [DOI] [PMC free article] [PubMed] [Google Scholar]
- 11.National Research Council (1991) Rethinking the Ozone Problem in Urban and Regional Air Pollution (Natl. Acad. Press, Washington, DC).
- 12.Hess, P. G., Flocke, S., Lamarque, J. F., Barth, M. C. & Madronich, S. (2000) J. Geophys. Res. 105, 26809-26839. [Google Scholar]
- 13.Lei, W. (2003) Ph.D. dissertation (Texas A&M Univ., College Station).
- 14.Simonaitis, R., Meagher, J. F. & Bailey, E. M. (1997) Atmos. Environ. 31, 27-43. [Google Scholar]
- 15.Zhang, R., Suh, I., Clinkenbeard, A. D., Lei, W. & North, S. W. (2000) J. Geophys. Res. 105, 24627-24635. [Google Scholar]
- 16.Zhang, D., Zhang, R., Park, J. & North, S. W. (2002) J. Am. Chem. Soc. 124, 9600-9605. [DOI] [PubMed] [Google Scholar]
- 17.Ammann, M., Kalberer, M., Jost, D. T., Tobler, L., Rossler, E., Piguet, D., Gaggeler, H. W. & Baltensperger, U. (1998) Nature 395, 157-160. [Google Scholar]
- 18.Kotamarthi, V. R., Gaffney, J. S., Marley, N. A. & Doskey, P. V. (2001) Atmos. Environ. 35, 4489-4498. [Google Scholar]
- 19.Zhang, R., Leu, M. T. & Keyser, L. F. (1995) Geophys. Res. Lett. 22, 1493-1496. [Google Scholar]
- 20.Brasseur, G. P., Hauglustaine, D. A., Walters, S., Rasch, P. J., Muller, J. F., Granier, C. & Tie, X. X. (1998) J. Geophys. Res. 103, 28265-28289. [Google Scholar]
- 21.Grell, G. A. (1993) A Description of the Fifth Generation Penn State/National Center for Atmospheric Research Mesoscale Model (MM5), NCAR/TN-398+IA (National Center for Atmospheric Research, Boulder, CO).
- 22.Orville, R. E., Huffines, G., Nielsen-Gammon, J., Zhang, R., Ely, B., Steiger, S., Philips, S., Allen, S. & Read, W. (2001) Geophys. Res. Lett. 28, 2597-2600. [Google Scholar]
- 23.Lawson, D. R. (1995) Coastal Oxidant Assessment for Southern Texas (COAST) Project: Final Report (Texas Natural Resource Conservation Commission, Austin, TX).
- 24.Korc, M., Korc, M., Jones, C., Chinkin, L., Main, H. & Roberts, P. (1995) Use of PAMS Data to Evaluate the Texas COAST Emission Inventory (U.S. Environmental Protection Agency, Washington, DC).
- 25.Wesely, M. L. (1989) Atmos. Environ. 23, 1293-1304. [Google Scholar]
- 26.Zhang, D. & Zhang, R. (2002) J. Am. Chem. Soc. 124, 2692-2703. [DOI] [PubMed] [Google Scholar]
- 27.Zhang, D., Lei, W. & Zhang, R. (2002) Chem. Phys. Lett. 358, 171-179. [Google Scholar]


