

Abstract
Purpose
To present and discuss numerical calculations of the specific absorption rate (SAR) and temperature in comparison to regulatory limits. While it is possible to monitor whole-body or whole-head average SAR and/or core body temperature during MRI in practice, this is not generally true for local SAR values or local temperatures throughout the body. While methods of calculation for SAR and temperature are constantly being refined, methods for interpreting results of these calculations in light of regulatory limits also warrant discussion.
Materials and Methods
Numerical calculations of SAR and temperature for the human head in a volume coil for MRI at several different frequencies are presented.
Results
Just as the field pattern changes with the frequency, so do the temperature distribution and the ratio of maximum local SAR (in 1-g or 10-g regions) to whole-head average SAR. In all of the cases studied here this ratio is far greater than that in the regulatory limits, indicating that existing limits on local SAR will be exceeded before limits on whole-body or whole-head average SAR are reached.
Conclusion
Calculations indicate that both SAR and temperature distributions vary greatly with B1 field frequency, that temperature distributions do not always correlate well with SAR distributions, and that regulatory limits on local temperature may not be exceeded as readily as those on local SAR.
Keywords: MRI; SAR; temperature, safety; simulations
To ensure that the radiofrequency (RF) energy absorbed by human subjects during magnetic resonance imaging (MRI) does not induce local thermal damage or whole-body thermoregulatory problems, regulating committees have placed limits on the maximum local specific energy absorption rate (SARL) in any 1 g (1) or 10 g (2) of tissue throughout the body, and on the whole-body or whole-head (as appropriate) average SAR (SARW) (1,2). Recognizing that the risk incurred by SAR is related to an increase in temperature, limits for local and core body temperature increases have also been recommended (2).
While it is possible to monitor SARW and core body temperature in practice, this is not generally true for SARL or local temperatures throughout the body. Thus, numerical methods of calculation can be used as means of predicting local SAR levels and temperatures during MRI (2).
While a number of authors have published numerical calculations of SAR in anatomical models of the human subject for MRI, relatively few have attempted to present results in a manner that can be easily compared with regulatory limits. These authors include Collins et al (3–7), Hand et al (8), Liu et al (9), Zhai et al (10), and Nguyen et al (11). Collins et al (7) and Nguyen et al (11) also presented temperature calculations for human head models in volume coils at different frequencies, and Hand et al (12,13) reported temperature calculation results for human legs using surface coils.
While the technical details of calculating SAR and temperature are constantly being refined, methods for interpreting the results of these calculations in light of regulatory limits also warrant discussion. In this study, numerical calculations of SARW and maximum SARL for a head-size TEM-type volume resonator (14,15) loaded with a human head at several frequencies from 64 MHz to 400 MHz are presented. Temperature increases throughout the head are also calculated assuming an input power to achieve the maximum allowable SARW in the head for two different sets of standards (1,2).
It is found that just as the field pattern changes with the frequency, so does the temperature distribution and ratio of maximum SARL (in 1-g or 10-g regions) to SARW. In all of these cases this ratio is far greater than that in the regulatory limits. Importantly, calculations indicate that temperature distributions do not correlate well with SAR distributions, as temperature is greatly affected by tissue-dependent perfusion values, and that regulatory limits on local temperature may not be as readily exceeded as those on local SAR.
MATERIALS AND METHODS
Full-Maxwell calculations of the electromagnetic fields produced throughout the head were performed using our own in-house-built implementation of the finite difference time domain (FDTD) method for electromagnetics (16). Our FDTD software was verified by comparing the results with electrical fields, magnetic fields, and SAR distributions published previously and calculated analytically (17). The head model had a resolution of 3 mm in each dimension. Tissue geometry and mass density were obtained by anonymous ftp from the United States Air Force Research Laboratory. The computational domain consisted of a 150 × 150 × 150 grid of 3 × 3 × 3 mm cells. An eight-layered Berenger’s Perfectly Matched Layer (PML) was implemented as the absorption boundary. It was necessary to drive the source current for five RF cycles to reach a steady state. On a Dell Precision 670 workstation (two 3.6GHz CPUs with 4G memory), this required a running time of one to seven hours depending on the simulated frequency. The RF coil was modeled after a TEM resonator with multiple sources to achieve a current distribution such that all rungs had equal current magnitude and the current phase was proportional to the angle of location in the azimuthal plane (3). This approach has shown good agreement with experimental measurement in head-sized volume coils at frequencies up to 128 MHz (18), and with other simulated methods for driving birdcage coils in body-sized birdcage coils at up to 128 MHz (9). Also, as transmit arrays become increasingly prevalent in high-field MRI (19), the use of one or more source per array element is becoming even more relevant. The coil had an inner diameter (distance between rungs on opposite sides of the coil) of 28 cm, an outer (shield) diameter of 33 cm, and a length of 19 cm. Calculations were performed at 64, 128, 200, 300, 340, and 400 MHz corresponding to MRI at 1.5, 3.0, 4.7, 7.0, 8.0, and 9.4 Tesla static magnetic field strengths. SARW for the entire head (the portion of the model above the neck) and SARL for 1-g (SAR1g) and 10-g (SAR10g) regions were calculated by a standard method (20) whereby SARs in a region of tissue-containing cells surrounding a central cell are averaged as the region is expanded by one cell at a time until a specified mass of tissue (1 g or 10 g) is reached. Electrical properties of tissue were derived using widely used data-fitting equations and associated empirically determined parameters.
Temperature (T) was modeled in the head with a finite-difference implementation of the Pennes bioheat equation with an established convection-based boundary condition (21). This equation provides a simple method for considering the effects of thermal conduction, perfusion, metabolism, and heat absorption on temperature in tissues. Our temperature-calculation software was verified by comparison to results published previously and calculated analytically (17).
The different values for material density, heat capacity, thermal conductivity, perfusion by blood, and heat of metabolism for white matter, gray matter, blood, bone, muscle, fat, and skin were acquired from the literature (7,22–25) and are given in Table 1. For simplicity, it was assumed that the rate of perfusion was independent of time and temperature, the temperature of blood was a constant 37°C, and the ambient temperature was 24°C. An equilibrium temperature distribution was first calculated with SAR = 0 W/kg throughout the model. Then RF fields normalized to induce 3.0 and 3.2 W/kg averaged over the head, the current Food and Drug Administration (FDA) and International Electrotechnical Commission (IEC) “normal mode” limits on average SAR in the head, respectively). After simulation of one half-hour of exposure, the new temperature distribution was recorded. Separate calculations showed that at this point the increase in temperature above the zero-SAR levels was more than 95% complete.
Table 1.
Thermal Properties of Tissue Used in Calculations*
| Tissue name | Thermal conductivity (W/m/°C) |
Specific heat (J/kg/°C) |
Metabolic rate (W/m3 second) |
Blood perfusion coefficient (W/m3/°C) |
Density (kg/m3) |
|---|---|---|---|---|---|
| Blood | 0.493 | 3900 | 0 | 0 | 1058 |
| Blood vessel | 0.46 | 3553 | 1600 | 9000 | 1040 |
| Body fluid | 0.621 | 4155 | 0 | 0 | 1010 |
| Bone (cancellous) | 0.4 | 1300 | 590 | 3300 | 1920 |
| Bone (cortical) | 0.4 | 1300 | 610 | 3400 | 1990 |
| Bone marrow | 0.22 | 2700 | 5700 | 32000 | 1040 |
| Cartilage | 0.47 | 3500 | 1600 | 9000 | 1097 |
| Cerebellum | 0.57 | 3700 | 7100 | 37630 | 1038 |
| CSF | 0.62 | 4200 | 0 | 0 | 1007.2 |
| Eye (aqueous humor) | 0.6 | 4200 | 0 | 0 | 1008.9 |
| Eye (cornea) | 0.58 | 4200 | 0 | 0 | 1076 |
| Eye (lens) | 0.4 | 3000 | 0 | 0 | 1053 |
| Eye (sclera) | 0.58 | 4200 | 0 | 0 | 1026 |
| Fat | 0.25 | 2500 | 300 | 1700 | 916 |
| Glands | 0.53 | 3600 | 64000 | 57120 | 1050 |
| Gray matter | 0.57 | 3700 | 7100 | 45090 | 1038 |
| Ligaments | 0.31 | 2802 | 860 | 4830 | 1220 |
| Lymph | 0.49 | 3686 | 5650 | 31800 | 1040 |
| Mucous membrane | 0.43 | 3300 | 1600 | 9000 | 1040 |
| Muscle | 0.5 | 3600 | 480 | 3360 | 1046.9 |
| Nerve | 0.46 | 3500 | 7100 | 40000 | 1038 |
| Skin/dermis | 0.42 | 3500 | 1620 | 8065 | 1125 |
| Tooth | 0.5 | 1340 | 0 | 0 | 2160 |
| White matter | 0.5 | 3600 | 7100 | 15925 | 1038 |
Parameters and units used are consistent with representations of the Pennes Bioheat equation often used in electrical engineering literature (21).
CSF = cerebrospinal fluid.
RESULTS
The geometry of the head in the volume coil on central axial, sagittal, and coronal planes is shown in Fig. 1. The SAR distribution at model resolution (3 mm) at three of the frequencies during exposure to a head-average SAR of 3.0 W/kg (1) is shown in Fig. 2 on an axial plane passing through the eyes, an axial plane passing through the center of the coil and brain, and sagittal and coronal planes passing through the center of the coil and brain. Similar plots for head-average SAR levels of 3.2 W/kg (2) do not look visibly different from those in Fig. 2. The ratio of SARL to SARW at each frequency is shown in Table 2 with the corresponding ratios in the FDA (1-g regions) and IEC (10-g regions) regulatory limits at the bottom for comparison.
Figure 1.
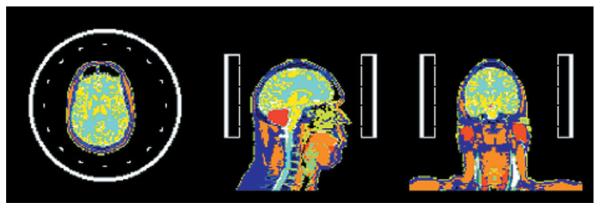
Coil and head model geometry on the axial, sagittal, and coronal planes passing through the coil center.
Figure 2.
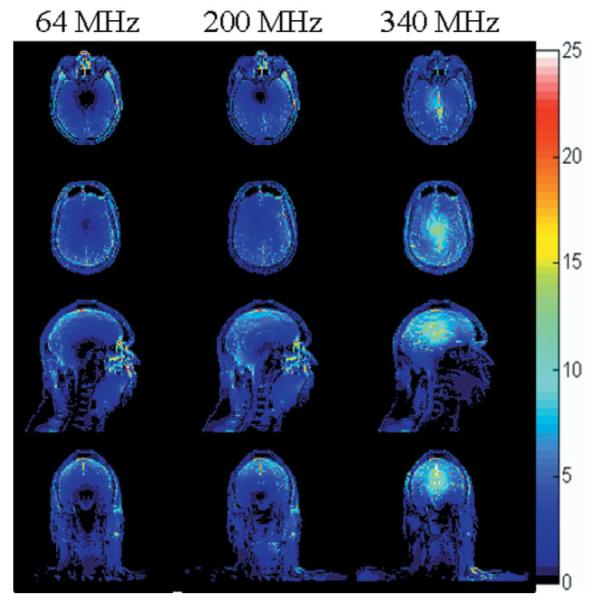
SAR distribution (W/kg) at model resolution (3 mm) at three of the frequencies modeled during exposure to a head-average SAR of 3.0 W/kg on an axial plane passing through the eyes (top), an axial plane passing through the center of the coil and brain (second row), and sagittal and coronal planes passing through the center of the coil and brain (third and bottom rows).
Table 2.
Ratio of Maximum Local to Whole-Head Average SAR for a Human Head Model in a Volume Coil at Several Frequencies Compared to the Ratios in the Regulatory Limits
| Frequency | SAR1g/SARW | SAR10g/SARW |
|---|---|---|
| 64 MHz | 6.1 | 3.4 |
| 128 MHz | 5.2 | 3.2 |
| 200 MHz | 5.6 | 3.5 |
| 300 MHz | 5.4 | 4.1 |
| 340 MHz | 6.7 | 5.0 |
| 400 MHz | 6.0 | 4.4 |
| FDA limits | 2.7 | – |
| IEC limits | – | 3.12 |
FDA = Food and Drug Administration, IEC = International Electrotechnical Commission.
The distribution of temperature increase from exposure to the SAR patterns shown in Fig. 2 (with a head-average SAR of 3.0 W/kg (1)) is shown in Fig. 3 on corresponding slices. Similar plots of temperature for head-average SAR levels of 3.2 W/kg (2) do not look visibly different from those in Fig. 3. Although the maximum increase in temperature exceeds 1°C in muscle temperature at frequencies from 64 to 300 MHz, and barely exceeds 1°C in cerebrospinal fluid at 340 and 400 MHz, the maximum temperature increase in brain reaches only 0.87°C, occurring in white matter at 400 MHz.
Figure 3.
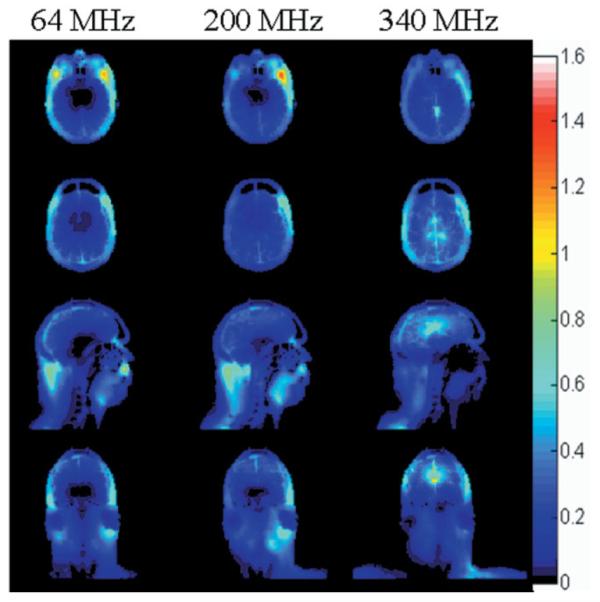
Distribution of temperature increase (°C) at three of the frequencies modeled during exposure to a head-average SAR of 3.0 W/kg on an axial plane passing through the eyes (top), an axial plane passing through the center of the coil and brain (second row), and sagittal and coronal planes passing through the center of the coil and brain (third and bottom rows).
DISCUSSION
At a low frequency, the SAR tends to be high toward the outside of the head and brain, with a low-SAR region near the center of the head, as seen at 64 MHz in Fig. 2. As the frequency increases, the SAR distribution moves inward (Fig. 2, 200 MHz) until there appears to be a high-SAR region near the center of brain (Fig. 2, 340 MHz). This trend is consistent with previous calculations (3,17,26), with the high-SAR region near the center of brain at high frequencies perhaps being more apparent in volume coils with TEM-type current patterns (17,26) as modeled here than with birdcage-type current patterns (3). The SAR pattern shown here in the brain was found to compare well with that in the upper half of a sphere centered in the volume coil (27).
At every frequency, the ratio of maximum SARL in either 1-g or 10-g regions to the head-average (or body average) SAR is higher than that in the regulatory limits (Table 2). This is consistent with previous calculations for the head in volume and surface coils (3–5,7,11), body in a volume coil (8,9) (Table 3), surface coil on the human chest (6), and other coil/tissue geometries (8,12,28,29), and emphasizes the importance of good estimates of SARL, if not temperature. Importantly, these results indicate that SARL will nearly always exceed existing limits before SARW does. Because only SARW is typically monitored when volume coils are used in MRI, this also indicates that existing limits on SARL are likely exceeded often in practice.
Table 3.
Ratio of Maximum Local to Whole-Body Average SAR for Two Different Subjects in a Whole-Body Volume Coil Compared to the Ratios in Corresponding Regulatory Limits*
| Subject | SAR1g/SARW | SAR10g/SARW | |
|---|---|---|---|
| 64 MHz | 1 | 18 | 10 |
| 2 | 16 | 11 | |
| 128 MHz | 1 | 18 | 10 |
| 2 | 16 | 13 | |
| FDA limits | 2 | – | |
| IEC limits | – | 5 |
Results derived recently from calculations for a previous publication (8).
FDA = Food and Drug Administration, IEC = International Electrotechnical Commission.
Typically, numerically calculated SAR10g/SARW is closer to the ratios of corresponding IEC limits than SAR1g/SARW is to the ratios of corresponding FDA limits (Tables 2 and 3). When compared to the numerically-calculated ratios, the IEC SAR10g limits appear much less restrictive overall than FDA SAR1g limits. Because numerical calculations similar to those used here and elsewhere generally show very good agreement with experiment in RF magnetic field distributions, it is reasonable to assume that with anatomic models they can produce more realistic representations of SAR values in the human body than can calculations or experiment in homogeneous samples with simple geometries. Assuming that the numerically-calculated results are representatitive of SAR values in vivo, the ratio of SARL to SARW in the IEC limits is closer to the ratios of SARL to SARW in reality than are the ratios in the FDA limits (Tables 2 and 3).
In addition to limits on SAR, the IEC has also issued limits on temperature increase. Since it is temperature that is associated with tissue damage, a better understanding of the relationship between temperature and SAR is desired. In the results shown here (Figs. 2 and 3) and in previous works (7,11–13), we see that the relationship between SAR and temperature increase is not straightforward. In areas of high perfusion, such as the brain, moderate to high SAR levels can result in a minimal temperature increase, while in areas of lower perfusion, such as muscle at rest and the eye, temperature may increase even with relatively low SAR levels. Thermal conduction and heat loss to the environment also bring dissimilarity between SAR and temperature distributions. When a volume or surface coil is driven at 3.0 W/kg average SAR over the head, it is unlikely that any temperature increase much above 1°C will occur in brain tissue. Still, any heating of the hypothalamic area of the brain may be of particular concern because of the role of the hypothalamus in thermoregulation.
There are many challenges to performing meaningful calculations of local SAR levels to ensure patient safety. These include defining a meaningful volume of interest (1 g, 10 g, etc.) and the corresponding local SAR limit (28,29), defining a method for averaging SAR in neighboring cells to achieve the volume of interest (20), and the different relationships between SAR and temperature in different tissues and geometries (7,11–13). It is also apparent that different tissues have different amounts of resistance to damage for a given temperature insult (28,30). Because numerical calculations for comparison to regulatory limits on local temperature do not show a very good spatial correlation between SAR and temperature, due largely to the wide variance in perfusion rates of different tissues, perhaps tissue-specific SAR limits or other methods to consider temperature-related factors would be valuable. Compared to calculating the SAR distribution with the Maxwell equations, calculating the temperature increase with the Pennes bioheat equation is relatively straightforward; however, it also has well known limitations. In particular, many authors have developed methods to more accurately account for heat exchange with vasculature in much greater detail than considered here (31,32). Because the effect of vasculature is generally to cool the surrounding tissue in problems of local heating, such as that modeled here, our exclusion of this aspect of heating likely ensures that our calculations to ensure the safety of MRI are conservative. Still more conservative temperature calculations could also be performed by utilizing lower perfusion values. By performing temperature calculations to compare with the limits, many technical details and imperfections of defining meaningful local SAR limits and calculating meaningful local SAR values can be avoided.
Acknowledgments
Contract grant sponsor: National Institutes of Health; Contract grant numbers: R01 EB 000454, R01 EB 000895.
REFERENCES
- 1.Center for Devices and Radiologic Health . Guidance for the submission of premarket notifications for magnetic resonance diagnostic devices. Food and Drug Administration; Rockville: 1988. http://www.fda.gov/cdrh/ode/guidance/793.html. [Google Scholar]
- 2.International Electrotechnical Commission . International standard, medical equipment—part 2: particular requirements for the safety of magnetic resonance equipment for medical diagnosis. 2nd revision Vol. 601. International Electrotechnical Commission; Geneva: 2002. pp. 2–33. [Google Scholar]
- 3.Collins CM, Smith MB. Signal-to-noise ratio and absorbed power as functions of main magnetic field strength and definition of ‘90’ RF pulse for the head in the birdcage coil. Magn Reson Med. 2001;45:684–691. doi: 10.1002/mrm.1091. [DOI] [PubMed] [Google Scholar]
- 4.Collins CM, Li S, Smith MB. SAR and B1 field distributions in a heterogeneous human head model within a birdcage coil. Magn Reson Med. 1998;40:847–856. doi: 10.1002/mrm.1910400610. [DOI] [PubMed] [Google Scholar]
- 5.Collins CM, Smith MB. Spatial resolution of numerical models of man and calculated specific absorption rate using the FDTD method: a study at 64 MHz in a magnetic resonance imaging coil. J Magn Reson Imaging. 2003;18:383–388. doi: 10.1002/jmri.10359. [DOI] [PubMed] [Google Scholar]
- 6.Collins CM, Smith MB. Calculations of B1 distribution, SNR, and SAR for a surface coil against an anatomically-accurate human body model. Magn Reson Med. 2001;45:692–699. doi: 10.1002/mrm.1092. [DOI] [PubMed] [Google Scholar]
- 7.Collins CM, Liu W, Wang JH, et al. Temperature and SAR calculations for a human head within volume and surface coils at 64 and 300 MHz. J Magn Reson Imaging. 2004;19:650–656. doi: 10.1002/jmri.20041. [DOI] [PubMed] [Google Scholar]
- 8.Hand JW, Li Y, Thomas EL, Rutherford ME, Hajnal JV. Prediction of specific absorption rate in mother and fetus associated with MRI examinations during pregnancy. Magn Reson Med. 2006;55:883–893. doi: 10.1002/mrm.20824. [DOI] [PubMed] [Google Scholar]
- 9.Liu W, Collins CM, Smith MB. Calculations of B1 distribution, specific energy absorption rate, and intrinsic signal-to-noise ratio for a body-size birdcage coil loaded with different human subjects at 64 and 128 MHz. Appl Magn Reson. 2005;29:5–18. doi: 10.1007/BF03166953. [DOI] [PMC free article] [PubMed] [Google Scholar]
- 10.Zhai Z, DeMeester GD, Morich MA, Shvartsman SM, Kleihorst RP. Numerical evaluation of B1-field and SAR for heterogeneous and homogeneous body model. Proceedings of the 12th Annual Meeting of ISMRM; Kyoto, Japan. 2004. (Abstract 666) [Google Scholar]
- 11.Nguyen UD, Brown JS, Chang IA, Krycia J, Mirotznik MS. Numerical evaluation of heating of human head due to magnetic resonance image. IEEE Trans Biomed Eng. 2004;51:1301–1309. doi: 10.1109/TBME.2004.827559. [DOI] [PubMed] [Google Scholar]
- 12.Hand JW, Lagendijk JJW, Hajnal JV, Lau RW, Young IR. SAR and temperature changes in the leg due to an RF decoupling coil at frequencies between 64 and 213 MHz. J Magn Reson Imaging. 2000;12:68–74. doi: 10.1002/1522-2586(200007)12:1<68::aid-jmri7>3.0.co;2-2. [DOI] [PubMed] [Google Scholar]
- 13.Hand JH, Lau RW, Lagendijk JJW, Ling J, Burl M, Young IR. Electromagnetic and thermal modeling of SAR and temperature fields in tissue due to an RF decoupling coil. J Magn Reson Imaging. 1999;42:183–192. doi: 10.1002/(sici)1522-2594(199907)42:1<183::aid-mrm24>3.0.co;2-i. [DOI] [PubMed] [Google Scholar]
- 14.Bridges JF. Cavity resonator with improved magnetic field uniformity for high frequency operation and reduced dielectric heating in NMR imaging devices. 4 751 464 U.S. patent. 1988
- 15.Vaughan JT, Hetherington HP, Out JO, Pan JW, Pohost GM. High frequency volume coils for clinical nuclear magnetic resonance imaging and spectroscopy. Magn Reson Med. 1994;32:206–218. doi: 10.1002/mrm.1910320209. [DOI] [PubMed] [Google Scholar]
- 16.Taflove A, Hagness SC. Computation electrodynamics—the finite-difference time-domain method. 2nd ed Artech House; Boston: 2000. [Google Scholar]
- 17.Wang Z. Ph.D. dissertation. University of Illinois at Chicago; Chicago, IL: 2005. MRI RF coil model design and numerical evaluation using the finite difference time domain method. [Google Scholar]
- 18.Alecci M, Collins CM, Smith MB, Jezzard P. Radio frequency magnetic field mapping of a 3 Tesla birdcage coil: experimental and theoretical dependence on sample properties. Magn Reson Med. 2001;46:379–385. doi: 10.1002/mrm.1201. [DOI] [PubMed] [Google Scholar]
- 19.Adriany G, Van de Moortele PF, Wiesinger F, et al. Transmit and receive transmission line arrays for 7 Tesla parallel imaging. Magn Reson Med. 2005;53:434–45. doi: 10.1002/mrm.20321. [DOI] [PubMed] [Google Scholar]
- 20.Caputa K, Okeniewski M, Stuchly MA. An algorithm for computations of the power deposition in human tissue. IEEE Antennas Propag Mag. 1999;41:102–107. [Google Scholar]
- 21.Wang J, Fujiwara O. FDTD computation of temperature rise in the human head for portable telephones. IEEE Trans Microw Theory. 1999;47:1528–1534. [Google Scholar]
- 22.Delp MD, Evans MV, Duan C. Effects of aging on cardiac output, regional blood flow, and body composition in Fischer-344 rats. J Appl Physiol. 1998;85:1813–1822. doi: 10.1152/jappl.1998.85.5.1813. [DOI] [PubMed] [Google Scholar]
- 23.Bernardi P, Cavagnaro M, Pisa S, Piuzzi E. Specific absorption rate and temperature elevation in a subject exposed in the far-field of radio-frequency sources operating in the 10-900MHz range. IEEE Trans Biomed Eng. 2003;50:295–303. doi: 10.1109/TBME.2003.808809. [DOI] [PubMed] [Google Scholar]
- 24.Wainwright P. Thermal effects of radiation from cellular telephones. Phys Med Biol. 2000;45:2363–2372. doi: 10.1088/0031-9155/45/8/321. [DOI] [PubMed] [Google Scholar]
- 25.Duck FA. Physical properties of tissue: a comprehensive reference book. Academic Press; London: 1990. [Google Scholar]
- 26.Angelone LM, Tulloch S, Wiggins G, Iwaki S, Makris N, Bonmassar G. New high resolution head model for accurate electromagnetic field computation. Proceedings of the 13th Annual Meeting of ISMRM; Miami Beach, FL, USA. 2005. (Abstract 881) [Google Scholar]
- 27.Wang Z, Collins CM, Smith MB. Toward understanding SAR patterns in the human head at high field (200 to 400 MHz) MRI with volume coils. Proceedings of the 14th Annual Meeting of ISMRM; Seattle, WA, USA. 2006. (Abstract 1390) [Google Scholar]
- 28.den Boer J, Atalar E, Szimtenings M, Kleihorstd R, Engels HA. Possible alternative basis for RF exposure limits in MR patients?. Proceedings of the ISMRM Safety Workshop; Washington, DC, USA. 2005. [Google Scholar]
- 29.Yeung CJ, Atalar EA. Green’s function approach to local RF heating in interventional MRI. J Magn Reson Imaging. 2000;12:86–91. doi: 10.1118/1.1367860. [DOI] [PubMed] [Google Scholar]
- 30.Dewhirst MW, Viglianti BL, Lora-Michiels M, Hanson M, Hoopes PJ. Basic principles of thermal dosimetry and thermal thresholds for tissue damage from hyperthermia. Int J Hyperthermia. 2003;19:267–294. doi: 10.1080/0265673031000119006. [DOI] [PubMed] [Google Scholar]
- 31.Van Leeuwen GM, Hand JW, Lagendijk JJ, Azzopardi DV, Edwards AD. Numerical modeling of temperature distributions within the neonatal head. Pediatr Res. 2000;48:351–356. doi: 10.1203/00006450-200009000-00015. [DOI] [PubMed] [Google Scholar]
- 32.Craciunescu OI, Raaymakers BW, Kotte AN, Das SK, Samulski TV, Lagendijk JJ. Discretizing large traceable vessels and using DEMRI perfusion maps yields numerical temperature contours that match the MR noninvasive measurements. Med Physics. 2001;28:2289–2296. doi: 10.1118/1.1408619. [DOI] [PubMed] [Google Scholar]