Abstract
Connexin43 (Cx43), the main gap junction channel-forming protein in astrocytes, is downregulated in malignant gliomas. These tumors are composed of a heterogeneous population of cells that include many with stem-cell-like properties, called glioma stem cells (GSCs), which are highly tumorigenic and lack Cx43 expression. Interestingly, restoring Cx43 reverses GSC phenotype and consequently reduces their tumorigenicity. In this study, we investigated the mechanism by which Cx43 exerts its antitumorigenic effects on GSCs. We have focused on the tyrosine kinase c-Src, which interacts with the intracellular carboxy tail of Cx43. We found that Cx43 regulates c-Src activity and proliferation in human GSCs expanded in adherent culture. Thus, restoring Cx43 in GSCs inhibited c-Src activity, which in turn promoted the downregulation of the inhibitor of differentiation Id1. Id1 sustains stem cell phenotype as it controls the expression of Sox2, responsible for stem cell self-renewal, and promotes cadherin switching, which has been associated to epithelial–mesenchymal transition. Our results show that both the ectopic expression of Cx43 and the inhibition of c-Src reduced Id1, Sox2 expression and promoted the switch from N- to E-cadherin, suggesting that Cx43, by inhibiting c-Src, downregulates Id1 with the subsequent changes in stem cell phenotype. On the basis of this mechanism, we found that a cell-penetrating peptide, containing the region of Cx43 that interacts with c-Src, mimics the effect of Cx43 on GSC phenotype, confirming the relevance of the interaction between Cx43 and c-Src in the regulation of the malignant phenotype and pinpointing this interaction as a promising therapeutic target.
Keywords: brain, gap junctions, glia, Sox2/Id1/cadherin
Connexin43 (Cx43), the most abundant connexin in mammals, is an integral membrane protein widely expressed in different tissues. In the central nervous system, Cx43 is strongly expressed in astrocytes where it exerts a variety of important biological functions. Cx43 assembles to form gap junction channels and hemichannels that facilitate the behavior of astrocytes as cellular networks,1,2 and the interchange of molecules between the cells and their extracellular medium.3 In addition, since it was first identified,4 the role of Cx43 and gap junctions in regulating malignant phenotype has been widely studied, although there are still several aspects of this process that remain elusive.5, 6 In gliomas, the most common neoplasia of the central nervous system, the expression of Cx43 is often reduced7, 8, 9, 10 and restoring Cx43 to these cells reduces their rate of proliferation.11, 12 Patients diagnosed with a glioblastoma multiforme, the most aggressive form of glioma, have a median survival of 1–2 years13 because of the infiltrative nature of these tumors that facilitates recurrence after surgery and standard therapy. These tumors are composed of a heterogeneous population of cells that include many with stem-cell-like properties, called glioma-initiating cells or glioma stem cells (GSCs). GSCs are characterized by their self-renewal capacity, their multilineage differentiation properties, their high oncogenic potential and their resistance to standard therapies.14 There is an intense scientific debate on GSCs in gliomagenesis,15, 16 which suggests that GSC phenotype is dynamic and therefore the reversion of GSC phenotype appears as a promising therapeutic strategy. Interestingly, it has been recently shown that restoring Cx43 reverses GSC phenotype and consequently reduces their tumorigenicity.17 Despite the relevance of this function, the mechanism by which Cx43 exerts this effect has not been shown until now.
The intracellular carboxy tail of Cx43 interacts with a large number of signaling and scaffolding proteins,18, 19 thereby regulating cell functions such as cell adhesion, migration and proliferation.20, 21, 22, 23 One of these interacting proteins is the non-receptor tyrosine kinase c-Src,24 which participates in the stem cell phenotype.25, 26 We have recently shown that the interaction between Cx43 and c-Src promotes a reduction in the oncogenic activity of c-Src in rat C6 glioma cells.27 In this study, we investigated whether the reversion of GSC phenotype promoted by Cx43 is triggered by the interaction between Cx43 and c-Src. On the basis of this mechanism, we designed three cell-penetrating peptides and analyzed their ability to mimic the effect of Cx43 on GSC phenotype.
Results
Expression of Cx43 and activity of c-Src in GSCs
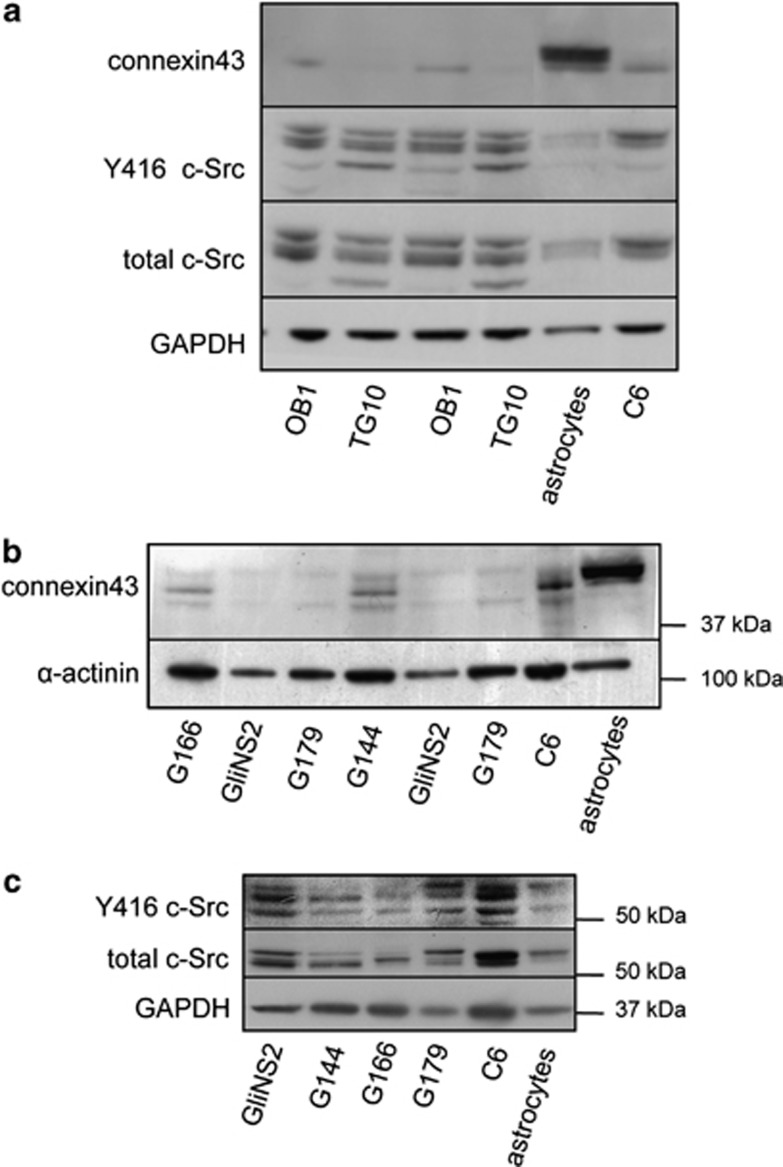
It has been previously shown that GSCs obtained from patient glioma specimens or from the glioma cell line U87 express low levels of Cx43.17 In this study, we confirmed the low expression of Cx43 in GSCs obtained from glioblastoma patients, termed OB1 and TG10,28 as compared with rat astrocytes or even to rat C6 glioma cells (Figure 1a). Gliomas, like many other tumors, exhibit a high oncogenic activity of c-Src.29 We analyzed c-Src activity in OB1 and TG10 by measuring the levels of c-Src phosphorylated at Tyr-416 (Y416 c-Src), the active form of this tyrosine kinase.30, 31 The level of activated c-Src was higher in OB1 and TG10 GSCs than that found in rat astrocytes and similar to that found in rat C6 glioma cells (Figure 1a). Recently, GSCs obtained from glioblastoma patients (GliNS2, G179, G166, G144) have been expanded in adherent culture, characterized and deposited in a cell repository.32 We took advantage of the purity and stability of these cells in culture, which can be genetically manipulated to study the role of Cx43 on GSC biology. Figure 1b shows that the levels of Cx43 were lower in the four GSC lines tested (GliNS2, G179, G166, G144) than those found in the rat C6 glioma cell line or in rat astrocytes obtained from primary culture. Although with different profiles, all of them expressed c-Src, which in GliNS2 and G179 cells is mostly phosphorylated on Tyr 416, that is, in the active conformation (Figure 1c). It should be noted that GliNS2 and G179 cells expressed lower levels of Cx43 than G166 or G144 cells. Consequently, to investigate the role of Cx43 on GSCs, GliNS2 cells were used for the gain-of-function experiments, whereas G166 were used for the loss-of-function experiments.
Figure 1.
Cx43 expression and c-Src activity in GSCs. (a) Western blot analysis of Cx43, Y416 c-Src and total c-Src in OB1 and TG10 GSCs.58 (b) Western blot analysis of Cx43 expressed by G166, GliNS2, G179 and G144 GSCs characterized in Pollard et al.32 (c) Western blot analysis of Y416 c-Src and total c-Src G166, GliNS2, G179 and G144 cells. Rat C6 glioma cell line and rat astrocytes from primary culture were used as controls
Effect of Cx43 on c-Src activity in GSCs
We have previously shown that restoring Cx43 expression in rat C6 glioma cells reduces the activity of c-Src,27 whereas silencing Cx43 in cultured astrocytes increases c-Src activity.33 In this study, we investigated whether Cx43 also regulates c-Src activity in GSCs. To this end, gain- and loss-of-function experiments for Cx43 were carried out and c-Src activity was analyzed.
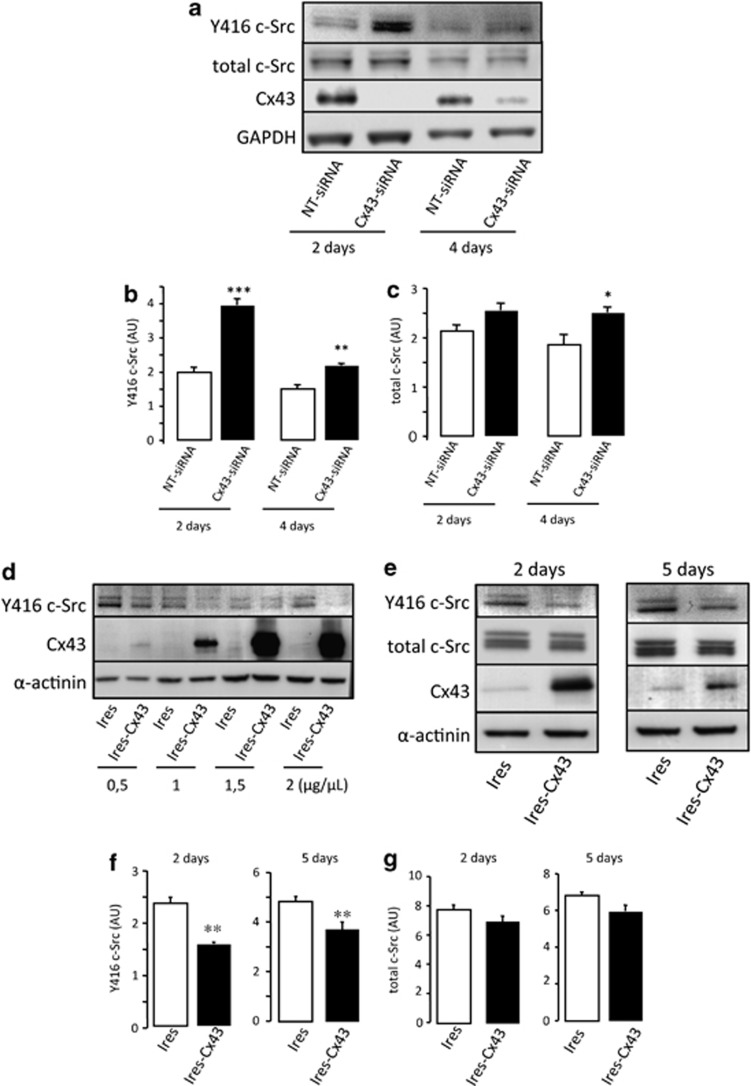
As G166 cells express a certain level of Cx43, they were used in loss-of-function experiments (Figure 1b). To knockdown Cx43, these cells were transfected with a specific siRNA for Cx43 (Cx43-siRNA) or a non-target siRNA (NT-siRNA) used as control. As soon as 2 days after transfection with 50 nM Cx43-siRNA, the levels of Cx43 were strongly reduced in G166 cells (Figure 2a). This effect was maintained to a lesser extent 4 days after transfection. Concomitantly, the levels of Y416 c-Src were increased by about 100% and 40% after 2 and 4 days, respectively (Figures 2a and b). The total amount of c-Src was slightly increased (by about 30%) 4 days after transfection (Figures 2a and c).
Figure 2.
Effect of Cx43 on c-Src activity. (a–c) G166 cells were transfected with 50 nM NT-siRNA or Cx43-siRNA. (a) Western blot analysis of Y416 c-Src, total c-Src, Cx43 and GAPDH 2 or 4 days after transfection. (b) Y416 c-Src and (c) total c-Src quantification. ***P<0.001, **P<0.01, *P<0.05 versus the corresponding NT-siRNA. (d–g) GliNS2 cells were transfected with the empty vector (Ires) or with the vector containing the Cx43 cDNA (Ires-Cx43). (d) Levels of Y416 c-Src, Cx43 and α-actinin detected by western blot analysis after transfection with increasing plasmid concentrations. (e) Time course of Y416 c-Src, total c-Src, Cx43 and GAPDH after transfecting cells with 1 μg/μl Ires or Ires-Cx43. (f) Y416 c-Src and (g) total c-Src quantification after transfecting cells with 1 μg/μl Ires or Ires-Cx43 for 2 or 5 days. **P<0.01 versus Ires
GliNS2 cells were used in gain-of-function experiments because of the lack of Cx43 expression. Thus, these cells were transfected with increasing concentrations of the construct containing Cx43 (Ires-Cx43) or with the empty vector (Ires). Figure 2d shows that the increase in Cx43 expression promoted a decrease in the levels of Y416 c-Src, even at the lowest concentration of Ires-Cx43, 2 days after transfection. Indeed, the levels of Y416 c-Src decreased by about 35% and 25%, 2 and 5 days after the transfection of 1 μg/μl Ires-Cx43, respectively (Figures 2e and f). The total amount of c-Src was not significantly modified by the expression of Cx43 (Figures 2e and g).
Effect of Cx43 on GSC proliferation
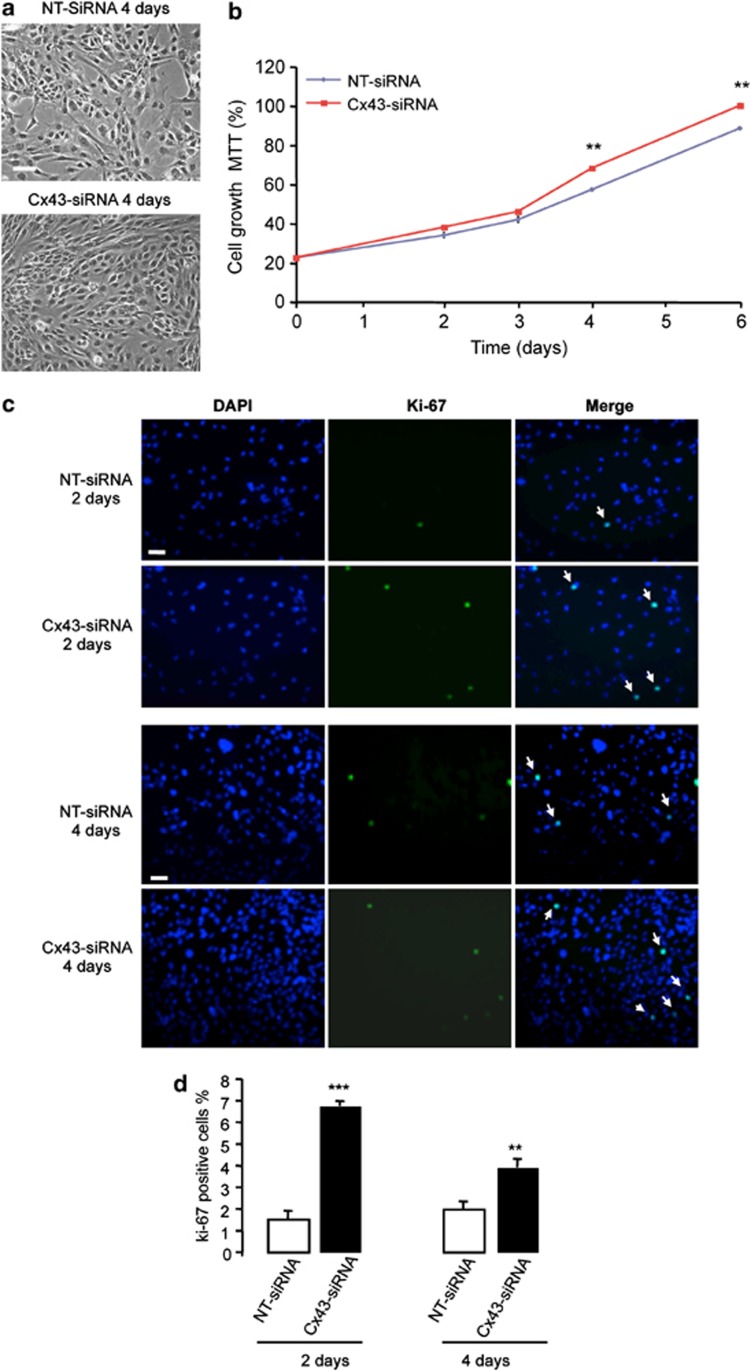
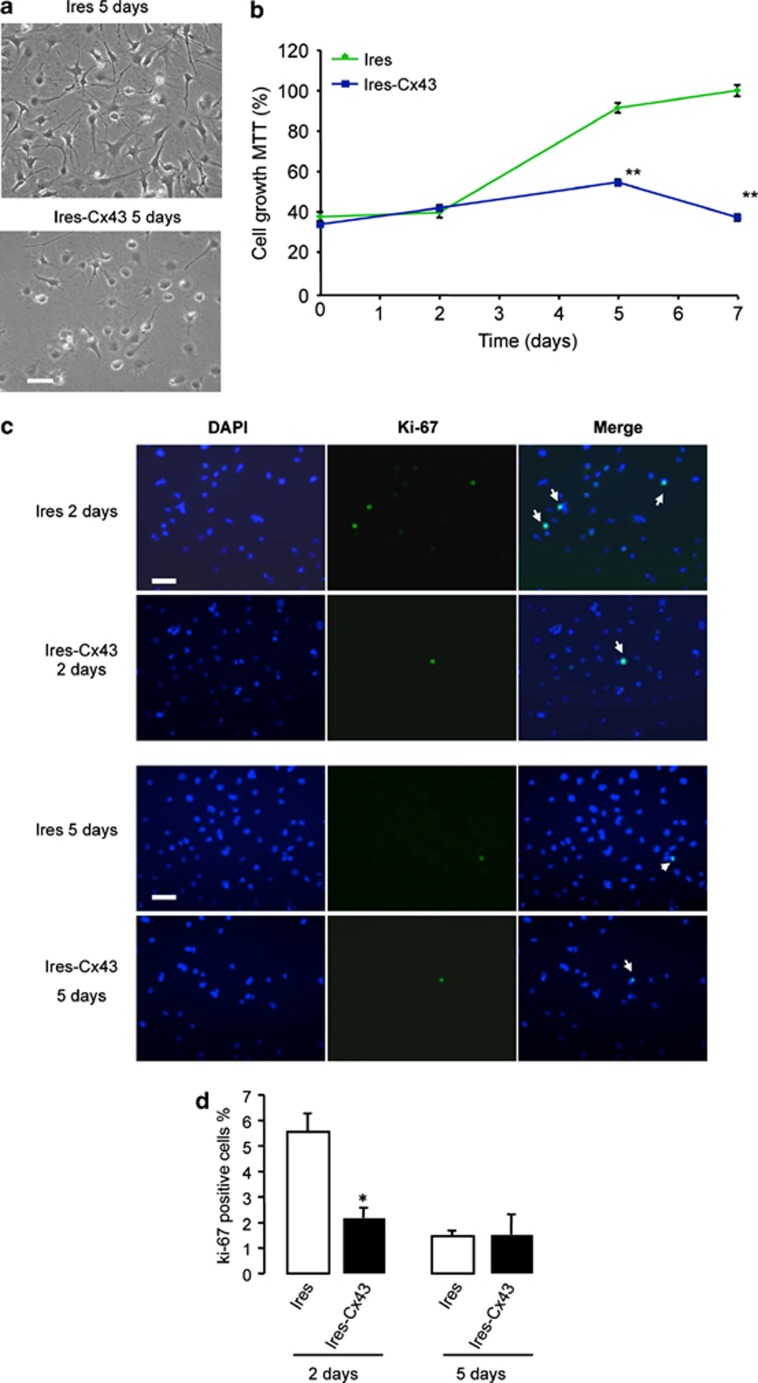
Next, we analyzed the effect of modulating Cx43 expression on the rate of GSC proliferation. As shown in Figure 3a, the density of G166 cells transfected with Cx43-siRNA was higher than that found in G166 cells transfected with NT-siRNA (Figure 3a). This observation was confirmed by analyzing the rate of growth by MTT (Figure 3b). To find out whether the increase in the number of cells was due to an increased proliferation, the expression of the proliferation marker Ki-67 was analyzed (Figure 3c). Our results show that the percentage of Ki-67-positive cells strongly increased 2 days after transfection with Cx43-siRNA and, to a lesser extent, 4 days after transfection (Figure 3d). Moreover, restoring Cx43 in GliNS2 cells produced the opposite effects (Figure 4). Thus, transfecting GliNS2 with Cx43 reduced the rate of cell growth as judged by phase-contrast images (Figure 4a) and MTT assay (Figure 4b). This reduction was due to a decrease in the rate of proliferation, as the percentage of Ki-67-positive cells strongly decreased 2 days after the transfection with Cx43 (Figures 4c and d).
Figure 3.
Effect of silencing Cx43 on G166 cell proliferation. G166 cells were transfected with 50 nM NT-siRNA or Cx43-siRNA. (a) Phase-contrast photomicrographs showing the increase in cell density 4 days after the transfection with Cx43-siRNA. (b) The number of living cells was followed for 6 days by MTT assay. The results are expressed as the percentages of the higher value of absorbance found (Cx43-siRNA, 6th day). **P<0.01 versus the corresponding NT-siRNA. (c) DAPI, Ki-67 and merged photomicrographs of the same field showing Ki-67-positive cells (arrow) after 2 or 4 days. Scale bar=20 μm (d) Percentage of Ki-67-positive cells. ***P<0.001, **P<0.01 versus the corresponding NT-siRNA
Figure 4.
Effect of restoring Cx43 on GliNS2 cell proliferation. GliNS2 cells were transfected with 1 μg/μl of the empty vector (Ires) or with the vector containing the Cx43 cDNA (Ires-Cx43). (a) Phase-contrast photomicrographs showing the reduction on cell density 5 days after the transfection with Ires-Cx43. (b) The number of living cells was followed for 7 days by MTT assay. The results are expressed as the percentages of the higher value of absorbance found (Ires, 7th day). **P<0.01 versus the corresponding Ires. (c) DAPI, Ki-67 and merged photomicrographs of the same field showing Ki-67-positive cells (arrow) after 2 or 5 days. Scale bar=20 μm. (d) Percentage of Ki-67-positive cells. *P<0.05 versus the corresponding Ires
Effect of Cx43 expression on Sox2, E-cadherin, N-cadherin and Id1 expression
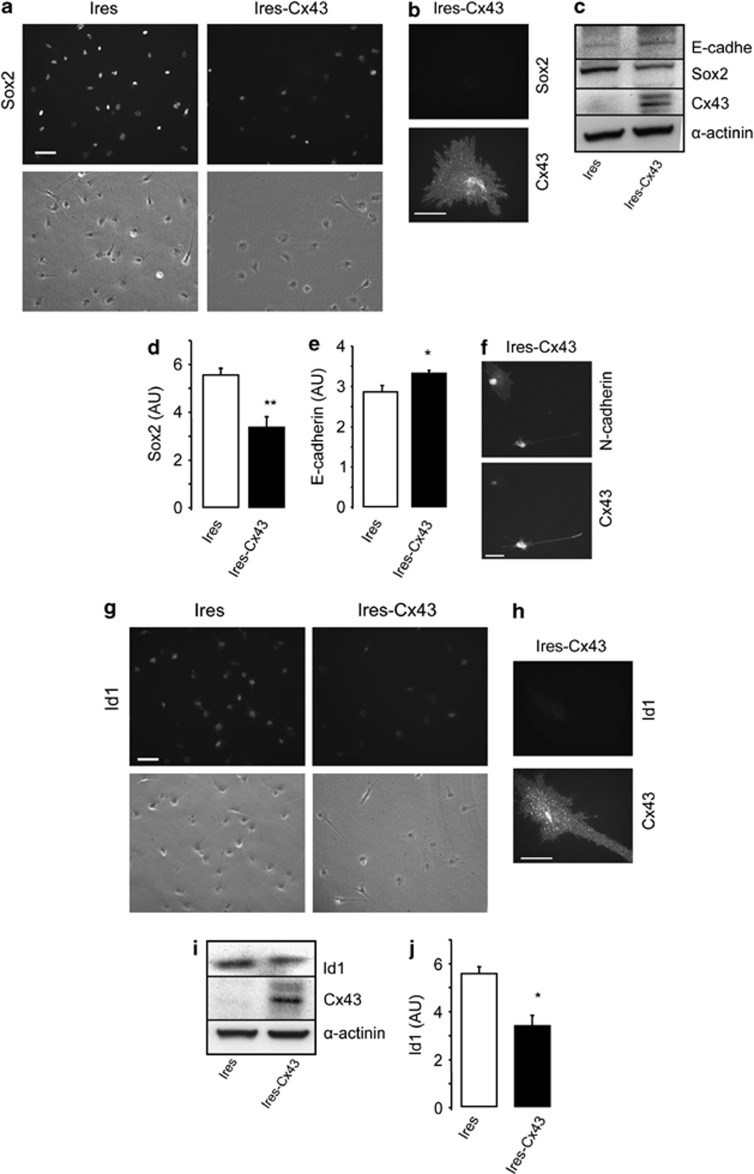
Recent evidence suggests that GSC phenotype can be reversed. Interestingly, Yu et al.17 have shown that transfecting Cx43 into GSCs reduced the expression of stemness markers, such as Sox2 and upregulated the expression of E-cadherin. Our results confirm that restoring Cx43 reduces the expression of Sox2 and upregulates E-cadherin in GliNS2 cells, even in the absence of serum that could help stem cell differentiation. The immunocytochemistry revealed that the levels of Sox2 decreased in most cells (Figure 5a); Sox2 was particularly downregulated in cells containing high levels of Cx43 (Figure 5b). Western blot analysis confirmed the reduction of Sox2 (by about 40%) and the upregulation of E-cadherin (by about 20%) expression by restoring Cx43 in GSCs (Figures 5c–e). Interestingly, we found a downregulation of N-cadherin in cells expressing Cx43 (Figure 5f and Supplementary Figure 1), suggesting that Cx43 promoted cadherin switching in GSCs.34
Figure 5.
Effect of restoring Cx43 on Sox2, E-cadherin, N-cadherin and Id1 expression in GSC. GliNS2 cells were transfected with the empty vector (Ires) or with the vector containing the Cx43 cDNA (Ires-Cx43). (a) Immunostaining and phase contrast from the same field showing the decrease in Sox2 expression in Cx43-transfected GSCs. Scale bar=20 μm. (b) Double immunostaining showing the lack of Sox2 in Cx43-expressing cells. Scale bar=10 μm. (c) Western blot analysis for Cx43, Sox2, E-cadherin and α-actinin as a loading control. (d) Sox2 and (e) E-cadherin quantification. **P<0.01, *P<0.05 versus the corresponding Ires. (f) Double immunostaining showing the downregulation of N-cadherin in Cx43-expressing cells. Scale bar=10 μm. (g) Immunostaining and phase contrast from the same field showing the decrease in Id1 expression in Cx43-transfected GSC. Scale bar=20 μm. (h) Double immunostaining showing the lack of Id1 in Cx43-expressing cells. Scale bar=10 μm. (i) Western blot analysis for Cx43 and Id1. (j) Id1 quantification. *P<0.05 versus the corresponding Ires
Sox2 expression35 and the switch from N- to E-cadherin36 have been reported to be regulated by the inhibitor of differentiation Id1. Therefore, we analyzed the levels of Id1 under our experimental conditions. So far, the relationship between Cx43 and Id1 has not yet been studied. Interestingly, our results revealed that restoring Cx43 reduced the levels of Id1 in GliNS2 cells when analyzed by immunocytochemistry (Figures 5g and h). Western blot analysis confirmed these results, as the transfection of Cx43 reduced Id1 expression by about 30% (Figures 5i and j).
Participation of c-Src in the effect of Cx43 on GSC phenotype
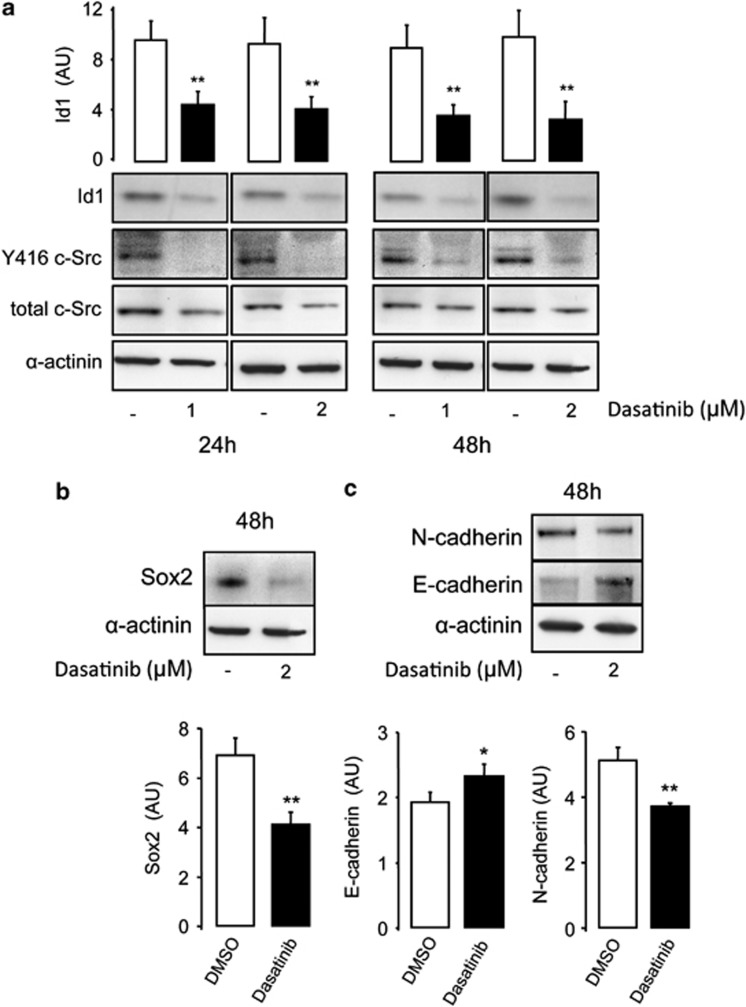
As restoring Cx43 decreased c-Src activity, Id1 and Sox2 expression and switched cadherin expression, we analyzed the effect of c-Src inhibition on these proteins to address the possible participation of c-Src on the effect of Cx43 on GSC phenotype. Our results show that the inhibition of c-Src activity promoted by dasatinib strongly decreased Id1 expression (Figure 6a). Other inhibitors of c-Src, such as saracatinib or PP2, exerted similar effects on Id1 expression (Supplementary Figure 2). Furthermore, the inhibition of c-Src decreased Sox2 (Figure 6b) and N-cadherin expression while increasing E-cadherin expression (Figure 6c), suggesting that the inhibition of c-Src promoted by the interaction with Cx43 could be triggering the effect on GSC phenotype.
Figure 6.
Participation of c-Src in the reversion of GSC phenotype. GliNS2 cells were incubated with dasatinib with the indicated concentrations for 24 or 48 h. (a) Western blot analysis and quantification for Id1; western blot analysis for Y416 c-Src and total c-Src showing the inhibition of c-Src activity promoted by dasatinib. (b) Western blot analysis and quantification for Sox2. (c) Western blot analysis and quantification for E-cadherin and N-cadherin. *P<0.05; **P<0.01 versus control
Effect of cell-penetrating peptides based on Cx43–c-Src interaction on GSC phenotype
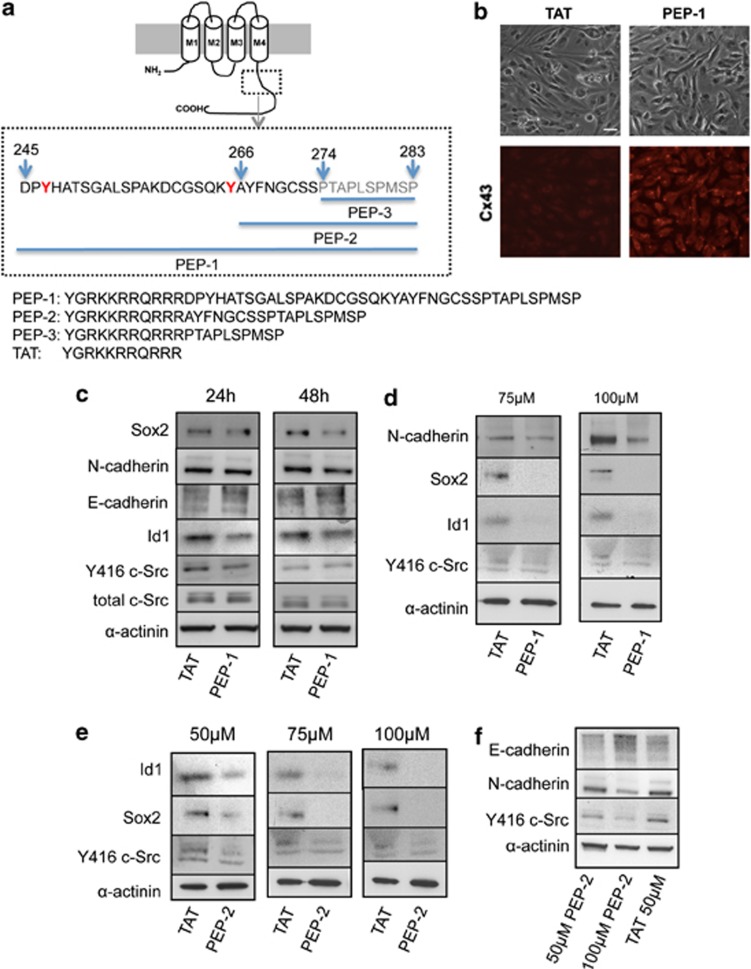
As our proposal is that Cx43 acts on GSC phenotype through its interaction with c-Src and as the structural basis of this interaction is known,24, 37 we designed three cell-penetrating peptides based on the region of Cx43 that interacts with c-Src. First, the sequence from the C-terminal domain of Cx43 containing the Src SH3-binding domain and the tyrosines phosphorylated by c-Src (from amino acids 245 to 283 in Cx43)24, 37 was fused to the TAT penetrating sequence (YGRKKRRQRRR)38 (Figure 7a). GliNS2 cells were incubated with increasing concentrations of this peptide (50–100μM), termed PEP-1, or with the TAT-penetrating sequence, used as control, for 24 or 48 h. The immunocytochemistry for Cx43 confirmed the efficient internalization of 50 μM PEP-1 into GSCs (Figure 7b). Our results revealed that 50 μM PEP-1 transiently decreased c-Src activity in GSCs, as Y416 c-Src decreased after 24 h and the levels were recovered after 48 h, while the total amount of c-Src was not modified (Figure 7c). Moreover, our results show that PEP-1 decreased Id1, N-cadherin (only after 48 h) and Sox2 expression and upregulated E-cadherin expression when compared with TAT peptide (Figure 7c). Higher concentrations of PEP-1 (75 and 100 μM) strongly decreased Y416 c-Src, Id1, Sox2 and even N-cadherin after 24 h (Figure 7d).
Figure 7.
Effect of peptides based on Cx43 on GSC phenotype. (a) Sequence of the cell-penetrating peptides based on c-Src–Cx43 interaction containing the TAT sequence fused at the N terminus. PEP-1: the c-Src binding domain and the tyrosines (in red) phosphorylated by c-Src (245–283); PEP-2: the residues affected by the binding of the Src SH3 domain (266–283) and PEP-3: the consensus SH3 binding site (274–283). (b) GliNS2 cells were incubated with 50 μM TAT or 50 μM PEP-1 for 24 h. Immunostaining of Cx43 and phase contrast from the same field showing the internalization of PEP-1 into GSC. Scale bar=20 μm. (c) GliNS2 cells were incubated with 50 μM TAT or 50 μM PEP-1 for 24 or 48 h. Western blot analysis for total c-Src, Y416 c-Src, Id1, E-cadherin, N-cadherin and Sox2. (d) GliNS2 cells were incubated with TAT or PEP-1 at different concentrations (75 or 100 μM) for 24 h. Western blot analysis for Y416 c-Src, Id1, Sox2 and N-cadherin. (e) GliNS2 cells were incubated with TAT or PEP-2 at different concentrations (50, 75 or 100 μM) for 24 h. Western blot analysis for Y416 c-Src, Id1 and Sox2. (f) GliNS2 cells were incubated with TAT 50 μM or PEP-2 (50 or 100 μM) for 24 h. Western blot analysis for Y416 c-Src, E-cadherin and N-cadherin
Next, we delimit the region to the Cx43 residues affected by the binding of the Src SH3 domain (from amino acids 266 to 283 in Cx43),24 without the tyrosines phosphorylated by c-Src, and we fused it to the TAT-penetrating sequence (Figure 7a). GliNS2 cells were incubated with increasing concentrations of this peptide (50–100 μM), termed PEP-2, or with TAT for 24 h. Our results revealed that PEP-2 decreased c-Src activity and Sox2 and Id1 expression in a dose-dependent manner (Figure 7e). In addition, the effect of PEP-2 on Src activity, Sox2 and Id1 was not significantly different from that of PEP-1 (Supplementary Figure 3). It should be mentioned that, even at 100 μM, TAT did not show any effect on c-Src activity, Sox2 or Id1 expression (Supplementary Figure 4). Although the effect on cadherin switching is not evident at 50 μM PEP-2, 100 μM PEP-2 promoted a clear switch from N- to E-cadherin (Figure 7f). Finally, we tested the effect of the cell-penetrating peptide containing only the consensus SH3 binding site (from amino acid 274 to 283 in Cx43) fused to the TAT-penetrating sequence, termed PEP-3 (Figure 7a). Our results show that PEP-3 did not affect GSC phenotype, as judged by c-Src activity and Sox2 and Id1 expression when compared with TAT (Supplementary Figure 3).
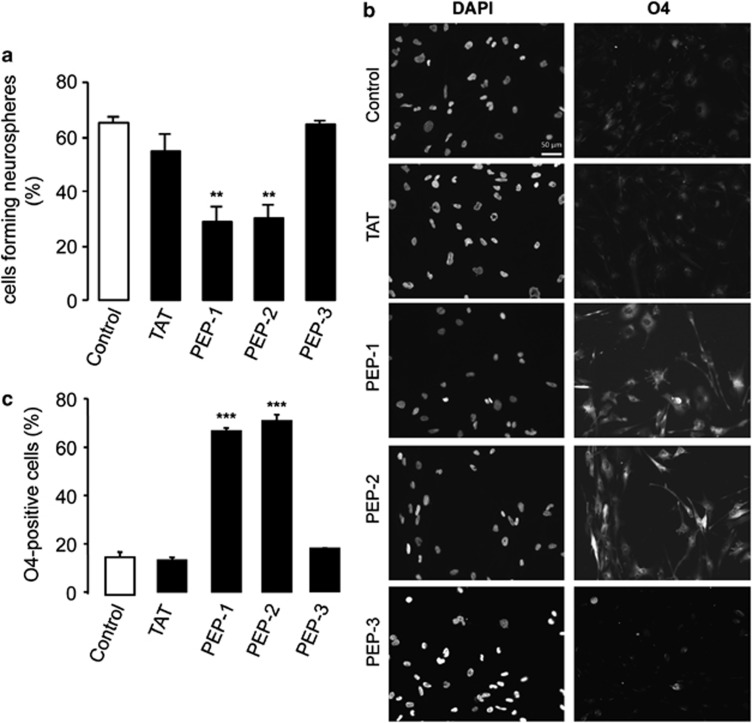
As reported by Yu et al.,17 restoring Cx43 to GSCs reduced their ability to generate neurospheres. Similarly, our results revealed that PEP-1 and PEP-2 reduced the ability of GliNS2 to generate neurospheres when compared with the control or TAT. However, PEP-3 did not modify the percentage of neurospheres formed from GSCs (Figure 8a). It has been reported that GliNS2 cells express oligodendrocyte differentiation markers, such as O4, upon differentiation.32 Interestingly, the presence of PEP-1 and PEP-2, but not PEP-3, promoted an increase in the percentage of cells expressing this oligodendrocyte differentiation marker, as compared with the controls (Figures 8b and c).
Figure 8.
Effect of peptides based on Cx43 on GSC clonogenicity and differentiation. (a) GliNS2 cells were seeded at a density of 1 or 2 cells per well into 96-well plates and incubated with 50 μM TAT, PEP-1, PEP-2 or PEP-3. After 4 weeks, the percentage of cells forming neurospheres was determined. **P<0.01 versus the control. (b) GliNS2 cells were incubated with 25 μM TAT, PEP-1, PEP-2 or PEP-3 for 96 h. DAPI and O4 immunostaining of the same field showing O4-positive cells after PEP-1 or PEP-2 treatment. Scale bar=50 μm. (c) Percentage of O4-positive cells. ***P<0.001 versus control
Discussion
As has been reported previously,17 our study confirms that GSCs express very low levels of the gap junction protein Cx43. Interestingly, the ectopic expression of Cx43 in GSCs strongly reduces the tumorigenic properties of these cells.17 Consequently, the size of the tumors generated by Cx43-transfected GSCs was smaller and these animals showed prolonged survival.17 However, little is known about the mechanism underlying this important effect of Cx43 on GSCs. We had previously found that Cx43 decreased the oncogenic activity of c-Src in rat glioma C6 cells;27 therefore, in this study we investigated whether c-Src was involved in the antitumorigenic effect exerted by Cx43 on GSCs.
Our results show that changes in the levels of Cx43 are accompanied by changes in the oncogenic activity of c-Src in GSCs. Indeed, silencing Cx43 increased c-Src activity and augmented the rate of GSC proliferation, whereas the transfection with Cx43 decreased c-Src activity and GSC proliferation. Src activity has been tightly linked to stem cell self-renewal,25, 26 suggesting that Cx43 could regulate GSC proliferation through c-Src activity. Furthermore, c-Src activity has been associated with resistance to anticancer treatments.6, 18, 39 Therefore, the regulation of c-Src activity promoted by Cx43 may provide additional benefits in the field of glioma therapy.
The relevance of GSCs as a therapeutic target has been highlighted because their stemness phenotype can be reverted.15, 16 Interestingly, the results presented in this work and other studies17 show that restoring Cx43 in GSCs decreases the expression of Sox2, frequently used as a marker of stem cells. As Sox2 is a transcription factor responsible for stem cell self-renewal,26, 40 it could be suggested that the reduction in GSC proliferation caused by restoring Cx43 may be ultimately mediated by the downregulation of Sox2.
The expression of Sox2 is regulated by the inhibitor of differentiation Id1,35 which belongs to the family of Id transcriptional regulators. Id1 has a helix–loop–helix (HLH) domain that allows it to dimerize with bHLH transcription factors, but lacks a DNA-binding domain. As a result, Id1-bHLH transcription factor heterodimers cannot bind to DNA, leading to the disruption of the events mediating the cellular differentiation.41 Id1 is a promising therapeutic target because it is upregulated in high-grade gliomas35 and more specifically in GSCs.42 Intriguingly, our results show that restoring Cx43 to GSCs reduced the expression of Id1. This is a novel finding, as Cx43 has not been previously linked to this master regulator of genes required to maintain a stem-like phenotype. It should be mentioned that Id1 expression is regulated by c-Src activity.43 Indeed, our data show that dasatinib, an inhibitor of c-Src activity, reduced Id1 and Sox2 expression in GSCs. Therefore, it could be proposed that, by decreasing c-Src activity, Cx43 downregulates the expression of Id1 and consequently the expression of the transcription factor Sox2 (Figure 9).
Figure 9.
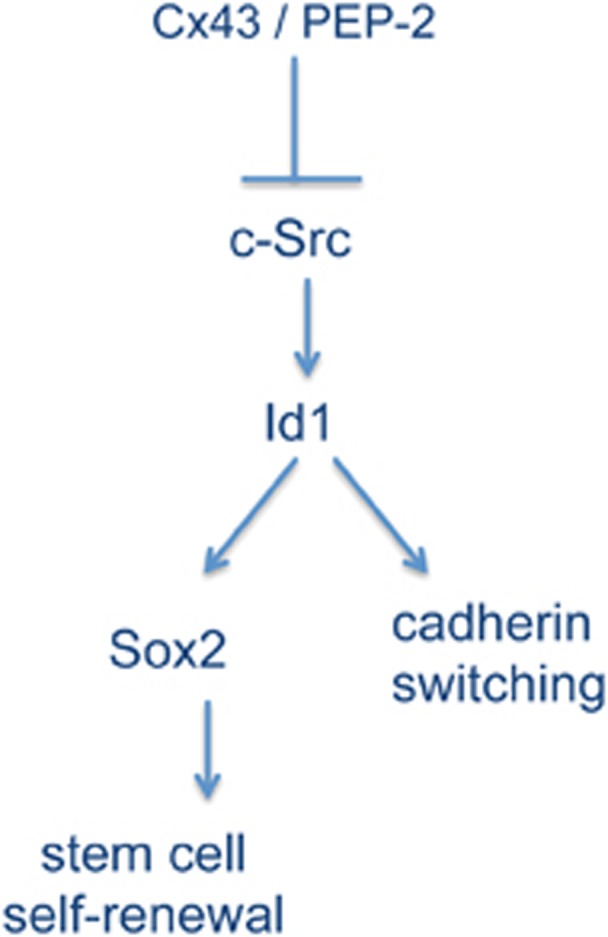
Proposed mechanism. Our results show that restoration of Cx43 or the sequence of Cx43 that contains the c-Src-binding domain inhibits c-Src activity in GSC, which in turn downregulates the expression of the inhibitor of differentiation Id1. As Id1 regulates Sox2 expression35 and cadherin switching,36 it could be proposed that this regulator of transcription is mediating the effect of Cx43 on Sox2 expression and cadherin switching. Downregulation of Sox2 reduces GSC self-renewal40 and cadherin switching.34 Consequently, we propose that Cx43 triggers this pathway to reverse GSC phenotype and consequently tumorigenicity
In addition to its role in stem cell self-renewal, the transcriptional regulator Id1 has a critical role in modulating the invasiveness of glioma cells. Id1 knockdown markedly reduces cell invasion that is accompanied by profound morphological changes and robust reduction in expression levels of mesenchymal markers.35 Thus, Id1 knockdown promotes a switch from N- to E-cadherin36 that has been related to the reduction of the mesenchymal phenotype.34, 44 Consistent with this, Yu et al.17 and the present study show that restoring Cx43 to GSCs increased the expression of E-cadherin. Furthermore, our results reveal that Cx43 promotes a switch from N- to E-cadherin that could be a consequence of the reduction in Id1 expression promoted by the inhibition of c-Src activity (Figure 9). In fact, our results show that in addition to its effect on Id1 expression, the inhibition of c-Src with dasatinib promoted the switch from N- to E-cadherin in GSCs. Therefore, we propose that the mechanism by which Cx43 reverses stem-like phenotype in GSCs is the inhibition of c-Src activity, which in turn reduces the expression of the transcriptional regulator Id1. As Id1 regulates Sox2 expression35 and promotes cadherin switching,36 it is not unexpected that restoring Cx43 reverses glioma stem-like phenotype and reduces the tumorigenic ability of GSCs17 (Figure 9).
On the basis of this mechanism and on the structural basis of the interaction between Cx43 and c-Src,24, 37 we have designed three cell-penetrating peptides containing different sequences of Cx43 related to c-Src. Our results show that the consensus SH3 binding site (PEP-3) was not sufficient to mimic the effect of Cx43 on GSCs. Instead, several residues upstream (PEP-2) are required to revert GSC phenotype. This is in agreement with previous studies showing that Src SH3 binding induces major structural changes in Cx43, which extend upstream in the C-terminal domain.24 Thus, PEP-2 reduced c-Src activity, downregulated Id1 expression and consequently reduced Sox2 expression and promoted cadherin switching. Consequently, the ability of GSCs to generate neurospheres decreased and the percentage of cells expressing differentiation markers increased, in a manner similar to Cx43.17 As expected, PEP-1 also reverted GSC phenotype, as it includes PEP-2 sequence. Taken together, these results stress the relevance of the interaction between Cx43 and c-Src for the regulation of the malignant phenotype, as has been previously reported for other important biological functions.45
Although restoring Cx43 reverts GSC phenotype,17 this tumor suppressor effect could be counterbalanced6 by its effects on invasiveness,46 adhesion47 and migration.48 The majority of studies show that Cx43 increases invasiveness;46, 49, 50, 51 however, other studies report the opposite, that is, a reduction of migration promoted by Cx43.52, 53, 54 In GSCs, the restoration of Cx43 has been shown to reduce invasiveness and silencing Cx43 exerts the opposite effect.17 These contradictory results could be explained by the differences in the cell type, as has been shown in some studies,55 or in the Cx43-interacting proteins. Indeed, the mechanism through which Cx43 affects cell migration has been shown to be related to the interaction of Cx43 with the cytoskeleton,55, 56, 57 and/or its ability to activate p38 MAP kinase.49 It could be speculated that the use of cell-penetrating peptides, like PEP-2, that acts specifically on c-Src and lacks cytoskeleton-binding domains, could overcome this problem. However, further research is required. Furthermore, the restoration of a protein in the entire GSC population is an unsolved problem; the therapeutic opportunities of a cell-penetrating peptide are higher when compared with those of the protein, in terms of internalization efficiency, specificity and solubility. Consequently, our findings could help to develop new drugs that target GSCs directly and accelerate the fight against this devastating disease.
Materials and Methods
Animals
Albino wistar rats, fed ad libitum on a stock laboratory diet (49.8% carbohydrates, 23.5% protein, 3.7% fat, 5.5% (wt/vol) minerals and added vitamins and amino acids), were used for the experiments. Rats were maintained on a 12-h light–dark cycle. Postnatal day 1 newborn rats were used to prepare astrocyte cultures. The animals were obtained from the animal facility of the University of Salamanca and their use for this study was approved by the bioethics committee of this institution.
Cell Cultures
GSC lines (G166, GliNS2, G144, G179) were obtained from BioRep, Milan, Italy.32 The cells were grown in RHB-A medium (StemCells, Cambridge, UK) supplemented with 1% N2, 2% B27 (Life Technologies, Madrid, Spain), 20 ng/ml EGF and 20 ng/ml b-FGF (PeproTech, London, UK), as described previously.32 Culture plates were coated with 10 μg/ml laminin (Life Technologies) for 2 h before use. The cells were maintained at 37 °C in an atmosphere of 95% air/5% CO2 and with 90–95% humidity.
OB1 and TG10 cells were cultured from tumor samples obtained from surgical resections carried out on patients at Sainte Anne Hospital (Paris, France). This study was approved by the Institutional Review Board and informed consent was obtained from all patients. The tumors were high-grade gliomas (glioblastoma), according to the WHO classification. Glioma stem-like cells were obtained as described previously.58 Briefly, tumor samples were dissociated to form a single-cell suspension, which was plated on serum-free DMEM/F12 supplemented with B27, heparin (Stem Cell Technologies, Grenoble, France) and human recombinant EGF and FGF-2 (Sigma, St. Louis, MO, USA), both at a final concentration of 20 ng/ml. Neurosphere cultures were then passaged every 11 days, by mechanical dissociation, to give a concentration of 50 000 cells per ml in fresh medium, in non-coated T25 or T75 flasks.
Astrocytes in primary culture were prepared from the forebrains of 1- to 2-day-old wistar rats and cultured in DMEM supplemented with 10% FCS as described previously.59 C6 glioma cells were cultured in DMEM supplemented with 10% FCS as described previously.27
Cell treatments
Cells were treated with dasatinib (1 or 2 μM; Selleck Chemicals, Munich, Germany), saracatinib (1 or 2 μM; Selleck Chemicals), PP2 (10 or 20 μM; Calbiochem) or vehicle (DMSO) for 24 or 48 h in culture medium at 37 °C in an atmosphere of 95% air/5% CO2 and with 90–95% humidity. The synthetic peptides (>90% pure) were obtained from GenScript (Piscataway, NJ, USA). YGRKKRRQRRR was used as the TAT sequence, which is responsible for cell penetration of the peptides.38 The sequence PEP-1 was TAT-DPYHATSGALSPAKDCGSQKYAYFNGCSSPTAPLSPMSP, the sequence PEP-2 was TAT-AYFNGCSSPTAPLSPMSP and the sequence for PEP-3 was TAT-PTAPLSPMSP. Peptides were used at different concentrations (25, 50, 75 or 100 μM) in culture medium at 37 °C for the indicated time.
Plasmid constructs and cell transfection
The pIres-Cx43 construct was generated by ligating a PCR-amplified fragment encoding the human Cx43 sequence (accession number: NM_000165) into the AgeI–BamHI sites of the bicistronic pIres-puro2 vector that encodes the puromycin resistance gene. The fragment encoding the human Cx43 sequence was obtained by RT-PCR performed on a template of total RNA isolated from GliNS2 cells using the following primers: 5′-TATATACCGGTATGGGTGACTGGAGCGCCTT-3′ and 5′-CGGGATCCCGCTAGATCTCCAGGTCATCAG-3′. GliNS2 glioma cells were transfected with the construct containing Cx43 (Ires-Cx43) or with the empty vector (Ires) by electroporation using Neon Transfection System (Life Technologies) according to the manufacturer's instructions. Transfected cells were selected with puromycin (0.1 μg/ml).
Transfection of siRNA
G166 cells were transfected with a validated NT-siRNA or with an siRNA specific for Cx43 (Cx43-siRNA). Cells were transfected with the double-strand siRNA (25 or 50 nM) complexed with 2.5 μl/ml Lipofectamine 2000 (Life Technologies) in culture medium without antibiotics. The sequences of the Cx43 siRNAs were as follows: sense, 5′-GCUGGUUACUGGUGACAGATT-3′ and antisense, 5′-UCUGUCACCAGUAACCAGCTT-3′. The cells were maintained in the presence of the oligonucleotides in culture medium without antibiotics for 6 h. The extent of siRNA-mediated downregulation of Cx43 expression was evaluated in western blot analysis.
Western blot analysis
Equivalent amounts of proteins (20 μg per lane) were separated on NuPAGE Novex Bis-Tris (4–12%) minigels (Life Technologies). According to their molecular size, proteins were transblotted using Iblot dry blotting system (Life Technologies). The membranes were cut into several strips to be immunoblotted with distinct antibodies, thus allowing for comparative analysis of the amount of each protein in the same sample. Membranes were then blocked for 1 h at room temperature in Tris-buffered saline containing 0.05% Tween (TTBS) and 7% non-fat milk powder before being incubated overnight at 4 °C with the primary antibodies against Cx43 (BD Transduction Laboratories, Madrid, Spain; 610062; 1 : 250), Y416-Src (Cell Signaling, Danvers, MA, USA; 2101; 1 : 250), total-Src (Cell Signaling; 2108 and 2110 1 : 500), Id1 (Santa Cruz Inc., Heidelberg, Germany; sc-488; 1 : 500), Sox2 (Abcam, Cambridge, UK; ab97959; 1 : 1000), E-cadherin (Santa Cruz; sc-7870; 1 : 100), N-cadherin (Santa Cruz; sc-7939; 1 : 500). Antibody against glyceraldehyde 3-phosphate dehydrogenase (GAPDH) (Applied Biosystems, Madrid, Spain; AM4300; 1 : 5000) or α-actinin (Millipore, Billerica, MA, USA; MAB1682; 1 : 1000) were used as a loading control. After extensive washing, membranes were incubated with HRP-conjugated anti-rabbit or anti-mouse antibodies in TTBS. Proteins were developed with a chemiluminiscent substrate. Densitometry analysis of the bands was performed using Image J program (Wayne Rasband; NIH, Bethesda, MD, USA). The amounts of GAPDH or α-actinin recovered in each sample served as loading control and the values for each protein were normalized to their corresponding GAPDH or α-actinin level.
Immunocytochemistry
Cells fixed with 4% (w/v) formaldehyde in phosphate-buffered saline for 20 min and then were blocked for 1 h at 4 °C. The cells were incubated overnight at 4 °C with primary antibodies. Specific dilutions of primary antibodies used are as follows: Cx43 (BD Transduction Laboratories; 610062; 1 : 200), Id1 (Santa Cruz; sc-488; 1 : 500), Sox2 (Abcam; ab97959; 1 : 500), Ki-67 (Sigma; P6834; 1 : 200), N-cadherin (Santa Cruz; sc-7939; 1 : 200) and O4 (1 : 2; Hybridoma Bank, Iowa City, IA, USA; kindly donated by Dr F de Castro). The cells were mounted using the Slowfade Gold Antifade Kit and they were analyzed on a Leica inverted fluorescence microscope connected to a digital video camera (Leica DC100; Leica microsystems, Wetzlar, Germany). For Ki-67 and O4 quantification, the nuclei were stained with 4′,6-diamidino-2-phenylindole (DAPI) (1.25 μg/ml) for 5 min and at least six photomicrographs were taken from each plate and the number of nuclei (DAPI staining) and Ki-67- or O4-positive cells were counted. The percentage of Ki-67- or O4-positive cells was calculated from the total number of cells (DAPI staining).
MTT assay
Cells cultured at 37 °C in 4-well plates were incubated in the dark for 75 min with 300 μl/ml of RHB-A medium containing 0.5 mg/ml MTT (Sigma). The medium was then removed and the cells were incubated for 10 min in the dark with dimethyl sulfoxide (250 μl per well) with mild shaking. Finally, the absorbance was measured at a wavelength of 570 nm using a microplate reader (Multiskan Ascent; Thermo Electron Corporation, Thermo Scientific, Madrid, Spain).
Clononogenic assay
Clonal properties were assessed as reported previously60 by seeding 1 or 2 GliNS2 cells per well into uncoated 96-well plates in RHB-A medium supplemented with 1% N2, 2% B27, 20 ng/ml EGF and 20 ng/ml b-FGF. After 4 weeks, the number of newly formed neurospheres was determined.
Statistical analyses
The results are the means±S.E.M. of at least three independent experiments. Statistical analyses were carried out with the Student's t-test. Values were considered significant when P<0.05.
Acknowledgments
This work was supported by the Ministerio de Economía y Competitividad, FEDER BFU2011-27602 (AT). E Gangoso (ref. AP2008-03515) was recipient of a fellowship from the Ministerio de Educación, Cultura y Deporte. We are grateful for the technical assistance of T del Rey and we thank Dr. M Morales for his help in peptide design, Dr. F de Castro for O4 antibody and Elizabeth Nestor for her linguistic assistance.
Glossary
- Cx43
connexin43
- GSC
glioma stem cells
- NT-siRNA
non-target siRNA
- Cx43-siRNA
siRNA against connexin43
- HLH
helix–loop–helix
- GAPDH
glyceraldehyde 3-phosphate dehydrogenase
- DAPI
4′,6-diamidino-2-phenylindole
The authors declare no conflict of interest.
Footnotes
Supplementary Information accompanies this paper on Cell Death and Disease website (http://www.nature.com/cddis)
Edited by Y Shi
Supplementary Material
References
- Giaume C, Koulakoff A, Roux L, Holcman D, Rouach N. Astroglial networks: a step further in neuroglial and gliovascular interactions. Nat Rev Neurosci. 2010;11:87–99. doi: 10.1038/nrn2757. [DOI] [PubMed] [Google Scholar]
- Rouach N, Koulakoff A, Abudara V, Willecke K, Giaume C. Astroglial metabolic networks sustain hippocampal synaptic transmission. Science. 2008;322:1551–1555. doi: 10.1126/science.1164022. [DOI] [PubMed] [Google Scholar]
- Bennett MV, Contreras JE, Bukauskas FF, Saez JC. New roles for astrocytes: gap junction hemichannels have something to communicate. Trends Neurosci. 2003;26:610–617. doi: 10.1016/j.tins.2003.09.008. [DOI] [PMC free article] [PubMed] [Google Scholar]
- Loewenstein WR, Kanno Y. Intercellular communication and the control of tissue growth: lack of communication between cancer cells. Nature. 1966;209:1248–1249. doi: 10.1038/2091248a0. [DOI] [PubMed] [Google Scholar]
- Naus CC, Laird DW. Implications and challenges of connexin connections to cancer. Nat Rev Cancer. 2010;10:435–441. doi: 10.1038/nrc2841. [DOI] [PubMed] [Google Scholar]
- Sin WC, Crespin S, Mesnil M. Opposing roles of connexin43 in glioma progression. Biochim Biophys Acta. 2012;1818:2058–2067. doi: 10.1016/j.bbamem.2011.10.022. [DOI] [PubMed] [Google Scholar]
- Shinoura N, Chen L, Wani MA, Kim YG, Larson JJ, Warnick RE, et al. Protein and messenger RNA expression of connexin43 in astrocytomas: implications in brain tumor gene therapy. J Neurosurg. 1996;84:839–845. doi: 10.3171/jns.1996.84.5.0839. [DOI] [PubMed] [Google Scholar]
- Huang R-P, Hossain M, Sehgal A, Boynton A. Reduced connexin43 expression in high-grade human brain glioma cells. J Surg Oncol. 1999;70:21–24. doi: 10.1002/(sici)1096-9098(199901)70:1<21::aid-jso4>3.0.co;2-0. [DOI] [PubMed] [Google Scholar]
- Soroceanu L, Manning T, Sontheimer H. Reduced expression of connexin-43 and functional gap junction coupling in human gliomas. Glia. 2001;33:107–117. doi: 10.1002/1098-1136(200102)33:2<107::aid-glia1010>3.0.co;2-4. [DOI] [PubMed] [Google Scholar]
- Pu P, Xia Z, Yu S, Huang Q. Altered expression of Cx43 in astrocytic tumors. Clin Neurol Neurosurg. 2004;107:49–54. doi: 10.1016/j.clineuro.2004.03.006. [DOI] [PubMed] [Google Scholar]
- Zhu D, Caveney S, Kidder GM, Naus CCG. Transfection of C6 glioma-cells with connexin-43 cDNA – analysis of expression, intercellular coupling, and cell-proliferation. Proc Natl Acad Sci USA. 1991;88:1883–1887. doi: 10.1073/pnas.88.5.1883. [DOI] [PMC free article] [PubMed] [Google Scholar]
- Huang R, Fan Y, Hossain M, Peng A, Zeng Z, Boynton A. Reversion of the neoplastic phenotype of human glioblastoma cells by connexin 43 (cx43) Cancer Res. 1998;58:5089–5096. [PubMed] [Google Scholar]
- Zhu Y, Parada LF. The molecular and genetic basis of neurological tumours. Nat Rev Cancer. 2002;2:616–626. doi: 10.1038/nrc866. [DOI] [PubMed] [Google Scholar]
- Dirks PB. Brain tumor stem cells: the cancer stem cell hypothesis writ large. Mol Oncol. 2010;4:420–430. doi: 10.1016/j.molonc.2010.08.001. [DOI] [PMC free article] [PubMed] [Google Scholar]
- Chen J, Li Y, Yu TS, McKay RM, Burns DK, Kernie SG, et al. A restricted cell population propagates glioblastoma growth after chemotherapy. Nature. 2012;488:522–526. doi: 10.1038/nature11287. [DOI] [PMC free article] [PubMed] [Google Scholar]
- Friedmann-Morvinski D, Bushong EA, Ke E, Soda Y, Marumoto T, Singer O, et al. Dedifferentiation of neurons and astrocytes by oncogenes can induce gliomas in mice. Science. 2012;338:1080–1084. doi: 10.1126/science.1226929. [DOI] [PMC free article] [PubMed] [Google Scholar]
- Yu SC, Xiao HL, Jiang XF, Wang QL, Li Y, Yang XJ, et al. Connexin 43 reverses malignant phenotypes of glioma stem cells by modulating E-cadherin. Stem Cells. 2012;30:108–120. doi: 10.1002/stem.1685. [DOI] [PubMed] [Google Scholar]
- Giepmans BN. Gap junctions and connexin-interacting proteins. Cardiovasc Res. 2004;62:233–245. doi: 10.1016/j.cardiores.2003.12.009. [DOI] [PubMed] [Google Scholar]
- Herve JC, Bourmeyster N, Sarrouilhe D, Duffy HS. Gap junctional complexes: from partners to functions. Prog Biophys Mol Biol. 2007;94:29–65. doi: 10.1016/j.pbiomolbio.2007.03.010. [DOI] [PubMed] [Google Scholar]
- Bates DC, Sin WC, Aftab Q, Naus CC. Connexin43 enhances glioma invasion by a mechanism involving the carboxy terminus. Glia. 2007;55:1554–1564. doi: 10.1002/glia.20569. [DOI] [PubMed] [Google Scholar]
- Cina C, Maass K, Theis M, Willecke K, Bechberger JF, Naus CC. Involvement of the cytoplasmic C-terminal domain of connexin43 in neuronal migration. J Neurosci. 2009;29:2009–2021. doi: 10.1523/JNEUROSCI.5025-08.2009. [DOI] [PMC free article] [PubMed] [Google Scholar]
- Kardami E, Dang X, Iacobas DA, Nickel BE, Jeyaraman M, Srisakuldee W, et al. The role of connexins in controlling cell growth and gene expression. Prog Biophys Mol Biol. 2007;94:245–264. doi: 10.1016/j.pbiomolbio.2007.03.009. [DOI] [PubMed] [Google Scholar]
- Prochnow N, Dermietzel R. Connexons and cell adhesion: a romantic phase. Histochem Cell Biol. 2008;130:71–77. doi: 10.1007/s00418-008-0434-7. [DOI] [PMC free article] [PubMed] [Google Scholar]
- Sorgen PL, Duffy HS, Sahoo P, Coombs W, Delmar M, Spray DC. Structural changes in the carboxyl terminus of the gap junction protein connexin43 indicates signaling between binding domains for c-Src and zonula occludens-1. J Biol Chem. 2004;279:54695–54701. doi: 10.1074/jbc.M409552200. [DOI] [PubMed] [Google Scholar]
- Anneren C, Cowan CA, Melton DA. The Src family of tyrosine kinases is important for embryonic stem cell self-renewal. J Biol Chem. 2004;279:31590–31598. doi: 10.1074/jbc.M403547200. [DOI] [PubMed] [Google Scholar]
- Singh S, Trevino J, Bora-Singhal N, Coppola D, Haura E, Altiok S, et al. EGFR/Src/Akt signaling modulates Sox2 expression and self-renewal of stem-like side-population cells in non-small cell lung cancer. Mol Cancer. 2012;11:73. doi: 10.1186/1476-4598-11-73. [DOI] [PMC free article] [PubMed] [Google Scholar]
- Herrero-Gonzalez S, Gangoso E, Giaume C, Naus CC, Medina JM, Tabernero A. Connexin43 inhibits the oncogenic activity of c-Src in C6 glioma cells. Oncogene. 2010;29:5712–5723. doi: 10.1038/onc.2010.299. [DOI] [PubMed] [Google Scholar]
- Silvestre DC, Pineda JR, Hoffschir F, Studler JM, Mouthon MA, Pflumio F, et al. Alternative lengthening of telomeres in human glioma stem cells. Stem Cells. 2011;29:440–451. doi: 10.1002/stem.600. [DOI] [PubMed] [Google Scholar]
- Du J, Bernasconi P, Clauser KR, Mani DR, Finn SP, Beroukhim R, et al. Bead-based profiling of tyrosine kinase phosphorylation identifies SRC as a potential target for glioblastoma therapy. Nat Biotechnol. 2009;27:77–83. doi: 10.1038/nbt.1513. [DOI] [PMC free article] [PubMed] [Google Scholar]
- Kmiecik TE, Shalloway D. Activation and suppression of pp60c-src transforming ability by mutation of its primary sites of tyrosine phosphorylation. Cell. 1987;49:65–73. doi: 10.1016/0092-8674(87)90756-2. [DOI] [PubMed] [Google Scholar]
- Xu W, Harrison SC, Eck MJ. Three-dimensional structure of the tyrosine kinase c-Src. Nature. 1997;385:595–602. doi: 10.1038/385595a0. [DOI] [PubMed] [Google Scholar]
- Pollard SM, Yoshikawa K, Clarke ID, Danovi D, Stricker S, Russell R, et al. Glioma stem cell lines expanded in adherent culture have tumor-specific phenotypes and are suitable for chemical and genetic screens. Cell Stem Cell. 2009;4:568–580. doi: 10.1016/j.stem.2009.03.014. [DOI] [PubMed] [Google Scholar]
- Valle-Casuso JC, Gonzalez-Sanchez A, Medina JM, Tabernero A. HIF-1 and c-Src mediate increased glucose uptake induced by endothelin-1 and Connexin43 in astrocytes. PLoS One. 2012;7:e32448. doi: 10.1371/journal.pone.0032448. [DOI] [PMC free article] [PubMed] [Google Scholar]
- Wheelock MJ, Shintani Y, Maeda M, Fukumoto Y, Johnson KR. Cadherin switching. J Cell Sci. 2008;121 (Part 6:727–735. doi: 10.1242/jcs.000455. [DOI] [PubMed] [Google Scholar]
- Soroceanu L, Murase R, Limbad C, Singer E, Allison J, Adrados I, et al. Id-1 is a key transcriptional regulator of glioblastoma aggressiveness and a novel therapeutic target. Cancer Res. 2013;73:1559–1569. doi: 10.1158/0008-5472.CAN-12-1943. [DOI] [PMC free article] [PubMed] [Google Scholar]
- Cheung PY, Yip YL, Tsao SW, Ching YP, Cheung AL. Id-1 induces cell invasiveness in immortalized epithelial cells by regulating cadherin switching and Rho GTPases. J Cell Biochem. 2011;112:157–168. doi: 10.1002/jcb.22911. [DOI] [PubMed] [Google Scholar]
- Giepmans BN, Hengeveld T, Postma FR, Moolenaar WH. Interaction of c-Src with gap junction protein connexin-43. Role in the regulation of cell–cell communication. J Cell Biochem. 2001;276:8544–8549. doi: 10.1074/jbc.M005847200. [DOI] [PubMed] [Google Scholar]
- Gump JM, Dowdy SF. TAT transduction: the molecular mechanism and therapeutic prospects. Trends Mol Med. 2007;13:443–448. doi: 10.1016/j.molmed.2007.08.002. [DOI] [PubMed] [Google Scholar]
- Kim RK, Yoon CH, Hyun KH, Lee H, An S, Park MJ, et al. Role of lymphocyte-specific protein tyrosine kinase (LCK) in the expansion of glioma-initiating cells by fractionated radiation. Biochem Biophys Res Commun. 2010;402:631–636. doi: 10.1016/j.bbrc.2010.10.072. [DOI] [PubMed] [Google Scholar]
- Gangemi RM, Griffero F, Marubbi D, Perera M, Capra MC, Malatesta P, et al. SOX2 silencing in glioblastoma tumor-initiating cells causes stop of proliferation and loss of tumorigenicity. Stem Cells. 2009;27:40–48. doi: 10.1634/stemcells.2008-0493. [DOI] [PubMed] [Google Scholar]
- Benezra R, Davis RL, Lockshon D, Turner DL, Weintraub H. The protein Id: a negative regulator of helix-loop-helix DNA binding proteins. Cell. 1990;61:49–59. doi: 10.1016/0092-8674(90)90214-y. [DOI] [PubMed] [Google Scholar]
- Anido J, Saez-Borderias A, Gonzalez-Junca A, Rodon L, Folch G, Carmona MA, et al. TGF-beta receptor inhibitors target the CD44(high)/Id1(high) glioma-initiating cell population in human glioblastoma. Cancer Cell. 2010;18:655–668. doi: 10.1016/j.ccr.2010.10.023. [DOI] [PubMed] [Google Scholar]
- Gautschi O, Tepper CG, Purnell PR, Izumiya Y, Evans CP, Green TP, et al. Regulation of Id1 expression by SRC: implications for targeting of the bone morphogenetic protein pathway in cancer. Cancer Res. 2008;68:2250–2258. doi: 10.1158/0008-5472.CAN-07-6403. [DOI] [PubMed] [Google Scholar]
- Nieto MA, Cano A. The epithelial–mesenchymal transition under control: global programs to regulate epithelial plasticity. Semin Cancer Biol. 2012;22:361–368. doi: 10.1016/j.semcancer.2012.05.003. [DOI] [PubMed] [Google Scholar]
- Scemes E. Modulation of astrocyte P2Y1 receptors by the carboxyl terminal domain of the gap junction protein Cx43. Glia. 2008;56:145–153. doi: 10.1002/glia.20598. [DOI] [PMC free article] [PubMed] [Google Scholar]
- Zhang W, Nwagwu C, Le DM, Yong VW, Song H, Couldwell WT. Increased invasive capacity of connexin43-overexpressing malignant glioma cells. J Neurosurg. 2003;99:1039–1046. doi: 10.3171/jns.2003.99.6.1039. [DOI] [PubMed] [Google Scholar]
- Elias LA, Wang DD, Kriegstein AR. Gap junction adhesion is necessary for radial migration in the neocortex. Nature. 2007;448:901–907. doi: 10.1038/nature06063. [DOI] [PubMed] [Google Scholar]
- Matsuuchi L, Naus CC. Gap junction proteins on the move: connexins, the cytoskeleton and migration. Biochim Biophys Acta. 2013;1828:94–108. doi: 10.1016/j.bbamem.2012.05.014. [DOI] [PubMed] [Google Scholar]
- Behrens J, Kameritsch P, Wallner S, Pohl U, Pogoda K. The carboxyl tail of Cx43 augments p38 mediated cell migration in a gap junction-independent manner. Eur J Cell Biol. 2010;89:828–838. doi: 10.1016/j.ejcb.2010.06.003. [DOI] [PubMed] [Google Scholar]
- Lin JH, Takano T, Cotrina ML, Arcuino G, Kang J, Liu S, et al. Connexin 43 enhances the adhesivity and mediates the invasion of malignant glioma cells. J Neurosci. 2002;22:4302–4311. doi: 10.1523/JNEUROSCI.22-11-04302.2002. [DOI] [PMC free article] [PubMed] [Google Scholar]
- Oliveira R, Christov C, Guillamo JS, de Bouard S, Palfi S, Venance L, et al. Contribution of gap junctional communication between tumor cells and astroglia to the invasion of the brain parenchyma by human glioblastomas. BMC Cell Biol. 2005;6:7. doi: 10.1186/1471-2121-6-7. [DOI] [PMC free article] [PubMed] [Google Scholar]
- Mori R, Power KT, Wang CM, Martin P, Becker DL. Acute downregulation of connexin43 at wound sites leads to a reduced inflammatory response, enhanced keratinocyte proliferation and wound fibroblast migration. J Cell Sci. 2006;119:5193–5203. doi: 10.1242/jcs.03320. [DOI] [PubMed] [Google Scholar]
- McDonough WS, Johansson A, Joffee H, Giese A, Berens ME. Gap junction intercellular communication in gliomas is inversely related to cell motility. Int J Dev Neurosci. 1999;17:601–611. doi: 10.1016/s0736-5748(99)00024-6. [DOI] [PubMed] [Google Scholar]
- Simpson KJ, Selfors LM, Bui J, Reynolds A, Leake D, Khvorova A, et al. Identification of genes that regulate epithelial cell migration using an siRNA screening approach. Nat Cell Biol. 2008;10:1027–1038. doi: 10.1038/ncb1762. [DOI] [PubMed] [Google Scholar]
- Crespin S, Bechberger J, Mesnil M, Naus CC, Sin WC. The carboxy-terminal tail of connexin43 gap junction protein is sufficient to mediate cytoskeleton changes in human glioma cells. J Cell Biochem. 2010;110:589–597. doi: 10.1002/jcb.22554. [DOI] [PubMed] [Google Scholar]
- Francis R, Xu X, Park H, Wei CJ, Chang S, Chatterjee B, et al. Connexin43 modulates cell polarity and directional cell migration by regulating microtubule dynamics. PLoS One. 2011;6:e26379. doi: 10.1371/journal.pone.0026379. [DOI] [PMC free article] [PubMed] [Google Scholar]
- Xu X, Francis R, Wei CJ, Linask KL, Lo CW. Connexin 43-mediated modulation of polarized cell movement and the directional migration of cardiac neural crest cells. Development. 2006;133:3629–3639. doi: 10.1242/dev.02543. [DOI] [PubMed] [Google Scholar]
- Patru C, Romao L, Varlet P, Coulombel L, Raponi E, Cadusseau J, et al. CD133, CD15/SSEA-1, CD34 or side populations do not resume tumor-initiating properties of long-term cultured cancer stem cells from human malignant glio-neuronal tumors. BMC Cancer. 2010;10:66. doi: 10.1186/1471-2407-10-66. [DOI] [PMC free article] [PubMed] [Google Scholar]
- Tabernero A, Bolaños JP, Medina JM. Lipogenesis from lactate in rat neurons and astrocytes in primary culture. Biochem J. 1993;294:635–638. doi: 10.1042/bj2940635. [DOI] [PMC free article] [PubMed] [Google Scholar]
- Thirant C, Bessette B, Varlet P, Puget S, Cadusseau J, Tavares Sdos R, et al. Clinical relevance of tumor cells with stem-like properties in pediatric brain tumors. PLoS One. 2011;6:e16375. doi: 10.1371/journal.pone.0016375. [DOI] [PMC free article] [PubMed] [Google Scholar]
Associated Data
This section collects any data citations, data availability statements, or supplementary materials included in this article.


