Abstract
Human T cell leukemia virus type 1 encodes an “accessory” protein named p13II that is targeted to mitochondria and triggers a rapid flux of K+ and Ca2+ across the inner membrane. In this study, we investigated the effects of p13II on tumorigenicity in vivo and on cell growth in vitro. Results showed that p13II significantly reduced the incidence and growth rate of tumors arising from c-myc and Ha-ras-cotransfected rat embryo fibroblasts. Consistent with these findings, HeLa-derived cell lines stably expressing p13II exhibited markedly reduced tumorigenicity, as well as reduced proliferation at high density in vitro. Mixed culture assays revealed that the phenotype of the p13II cell lines was dominant over that of control lines and was mediated by a heat-labile soluble factor. The p13II cell lines exhibited an enhanced response to Ca2+-mediated stimuli, as measured by increased sensitivity to C2-ceramide-induced apoptosis and by cAMP-responsive element-binding protein (CREB) phosphorylation in response to histamine. p13II-expressing Jurkat T cells also exhibited reduced proliferation, suggesting that the protein might exert similar effects in T cells, the primary target of HTLV-1 infection. These findings provide clues into the function of p13II as a negative regulator of cell growth and underscore a link between mitochondria, Ca2+ signaling, and tumorigenicity.
Keywords: apoptosis, calcium signaling, tumorigenicity, retrovirus
Human T cell leukemia virus type 1 (HTLV-1) possesses a complex genome that codes for Gag, Pol, Env, Tax, Rex, and a number of “accessory” proteins (1-4). Although the function of the accessory proteins has not yet been elucidated completely, they elicit an immune response in HTLV-1 infected individuals (5) and are required for efficient viral propagation in an animal model (6).
One of the HTLV-1 accessory proteins, p13II, accumulates in mitochondria by means of an amphipathic mitochondrial targeting signal and disrupts mitochondrial morphology (7). Biochemical analyses showed that p13II is inserted in the inner mitochondrial membrane and alters mitochondrial conductance to Ca2+ and K+, leading to swelling and collapse of inner mitochondrial membrane potential (8).
These effects suggest that p13II might alter key mitochondrial functions such as energy production, redox status, and apoptosis, which could in turn disrupt the balance between cell death and proliferation. In this study, we investigated the impact of p13II on cell growth in vitro and tumor growth in vivo by using the rat embryo fibroblast (REF) transformation model and cell lines expressing p13II. Results showed that p13II-expressing cells exhibit reduced tumorigenicity in vivo and slower proliferation at high density in vitro. p13II-expressing cells also display perturbations in signal transduction pathways depending on Ca2+ homeostasis.
Materials and Methods
Generation of HeLa Tet-On Cell Lines Expressing p13II. The doxycyclin-inducible p13II expression plasmid pTRE-p13II-AU1 was constructed by inserting the AU1-tagged p13II coding sequence into the BamHI site of vector pTRE (Clontech). HeLa Tet-On cells (Clontech), which are stably transfected with pTetOn and a G418-resistance plasmid, were maintained in DMEM (Sigma) supplemented with 5% FCS (Invitrogen)/100 units/ml penicillin/20 units/ml streptomycin/500 μg/ml G418. To generate stable cell lines, HeLa Tet-On cells were transfected with pTKHygro (Clontech) and either pTRE or pTRE-p13II-AU1. Each culture was divided into three plates 2 days later, grown for an additional 24 h, and then subjected to selection with 300 μg/ml hygromycin/G418. Resulting colonies were screened for p13II expression by RT-PCR using avian myeloblastosis virus reverse transcriptase (Finnzymes, Helsenki), random hexamers, Amplitaq Gold (Applied Biosystems), and p13II-specific primers. Transfections were carried out by using Fugene 6 (Roche).
Generation of Jurkat Tet-On Cells Expressing p13II. The p13II coding sequence was inserted into the SacII and NotI sites of the tetracycline-inducible vector pGInZ, which contains a transcription unit driven by tetracycline-inducible promoter (tetOP) flanked by two copies of chicken β-globin insulator sequences and two loxP sites (K.H., G. A. Gaitanaris, P. Eyler, O. Slobodskaya, E. A. Southon, L. Tessarollo, G. N. Pavlakis, unpublished data). The cell line Jurkat Tet-On (Clontech), stably transfected with pTetOn and a G418-resistance plasmid, was maintained in RPMI medium 1640 (Euro-clone, Milan) supplemented with 10% FCS (Invitrogen)/2 mM glutamine/100 units/ml penicillin/20 units/ml streptomycin/500 μg/ml G418. We electroporated (250 V, 960 μF) 1 × 10⁷ Jurkat Tet-On cells with 10 μg of DNA (pTKHygro with or without pGInZ-p13II). Cultures were subjected to selection 1 day later with 300 μg/ml hygromycin and 500 μg/ml G418. Resulting bulk cultures were screened for p13II expression by RT-PCR, as described above.
Real-Time RT-PCR. Total RNA was isolated by using TRIzol (Invitrogen) and reverse-transcribed by using avian myeloblastosis virus reverse transcriptase and random hexamers. Primer and probe sequences were chosen by using primer express software (Applied Biosystems). Probes were 5′ end-labeled with FAM and 3′ end-labeled with TAMRA. The p13II cDNA from HTLV-1-infected cell line MT2 was amplified by using a forward primer (5′-GTCCGCCGTCTAGCAGGTC-3′) in exon 1 and a reverse primer (5′-GGTTAACTTTGTATCTGTAGGGCTGTT-3′) and probe (5′-TCCGGGCATGGCACAGGC-3′) in exon C. The p13II cDNA from stably transfected cell lines was amplified by using a forward primer (5′-CTATGTTCGGCCCGCCT-3′), reverse primer (5′-TGATCTGATGCCCTGGACAG-3′), and probe (5′-CTACGTCACGCCCTACTGGCCA-3′) in exon C. As an internal control, GAPDH was analyzed in parallel by using the Endogenous Control Human GAPDH kit (Applied Biosystems). PCR reactions were performed with an ABI Prism 7700 Sequence Detection System by using 5 μl of each diluted RT sample and 20 μl of diluted Taqman Universal PCR Master Mix (Applied Biosystems), primers, and probe; each reaction was performed in duplicate. The cycling conditions comprised a initial step at 50°C for 2 min, denaturation at 95°C for 10 min, and 45 cycles at 95°C for 15 sec and 60°C for 1 min. The absolute kinetic method was applied by using standard curves constructed from 5-fold serial dilutions of a plasmid containing the GAPDH amplicon, plasmid SG5p13 II (for stably transfected cell lines), or pLs1-C (for MT2 cells). Figs. 2A and 7A show p13II-cDNA copy numbers detected in stable cell lines relative to those detected in MT2 (set at 1), which were calculated after normalizing for GAPDH-cDNA copy numbers.
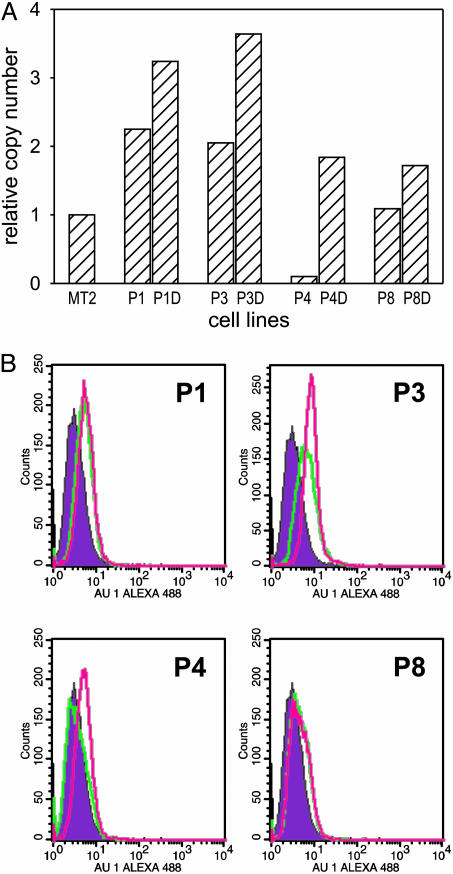
Fig. 2.
Expression of p13II in HeLaTet-On-derived cell lines. (A) expression of the p13II mRNA in cell lines P1, P2, P3, P4, and P8 cultured with or without doxycyclin (D) were analyzed by real-time RT-PCR. Shown are the relative p13II cDNA copy numbers compared with the HTLV-1-infected cell line MT-2, calculated as described in Materials and Methods. (B) Flow cytometry of p13II cell lines labeled with AU-1 Ab to detect p13II-AU-1 protein. Shown are the fluorescence intensities of the control C2 cells (filled curves) and p13II cells demonstrating low basal expression of p13II protein (green lines) and modest induction with doxycyclin (pink lines), which was statistically significant [Kolmogorov-Smirnov test; D/s(n) values in pairwise comparison with C2: P1, 21.97; P1+Doxy, 22.74; P3, 51.37; P3+Doxy, 77.36; P4, 6.97; P4+Doxy, 39.02; P8, 39.26; P8+Doxy, 48.08].
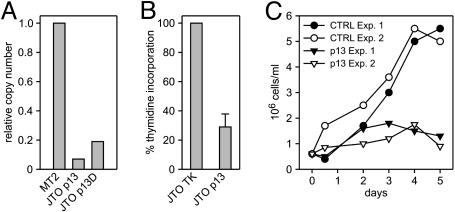
Fig. 7.
Effects of p13II in T cells. (A) Real-time RT-PCR of p13II-transfected, Jurkat-Tet-On (JTO-p13II) cells cultivated in the absence and presence of doxycyclin (D). Results are expressed as RNA copy numbers relative to MT-2 cells. (B) 3HT incorporation assays were carried out on p13II-expressing JTO (JTO-p13II) and control cells (JTO-TK) seeded at 5 × 10⁵cells per ml; shown are cpm values cumulated from three separate experiments. Bars indicate SEM. (C) Growth curves of JTO-p13II and control JTO-TK cultures. Shown are results of two separate experiments.
Tumorigenicity Assays. REF were prepared as described (9) and maintained for one to three passages in DMEM (1,500 mg/ml glucose) supplemented with 10% FCS and penicillin/streptomycin. REF were then seeded in 100-mm plates and transfected with plasmids encoding c-Myc and Ha-Ras with or without the p13II-expression plasmid pSGp13II (8). After 36 h, 5 × 10⁵ cells were inoculated s.c. into the flanks of 6-week-old male nude mice (Charles River Breeding Laboratories). Tumorigenicity assays of HeLa Tet-On cell lines were carried out in the same manner, except that mice were administered drinking water supplemented with either 4% sucrose or 4% sucrose plus 2 mg/ml doxycyclin (Sigma) to induce the pTRE promoter; doxycyclin-supplemented water was changed every 3 days. Tumor volumes were calculated with the ellipsoid formula 4/3π ab2, where a and b are the length and width of the tumor, respectively. Mice were killed when tumors reached a volume of ≈1.5 cm3 or within 1 month after inoculation. Experiments were performed in accordance with European Union and Italian animal care regulations.
Analysis of p13II AU1 Expression by Flow Cytometry. HeLa Tet-On cell lines were trypsinized, fixed for 20 min with 3.7% formaldehyde-PBS, permeabilized for 10 min with 0.1% Nonidet P-40/PBS, and then incubated with anti-AU1 mAb (Babco, Richmond, CA), followed by an Alexa 488-conjugated anti-mouse Ab (Molecular Probes). Signals were analyzed by flow cytometry (FACScalibur, Becton Dickinson) using a 488-nm Argon laser and the FL1 detection line (500-560 nm). Statistical significance of signal intensity was assessed by using the Kolmogorov-Smirnov test.
[3H]Thymidine (3HT) Incorporation Assays. HeLa Tet-On-derived cell lines were seeded in triplicate 96-well flat-bottom plates (Falcon) at 32,000 or 64,000 cm2 in 200 μl per well of complete DMEM with or without 1 μg/ml doxycyclin. After 12 h, 1 μCi 3HT (1 Ci = 37 GBq) (NEN) was added to each well, and incubation was continued for 18 h. Jurkat Tet-On-derived cells were seeded in triplicate in 96-well flat-bottom plates (Falcon) at 100,000 cells per well in 200 μl per well of complete RPMI. After 12 h, 1 μCi 3HT was added to each well, and incubation was continued for 6 h. The cells were lysed and 3HT incorporation was measured by scintillation counting.
Cell-Cycle Analysis. Cells were seeded at 32,000 or 64,000 cells per cm2 in 60-mm Petri dishes. After 24 h, the cells were treated with 0.5 μM nocodazole for 7 or 24 h and then trypsinized, washed, and fixed with 70% ice-cold ethanol at 4°C for 30 min. After two washes in ice-cold PBS, the cells were incubated with 100 μg/ml propidium iodide (PI) plus 100 μg/ml RNase overnight at 4°C and analyzed by flow cytometry using a 488-nm Argon laser and FL2-A detection line. DNA content frequency histograms were deconvoluted by using modfit LT software (Verity, Topsham, ME).
Immunoblotting. Cells were lysed in SDS/PAGE sample buffer with Complete protease inhibitors (Roche), separated by SDS/PAGE, and transferred to PVDF (Amersham Biosciences). Blots were incubated with a rabbit antiserum recognizing poly(ADP ribose) polymerase (PARP) (Cell Signaling Technology, Beverly, MA), followed by a horseradish peroxidase-conjugated anti-rabbit Ab (Amersham Biosciences or Santa Cruz Biotechnology), developed by using Supersignal chemiluminescence reagents (Pierce), and exposed to x-ray film.
Immunofluorescence. After the treatment described in the legend to Fig. 6B, cells were washed in PBS and fixed in 3.7% formaldehyde, permeabilized in 0.1% Nonidet P-40-PBS, and incubated with rabbit anti-phospho-cAMP-responsive element-binding protein (CREB) Ser-133 Ab (Cell Signaling Technology), followed by an Alexa 546-conjugated anti-rabbit Ab (Molecular Probes). Fluorescent signals were analyzed by using a LSM 510 confocal microscope, quantitated by using the profile software (Zeiss), and expressed as a nuclear/cytoplasmic intensity ratio. For each cell line, 100 nuclei were counted, and resulting mean nuclear/cytoplasmic ratios were plotted.
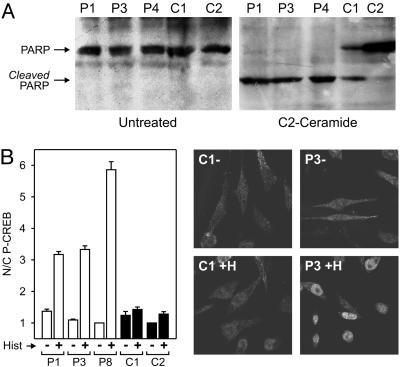
Fig. 6.
Increased sensitivity of p13II cell lines to Ca2+-mediated stimuli. (A) Control and p13II cell lines were seeded at 32,000 cells per cm2, cultured for 1 day, and then incubated with or without 10 μM C2-ceramide for 16 h and analyzed by immunoblotting to detect PARP cleavage. p13II lines exhibited a marked sensitivity to apoptosis induced by treatment with C2-ceramide compared with control lines. (B) Control and p13II cell lines were seeded at 32,000 cells per cm2, cultured for 1 day, and then incubated with or without 100 μM histamine for 20 min and analyzed by immunofluorescence to measure nuclear phospho-CREB. The graph, which summarizes results of three assays and standard errors, shows that the p13II cell lines exhibited increased nuclear phospho-CREB in response to histamine. Photographs show representative anti-phospho-CREB immunofluorescence fields of untreated (-) and histamine-treated (+H) cells.
Results
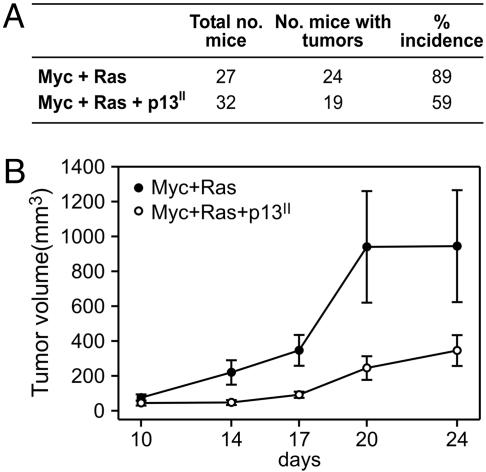
p13II Suppresses Oncogenic Conversion of REF. To determine the effects of p13II on tumorigenicity in vivo, we compared the ability of REF transfected with plasmids coding for c-Myc and Ha-Ras in the absence or presence of a p13II plasmid to grow as tumors in nude mice (10). As shown in Fig. 1A, REF cotransfected with c-Myc and Ha-Ras plasmids produced tumors in 89% of the inoculated mice. Cotransfection with c-Myc, Ha-Ras and p13II reduced tumor incidence significantly to 59% (P = 0.0176; Fisher's exact test). Furthermore, the growth rate of the c-Myc+Ha-Ras+p13II tumors was much slower than that of c-Myc+Ha-Ras tumors (Fig. 1B). RT-PCR analysis of tumors confirmed expression of p13II, c-Myc, and Ha-Ras (data not shown).
Fig. 1.
p13II suppresses oncogenic conversion of REF. REF transfected with c-Myc and Ha-Ras plasmids in the absence or presence of a p13II plasmid were inoculated in nude mice, and tumor growth was monitored as described in Materials and Methods. (A) Tumor incidence was significantly decreased in the experimental group cotransfected with p13II (two-sided P = 0.0176). (B) Reduced growth rate of tumors arising in the c-Myc+Ha-Ras+p13II group.
Reduced Tumorigenicity of p13II HeLaTet-On Cell Lines. To validate the results obtained in the REF model and provide a more agile system for in vitro studies, we stably transfected the doxycyclin-inducible cell line HelaTet-On with plasmid pTRE-p13II-AU1, which codes for p13II tagged with the AU1 epitope. Two control lines stably transfected with the empty pTRE vector (C1 and C2) and four lines stably transfected with pTRE-p13II-AU1 (P1, P3, P4, and P8) were obtained. Real-time RT-PCR analysis showed that the levels of p13II mRNA detected in the stable cell lines exhibited a modest induction of expression in response to doxycyclin and were comparable with or slightly higher than those detected in MT2 cells (Fig. 2A). Analysis of the cell lines with an AU-1 Ab, followed by flow cytometry, confirmed low levels of p13II protein expression and modest induction with doxycyclin (Fig. 2B).
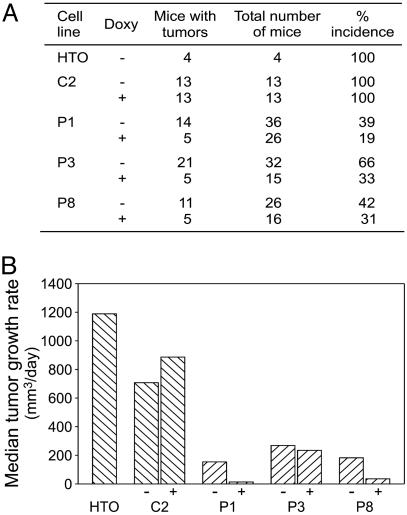
An initial assessment of the tumorigenicity of the parental HeLaTet-On cell line established that inoculation of 5 × 10⁵ cells produced tumors in 100% of the mice, with tumor masses detectable after ≈5-7 days and reaching a volume of 1 cm3 in ≈3 weeks. Assays using p13II cell lines P1, P3, and P8, and control cell line C2 were carried out in the same manner, except that some mice were administered 2 μg/ml doxycyclin in their drinking water. Like HeLaTet-On cells, control clone C2 yielded tumors in 100% of the mice. In contrast, P1, P3, and P8 produced substantially fewer tumors; in line with the low basal level and modest up-regulation of p13II expression observed in vitro, induction of the p13II lines with doxycyclin in vivo reduced their tumorigenicity further (Fig. 3A). Differences in tumor incidence in the control group (C2) vs. the p13II group (P1, P3, and P8) with and without doxycyclin were highly significant (P < 0.0001 among doxycyclin-treated groups, P = 0.0002 in the absence of doxycyclin; Fisher's exact test).
Fig. 3.
Reduced tumorigenicity of p13II cell lines. Parental HeLaTet-On (HTO), empty-vector control (C2), and p13II lines P1, P3, and P8 were injected s.c. into nude mice, some of which were administered 2 μg/ml doxycyclin (Doxy) in their drinking water. Although HTO and C2 yielded tumors in 100% of the mice, the p13II lines exhibited a marked reduction in tumor incidence (A) and growth rate (B). Doxycyclin treatment further reduced the incidence and growth rate of the p13II tumors.
Consistent with the data obtained in the REF system, tumors arising from the p13II cell lines displayed markedly reduced growth rate curves compared with control HeLaTet-On or C2 cells (Fig. 3B). In addition, doxycyclin treatment decreased the growth rate of the p13II tumors further but did not affect growth of C2 tumors (Fig. 3B). RT-PCR analysis confirmed p13II expression in tumors growing from the p13II lines (data not shown).
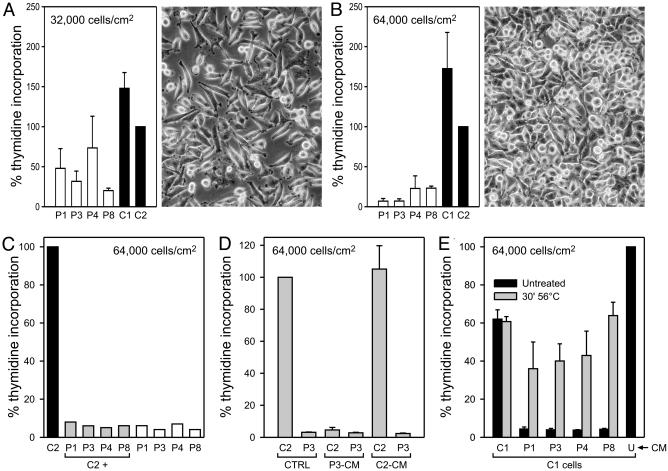
p13II Inhibits Cell Growth at High Density in Vitro. To investigate the causes underlying the effects of p13II on tumor growth, we compared the proliferation of the p13II and control cell lines in 3HT incorporation assays. As shown in Fig. 4A, all of the p13II-positive clones incorporated less 3HT than the control clones in subconfluent cultures (32,000 cells per cm2; see photograph in Fig. 4A). Interestingly, the reduction in 3HT incorporation in p13II lines was much more evident when the cells were plated at 64,000 cells per cm2 (i.e., confluence; Fig. 4B). These assays were carried out in the presence of 2 mg/ml doxycyclin to maximize p13II expression. We also compared the incorporation levels in the absence and presence of doxycyclin, and we found that the drug had a minor effect in further decreasing proliferation of the p13II lines, suggesting that the levels of p13II in the uninduced lines were sufficient to reduce proliferation (data not shown).
Fig. 4.
p13II inhibits cell growth at high density in vitro. (A and B) 3HT incorporation assays of p13II (P1, P3, P4, and P8) and control (C1 and C2) lines seeded at the indicated cell densities; cpm values were normalized against control line C2 set at 100% incorporation. Data were cumulated from 12 (C1, C2, P1, P4, and P8) or three (P3) separate experiments and expressed as mean percentage of 3HT incorporation. Bars indicate SEM. Photographs show the appearance of representative cultures at the time of labeling. The p13II lines exhibited a density-dependent reduction in proliferation. (C) 3HT incorporation assays of individual lines and mixed cultures containing equal numbers of control C2 cells and p13II lines, to a total of 64,000 cells per cm2; the graph shows percentage of 3HT incorporation (normalized against C2). The growth-impaired phenotype of the p13II lines dominated that of control line C2. (D) 3HT incorporation assays of lines C2 and P3 in the presence of culture media conditioned by confluent C2 (C2-CM), P3 cultures (P3-CM), or standard unconditioned medium (CTRL). Shown are mean percentages of 3HT incorporation values (normalized against C2) from three experiments. Bars indicate SEM. P3-CM induced growth arrest of the C2 line, whereas control C2-CM did not influence growth. (E) Assays were carried out on line C1 in the presence of untreated or heat-treated (30 min at 56°C) conditioned media (CM) obtained from confluent C1, C2, P1, P3, P4, or P8 cultures or with untreated, unconditioned medium (U), which was set at 100% 3HT incorporation. Shown are mean percentages of 3HT incorporation values (normalized against C2) from three experiments. Bars indicate SEM. The growth-inhibitory effect of CM from p13II lines was abrogated upon heat treatment. In D and E, CM were supplemented with 1.8 mM glucose/10 mM Hepes/2 mM l-glutamine.
Under these culture conditions, flow cytometry of PI and annexin-V stained cells revealed no significant difference in cell death (2-5%) among the cell lines (data not shown), indicating that spontaneous cell death does not contribute to the phenotype of the p13II lines; similar results were obtained assessing apoptosis by cleavage of PARP (see Fig. 6A).
The concentration-dependence of the proliferation defect suggested that it might be mediated by means of cell-cell contact or accumulation of a factor in the culture medium. To determine whether the reduced-growth phenotype of the p13II lines might be overcome by cocultivation with the faster-growing control lines or vice versa, we performed proliferation assays on mixed cultures containing equal numbers of control C2 cells and the p13II lines, with each culture containing 64,000 cells per cm2. Results showed that all of the mixed cultures exhibited very low 3HT incorporation, indicating that the p13II cells slowed down the growth of the control cells (Fig. 4C). To test whether this effect was mediated by soluble factors, we incubated cell lines C2 and P3 with culture media conditioned by confluent C2 or P3 cultures. As shown in Fig. 4D, the P3-conditioned medium reduced 3HT incorporation of the C2 line, whereas control C2-conditioned medium had no effect on P3 cells, indicating that the phenotype of p13II-expressing cells is due to the presence of a growth inhibitory factor, rather than to the lack of a growth stimulatory factor, in the culture medium. Furthermore, the growth-inhibitory effect of the p13II-conditioned medium was lost after heating at 56°C for 30 min (Fig. 4E), suggesting that p13II triggers the release of heat-labile growth-inhibitory factor(s).
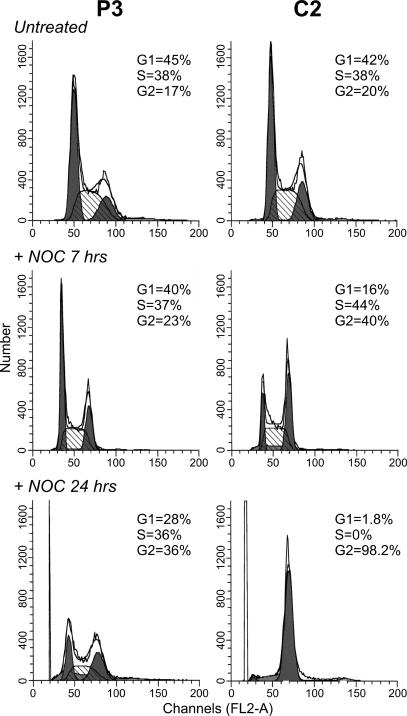
Cell-Cycle Kinetics of p13II Cell Lines. To test whether the decreased 3HT incorporation of the p13II lines reflected a block at a specific stage in the cell cycle, we analyzed their DNA content by PI staining and flow cytometry. Results failed to reveal significant differences in DNA content between control lines and p13II lines when plated at 32,000 cells per cm2 (data not shown) or at 64,000 cells per cm2 (e.g., see Fig. 5 Top for lines P3 and C2). This result suggested that p13II-mediated growth inhibition did not result from a block at a particular phase of the cell cycle.
Fig. 5.
Altered cell-cycle kinetics in p13II cell lines. P3 and C2 cells were seeded at 64,000 cells per cm2 and analyzed by PI staining and flow cytometry to detect DNA content at steady-state (Top) and after treatment with 0.5 μM nocodazole for 7 h (Middle) or 24 h (Bottom). No major difference in steady-state cell-cycle profiles was apparent; in contrast, P3 showed a marked delay in accumulation at the G/M phase after nocodazole treatment, indicating an overall delay in cell-cycle kinetics.
However, analysis of steady-state DNA content is not sensitive to differences in cell-cycle kinetics in which the relative duration of individual cell-cycle phases is unchanged. To overcome this limitation we compared the DNA content of the cell lines after treatment with nocodazole, which blocks cells in anaphase, resulting in accumulation of the cells in G2/M. As shown in Fig. 5, this approach revealed substantial differences between the control and p13II cells: after 7 h in nocodazole, 40% of the C2 cells were in G2/M, compared with only 23% of the P3 cells; after a 24-h incubation, 98% of the C2 cells had accumulated in G2/M, compared with only 36% of the P3 cells. P1, P2, and P4 also showed a delayed response to nocodazole, and C1 behaved similarly to C2 (data not shown). Together, these observations indicate that p13II induces a marked overall delay in cell-cycle kinetics.
Increased Sensitivity of p13II Cell Lines to Ca2+-Mediated Stimuli. The ability of p13II to change mitochondrial conductance to Ca2+ in vitro (8) suggested that the p13II lines might exhibit altered responses to Ca2+-mediated stimuli. This possibility was examined by testing the sensitivity of the lines to C2-ceramide, which triggers apoptosis by means of an influx of Ca2+ into mitochondria, followed by opening of the permeability transition pore (11, 12). Apoptosis induced by C2-ceramide was assessed by PARP cleavage. Whereas no PARP cleavage was detected in untreated cell lines, treatment with C2-ceramide resulted in nearly complete cleavage of PARP in the p13II cell lines but only modest PARP cleavage in the control cell lines (Fig. 6A). In contrast, p13II and control lines were equally sensitive to apoptosis induced by staurosporin and equally insensitive to etoposide, neither of which acts by means of a Ca2+-mediated opening of the permeability transition pore (data not shown).
As an additional indicator of increased sensitivity to Ca2+-mediated stimuli, we tested phosphorylation of CREB on serine 133, which follows a rise in cytosolic Ca2+ concentration triggered by histamine (13, 14). Results revealed an increased accumulation nuclear phospho-CREB in response to histamine in the p13II cell lines, as compared with controls (Fig. 6B).
Decreased Proliferation of Jurkat-Derived Cells Expressing p13II. To test the effects of p13II in T cells, the natural target of HTLV-1 infection, we transfected the Jurkat-Tet-On cell line with a tetracycline-inducible plasmid coding for p13II (JTO). Because JTO-p13II cells did not support cloning by limiting dilution, we analyzed the bulk cultures at early passages. Real-time PCR assays revealed low levels of p13II mRNA expression and modest induction with doxycyclin (Fig. 7A). As shown in Fig. 7B, the JTO-p13II cells exhibited a consistent reduction in thymidine incorporation compared with controls. In addition, JTO-p13II cells also exhausted their replication capacity at much lower densities than the control cells (Fig. 7C). Results of additional assays showed that conditioned supernatant from JTO-p13II cells exhibited growth inhibitory effects (data not shown). The fact that the growth impairment of JTO-p13II cells was somewhat less prominent than that observed with p13II-HeLaTet-On lines is probably due to the use of bulk cultures containing a mixture of p13II-expressing and nonexpressing cells. Indeed, we observed gradual attenuation of the growth-inhibitory phenotype at higher passages, probably because of selection for p13II-negative cells, a phenomenon that was not observed in the clonal HeLaTet-On populations.
Discussion
The present study provides clues into the function of p13II by demonstrating its ability to suppress tumor growth in vivo and cell proliferation in vitro and to alter responses to Ca2+-mediated stimuli. The tumor suppressive effect of p13II was demonstrated in two distinct models: myc/ras-transformed REFs (Fig. 1) and HeLas (Fig. 3). The in vitro proliferation defect of p13II-expressing HeLaTetOn cells was triggered at high cell density (Fig. 4 A and B) and was dominant over fast-growing control cells (Fig. 4C). In addition, the effects of p13II appeared to be mediated by up-regulation of a heat-sensitive cellular cytostatic factor (Fig. 4 D and E), the isolation of which would be of considerable interest both for understanding HTLV-1 pathogenesis and for its possible exploitation as an antitumor agent.
Cell-cycle studies indicated that the proliferation defect resulted from a generalized delay in cell-cycle kinetics rather than from a block at a specific phase (Fig. 5). These effects were observed at low levels of p13II expression that did not differ greatly from those observed in the HTLV-1-infected cell line MT2, thus strengthening the possible biological relevance of these data.
The fact that p13II alters Ca2+ conductance in isolated mitochondria (8), along with the increased response of p13II-HeLaTetOn lines to C2-ceramide and histamine (Fig. 6), strongly suggests that p13II perturbs Ca2+ signaling, possibly by altering mitochondrial Ca2+ uptake or release. Interestingly, p12I, another HTLV-1 accessory protein that localizes to the endoplasmic reticulum and cis-Golgi (15, 16), also increases cytoplasmic Ca2+ levels, resulting in activation of the nuclear factor of activated T cells (NF-AT) transcription factor (17, 18).
Aside from serving as an indicator of increased sensitivity to Ca2+-mediated stimuli, modulation of CREB phosphorylation by p13II could have important effects on both cell proliferation and HTLV-1 expression in infected cells, given (i) the recent observation that increased CREB phosphorylation impairs proliferation of cells with mitochondrial defects (19) and (ii) the key role of CREB in the activation of the HTLV-1 promoter (20).
Recent studies have revealed various viral proteins that are targeted to mitochondria, including Vpr of HIV 1 (reviewed in ref. 21) and G4 of bovine leukemia virus (22). Vpr is a multifunctional protein that shows partial targeting to mitochondria, where it triggers loss of inner membrane potential and release of proapoptotic proteins (23, 24). Interestingly, Vpr is also capable of inducing cell-cycle arrest in G2/M and displays antitumor activity (25, 26). The G4 protein shares interesting similarities with p13II, including a role in viral propagation in vivo (27) and binding to farnesyl pyrophosphate synthase, an enzyme that catalyzes the synthesis of farnesyl pyrophosphate, a substrate required for Ras prenylation (28). Because G4 increases the oncogenic potential of Ha-Ras (9), it will be of interest to compare directly the effects of p13II and G4 on signal transduction, cell growth, and tumorigenicity.
Further analyses will be required to extend results of the present study into the context of T cells and HTLV-1 infection. As a prelude to these technically challenging studies, we examined the effects of p13II in the context of Jurkat cells, a T-lymphoid cell line. Results confirmed the antiproliferative effects of the protein, even within the limitations of a bulk culture system (Fig. 7). These observations suggest that p13II might limit the growth potential of HTLV-1-infected cells and, thereby, contribute to the efficient adaptation of this virus to its host.
Acknowledgments
We thank P. Bernardi and R. Grassmann for discussions, G. N. Pavlakis for providing reagents, L. Zotti for initial experiments, and P. Gallo for artwork. This research was supported by the National Institutes of Health Fogarty International Center Grant R03TW005705, Istituto Superiore di Sanita AIDS Program Grant 9204-28, and the Associazione e Fondazione Italiana per la Ricerca sul Cancro. L.W. is a Research Director of the National Fund for Scientific Research. M.S.-B. and D.M.D. were supported by fellowships from Fondazione Italiana per la Ricerca sul Cancro.
This paper was submitted directly (Track II) to the PNAS office.
Abbreviations: CREB, cAMP-responsive element-binding protein; 3HT, [3H]thymidine; HTLV-1, human T cell leukemia virus type 1; PARP, poly(ADP ribose) polymerase; PI, propidium iodide; REF, rat embryo fibroblast.
References
- 1.Albrecht, B. & Lairmore, M. D. (2002) Microbiol. Mol. Biol. Rev. 66, 396-406. [DOI] [PMC free article] [PubMed] [Google Scholar]
- 2.Berneman, Z. N., Gartenhaus, R. B., Reitz, J. M. S., Blattner, W. A., Manns, A., Hanchard, B., Ikehara, O., Gallo, R. C. & Klotman, M. E. (1992) Proc. Natl. Acad. Sci. USA 89, 3005-3009. [DOI] [PMC free article] [PubMed] [Google Scholar]
- 3.Ciminale, V., Pavlakis, G. N., Derse, D., Cunningham, C. P. & Felber, B. K. (1992) J. Virol. 66, 1737-1745. [DOI] [PMC free article] [PubMed] [Google Scholar]
- 4.Koralnik, I. J., Gessain, A., Klotman, M. E., Lo Monico, A., Berneman, Z. N. & Franchini, G. (1992) Proc. Nat. Acad. Sci. USA 89, 8813-8817. [DOI] [PMC free article] [PubMed] [Google Scholar]
- 5.Pique, C., Ureta-Vidal, A., Gessain, A., Chancerel, B., Gout, O., Tamouza, R., Agis, F. & Dokhelar, M.-C. (2000) J. Exp. Med. 191, 567-572. [DOI] [PMC free article] [PubMed] [Google Scholar]
- 6.Bartoe, J., Albrecht, B., Collins, N. D., Robek, M. D., Ratner, L., Green, P. L. & Lairmore, M. D. (2000) J. Virol. 74, 1094-1100. [DOI] [PMC free article] [PubMed] [Google Scholar]
- 7.Ciminale, V., Zotti, L., D'Agostino, D. M., Ferro, T., Casareto, L., Franchini, G., Bernardi, P. & Chieco-Bianchi, L. (1999) Oncogene 18, 4505-4515. [DOI] [PubMed] [Google Scholar]
- 8.D'Agostino, DM., Ranzato, L., Arrigoni, G., Cavallari, I, Belleudi, F., Torrisi, M. R., Silic-Benussi, M., Ferro, T., Petronilli, V., Marin, O., et al. (2002) J. Biol. Chem. 277, 34424-34433. [DOI] [PubMed] [Google Scholar]
- 9.Kerkhofs, P., Heremans, H, Burny, A., Kettmann, R. & Willems, L. (1998) J. Virol. 72, 2554-2559. [DOI] [PMC free article] [PubMed] [Google Scholar]
- 10.Land, H., Parada, L. F. & Weinberg, R. A. (1983) Nature 304, 596-602. [DOI] [PubMed] [Google Scholar]
- 11.Pacher, P. & Hajnoczky, G. (2001) EMBO J. 20, 4107-4121. [DOI] [PMC free article] [PubMed] [Google Scholar]
- 12.Bernardi, P. (1999) Physiol. Rev. 79, 1127-1155. [DOI] [PubMed] [Google Scholar]
- 13.Berridge, M. J., Bootman, M. D. & Roderick, H. L. (2003) Nat. Rev. Mol. Cell Biol. 4, 517-529. [DOI] [PubMed] [Google Scholar]
- 14.Mayr, B. & Montminy, M. (2001) Nat. Rev. Mol. Cell Biol. 2, 599-609. [DOI] [PubMed] [Google Scholar]
- 15.Ding, W., Albrecht, B., Luo, R., Zhang, W., Stanley, J. R., Newbound, G. C. & Lairmore, MD. (2001) J. Virol. 75, 7672-7682. [DOI] [PMC free article] [PubMed] [Google Scholar]
- 16.Johnson, J. M., Nicot, C., Fullen, J., Ciminale, V., Casareto, L., Mulloy, J. C., Jacobson, S. & Franchini, G. (2001) J. Virol. 75, 6086-6094. [DOI] [PMC free article] [PubMed] [Google Scholar]
- 17.Albrecht, B., D'Souza, C. D., Ding, W., Tridandapani, S., Coggeshall, K. M. & Lairmore, M. D. (2002) J. Virol. 76, 3493-3501. [DOI] [PMC free article] [PubMed] [Google Scholar]
- 18.Ding, W., Albrecht, B., Kelley, R. E., Muthusamy, N., Kim, S. J., Altschuld, R. A. & Lairmore, M. D. (2002) J. Virol. 76, 10374-10382. [DOI] [PMC free article] [PubMed] [Google Scholar]
- 19.Arnould, T., Vankoningsloo, S., Renard, P., Houbion, A., Ninane, N., Demazy, C, Remacle, J. & Raes, M. (2002) EMBO J. 21, 53-63. [DOI] [PMC free article] [PubMed] [Google Scholar]
- 20.Green, P. L. & Chen, I. S. Y. (2001) in Fields Virology, eds. Knipe, D. M., Howley, P. M., Griffin, D. E., Lamb, R. A., Martin, M. A. & Roizman, B. (Lippincott, Philadelphia), 4th Ed., pp. 1941-1969.
- 21.Sherman, M. P., De Noronha, C. M., Williams, S. A. & Greene, W. C. (2002) DNA Cell Biol. 21, 679-688. [DOI] [PubMed] [Google Scholar]
- 22.Lefebvre, L., Ciminale, V., Vanderplasschen, A., D'Agostino, D., Burny, A., Willems, L. & Kettmann, R. (2002) J. Virol. 76, 7843-7854. [DOI] [PMC free article] [PubMed] [Google Scholar]
- 23.Boya, P., Roques, B. & Kroemer, G. (2001) EMBO J. 20, 4325-4331. [DOI] [PMC free article] [PubMed] [Google Scholar]
- 24.Jacotot, E., Ravagnan, L., Loeffler, M., Ferri, K. F., Vieira, H. L. A., Zanzami, N., Costantini P., Druillennec, S., Hoebeke, J., Briand, J. P., et al. (2000) J. Exp. Med. 191, 33-45. [DOI] [PMC free article] [PubMed] [Google Scholar]
- 25.Stewart, S. A., Poon, B., Jowett, J. B., Xie, Y. & Chen, I. S. (1999) Proc. Natl. Acad. Sci. USA 96, 12039-12043. [DOI] [PMC free article] [PubMed] [Google Scholar]
- 26.Pang, S., Kang, M. K., Kung, S., Yu, D., Lee, A., Poon, B., Chen, I. S., Lindemann, B. & Park, N. H. (2001) Clin. Cancer Res. 7, 3567-3573. [PubMed] [Google Scholar]
- 27.Willems, L., Kerkhofs, P., Dequiedt, F., Portetelle, D., Mammericks, M., Burny, A. & Kettman, R. (1994) Proc. Natl. Acad. Sci. USA 91, 11532-11536. [DOI] [PMC free article] [PubMed] [Google Scholar]
- 28.Lefebvre, L., Vanderplasschen, A., Ciminale, V., Heremans, H., Dangoisse, O., Jauniaux, J. C., Toussaint, J. F., Zelnik, V., Burny, A., Kettmann, R. & Willems, L. (2002) J. Virol. 76, 1400-1414. [DOI] [PMC free article] [PubMed] [Google Scholar]


