Abstract
Voluntary control of behavior implies the ability to select what action is performed. The supplementary motor area (SMA) and pre-SMA are widely considered to be of central importance for this ability because of their role in movement initiation and inhibition. To test this hypothesis, we recorded from neurons in SMA and pre-SMA of monkeys performing an arm countermanding task. Temporal analysis of neural activity and behavior in this task allowed us to test whether neural activity is sufficient to control movement initiation or inhibition. Surprisingly, 99% (242 of 243) of movement-related neurons in SMA and pre-SMA failed to exhibit time-locked activity changes predictive of movement initiation in this task. We also found a second group of neurons that was more active during successful response cancelation. Of these putative inhibitory cells, 18% (7 of 40) responded early enough to be able to influence the cancelation of the movement. Thus, when tested with the countermanding task, the SMA/pre-SMA region may play a role in movement inhibition but does not appear to control movement initiation. However, the activity of 76% (202 of 267) of movement-related neurons was contingent on the expectation of reward and 42% of them reflected the amount of expected reward. These findings suggest that the movement-related activity in pre-SMA and SMA might represent the motivation for a specific action but does not determine whether or not that action is performed. This motivational signal in pre-SMA and SMA could provide an essential link between reward expectation and motor execution.
Introduction
Voluntary control over behavior depends on the ability to initiate or inhibit goal-directed actions. The supplementary motor area (SMA) and pre-SMA are widely considered to play a central role in movement initiation and inhibition (Eccles, 1982; Goldberg, 1985; Sumner et al., 2007; Haggard, 2008). This hypothesis was first formulated after the discovery of the “readiness potential” (RP), a slow negative scalp potential that precedes self-initiated movements in humans (Kornhuber and Deecke, 1965) and whose source has been localized to the pre-SMA (Lang et al., 1991; Ikeda et al., 1999; Yazawa et al., 2000). Single-unit recordings in monkeys have shown that the pre-SMA and SMA contain “long-lead” neurons that become active up to 2 s before the initiation of self-paced movements (Okano and Tanji, 1987) and that pre-SMA neurons signal the initiation of action in a time-selective manner (Mita et al., 2009). Although these experiments have demonstrated that the earliest activity related to movements arises in the pre-SMA and SMA, it remains unknown whether this activity plays a causal role in the decision of whether or not a movement will be made.
In humans, lesion and electrical stimulation experiments also suggest a causal role for pre-SMA and SMA in movement initiation and inhibition. It has been reported that electrical stimulation of pre-SMA and SMA generates the urge to perform particular actions (Fried et al., 1991). In other experiments, pre-SMA stimulation leads to blocking and arrest of ongoing movements (Lüders et al., 1995). Lesions of the SMA often initially abolish spontaneous limb movements (Laplane et al., 1977). In other cases, lesions of pre-SMA and SMA also affect the automatic effector-specific inhibition of motor plans (Sumner et al., 2007). This disruption can lead to spontaneous uncontrolled movements that interfere with normal behavior, such as in the “alien hand” syndrome (Goldberg and Bloom, 1990). An important recent study in rhesus monkeys suggests that a class of pre-SMA neurons suppresses automatic unwanted actions and facilitates voluntary desired actions (Isoda and Hikosaka, 2007).
Thus, a large number of experiments support the hypothesis that pre-SMA and SMA are responsible for the initiation and inhibition of actions. However, this assumption has yet to be formally tested. Here, we test this proposed causal link directly by recording from neurons in SMA and pre-SMA of monkeys performing a countermanding task. This task allows us to distinguish activity that is only correlated with movement from activity that plays a causal role in the decision of whether or not a movement will be made (Logan and Cowan, 1984; Hanes et al., 1998; Verbruggen and Logan, 2008). We found that movement-related activity in the pre-SMA and SMA is not sufficient to control movement initiation. Instead, we found evidence that it might represent the motivation for specific actions. A second, smaller group of cells appears to be involved in controlling the inhibition of movements that are no longer relevant.
Materials and Methods
General.
Two rhesus monkeys were trained to perform the tasks used in this study. All animal care and experimental procedures were approved by The Johns Hopkins University Animal Care and Use Committee. During the experimental sessions, each monkey was seated in a primate chair, with its head restrained, facing a video screen. A handlebar was placed in front of the monkey that moved 12 cm in either direction along the horizontal axis. The bar controlled a rectangular cursor on the video screen. The right arm was used for the task. Handlebar position was recorded with the Plexon system at a sampling rate of 1000 Hz. Eye movement was monitored with an infrared corneal reflection system (EyeLink) at a sampling rate of 1000 Hz. On a subset of experimental sessions, electromyographic (EMG) activity was recorded using surface electrodes on six different muscles [pectoralis, deltoid, biceps, triceps, flexor carpi radialis (FCR), and extensor carpi radialis (ECR)].
Behavioral tasks.
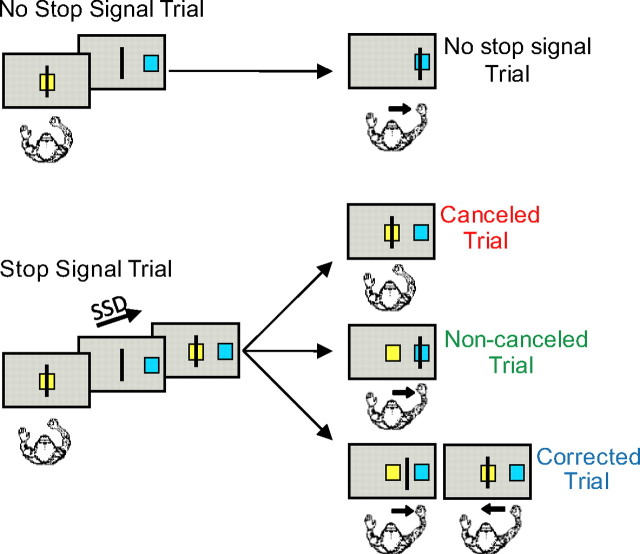
The countermanding task began with the onset of a yellow center box in the middle of the screen (Fig. 1), instructing the monkey to move the cursor into the box. After a variable delay (200–400 ms), the center box disappeared and a target box simultaneously appeared 16 visual degrees to the right or left of center, which cued the monkey to move the cursor into the target box within 700 ms to receive a liquid reward (no-stop signal trials). On 25–35% of trials, the center box reappeared after a delay, referred to as the stop signal delay (SSD), and instructed the monkey to withhold movement initiation to receive reward (stop trials). The reward was delivered 400–800 ms after the stop signal onset. In contrast to previously reported countermanding paradigms, if the monkey started to make a movement toward the target but was able to interrupt this movement before the target was reached, he had the opportunity to return the cursor back to the center for a reward. Four stop signal delays were selected through baseline training sessions so the monkey could withhold movement on ∼10, 35, 65, and 90% of the stop trials. The SSDs ranged from 120 to 420 ms. In the variable reward version of the countermanding task, the color of the initial center box (green vs yellow) signaled whether a correct trial would result in a high or low reward. The high reward was always twice as large as the low reward. High-reward trials were presented at random on 25–30% of trials. The variable-reward version and the fixed version of the task were performed in separate sessions. The SSD levels were the same for both tasks. At each experimental session, we also performed a visually guided saccade task. It began with the onset of a central fixation point. A target cue then appeared to one of eight concentric positions around the central cue. To obtain reward, the monkey had to make a saccade to the target.
Figure 1.
The arm countermanding task. Each trial begins when the cursor is positioned inside the center box. After a delay, the target box appears to one side of the screen and the center box disappears, instructing the monkey to move the cursor into the target box. On stop signal trials, the center box reappears after the SSD signaling that the monkey should cancel the planned movement. On the variable-reward version of the paradigm, the color of the center box indicates whether the trial will result in a high or low reward if performed correctly.
Behavioral analysis.
The relevant behavioral data for describing the inhibitory process in the countermanding task are (1) the inhibition function and (2) the reaction time distribution for the movements on trials with no-stop signals. The inhibition function plots the proportion of stop signal trials in which the subject generates a movement as a function of the delay between target onset and stop signal onset (the stop signal delay). The probability of erroneous initiation of the movement increases as stop signal delay increases. Performance on the countermanding task can be modeled as a race between a stochastic process that generates the movement (GO process) and a stochastic process that inhibits the movement (STOP process) (Logan and Cowan, 1984). The two processes race independently toward their respective thresholds. If the STOP process finishes before the GO process, the movement is not generated (canceled trials). However, if the GO process finishes before the STOP process, the movement is generated (noncanceled trials). This race model provides an estimate of the stop signal reaction time (SSRT), which is the time needed to cancel the planned movement. We estimated the SSRT using methods detailed previously (Hanes and Schall, 1995; Hanes et al., 1998). First, we used the method of integration, based on the assumption that SSRT is constant. We took the mean of the SSRTs calculated individually for each SSD. Second, we used a method based on the mean of the inhibition function. We calculated one SSRT estimate based on the raw behavioral data (i.e., the frequency of noncanceled trials for each SSD). We calculated two more estimates based on different fits of the inhibition function, using a Weibull function and a monotonic spline function. We obtained an overall estimate of SSRT by averaging over the four different estimates. The difficulty of controlling the movement generation can be adjusted parametrically by changing the stop signal delay. As a result, the monkey is fully engaged in the task but still generates a similar number of noncanceled, corrected, and canceled stop signal trials overall. The proportion of each type of stop trial will vary by SSD, however, which forms the basis of the inhibition function. In our calculations of the inhibition function, noncanceled and corrected trials are counted as incorrect, since the monkey incorrectly makes a movement in both of these trial types.
Single-unit recording.
After training, we placed a square chamber (20 × 20 mm) centered over the midline, 25 mm (monkey B) or 21 mm (monkey E) anterior of the interaural line. Single units were recorded using tungsten microelectrodes with an impedance of 2–4 MΩ. Data were collected using the Plexon system. Up to four template spikes were identified using principal component analysis, and the time stamps were then collected at a sampling rate of 1000 Hz. Data were subsequently analyzed off-line to ensure only single units were included in consequent analyses.
Cortical localization.
To determine the locations of the pre-SMA and SMA, we obtained magnetic resonance images (MRIs) for both monkeys (1.5 T). A three-dimensional model of the brain was constructed using Brain Voyager (Brain Innovation) and Rhinoceros (McNeel North America) (Fig. 2). The border of the SMA and pre-SMA was defined by the location of the branch of the arcuate sulcus. Neurons within the region 6 mm posterior to the arcuate branch and within 3.5 mm of the longitudinal fissure were designated as belonging to the SMA. Neurons within the region 5 mm anterior to the arcuate branch and within 3.5 mm of the longitudinal fissure were designated as belonging to the pre-SMA. The location of neuronal recording sites and the number of movement-related neurons is shown to the right of Figure 2. In monkey B, note the two clusters of arm movement-related neurons above and below the anterior–posterior level of the arcuate branch corresponding to pre-SMA and SMA, respectively (Fig. 2A).
Figure 2.
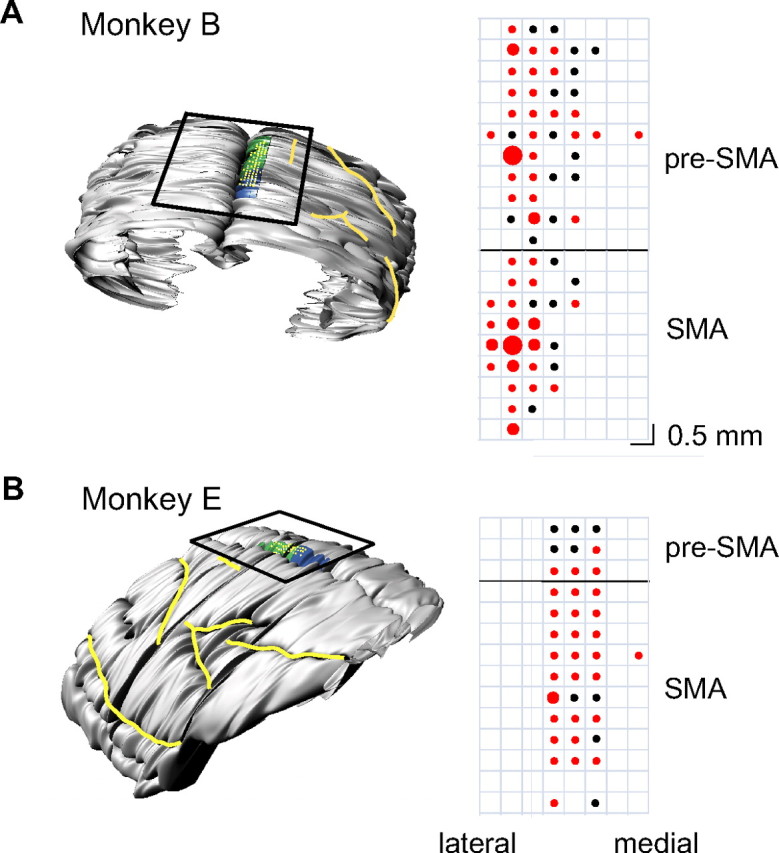
Localization of recording sites. A, A model of the brain for monkey B constructed from MRI slices showing the pre-SMA region highlighted in blue and the SMA region highlighted in green (left). Major sulci are outlined in yellow. The black box indicates the location of the recording chamber, and the yellow grid indicates the recording sites. A magnified version of the recording grid is shown to the right. The red circles indicate the position of movement-related neurons. The circle sizes indicate the number of neurons (large, 9–12 cells; medium, 5–8 cells; small, 1–4 cells). Penetrations that yielded no movement-related neurons are indicated by black dots. The horizontal black line indicates the location of the branch of the arcuate sulcus. B, Chamber location and recording sites from monkey E.
Identification of arm and eye movements.
The analog data from the handlebar was analyzed to find the beginning and end of arm movements. First, the position signal was smoothed by taking the average of every five data points. To determine movement onset, we first identified locations where there were five changes in handlebar position that were at most 25 ms away from one another. Movement onset was defined as the time at which the first of the 5 handlebar position changes occurred. We used this method instead of a velocity cutoff, since it allowed us to examine the velocity without requiring a specific speed to be reached. We found that the method very consistently identified the beginning of movement. Movement end was defined as the first point after movement onset where the position stayed constant for >40 ms. The analog data from the eye were much noisier than those from the handlebar. Data were smoothed by taking the average of every 20 data points and the velocity was examined. First, position changes over 150°/s were identified. Movement onset and end were then determined by moving backwards and forward in time from this maximum until a position change of <5°/s was identified. We visually inspected the movement start and end times for eye and arm movements that were found using these algorithms to ensure their accuracy.
Spike density functions.
To represent neural activity as a continuous function, we calculated spike density functions by convolving the spike train with a growth-decay exponential function that resembled a postsynaptic potential. Each spike therefore exerts influence only forward in time. The equation describes rate (R) as a function of time (t): R(t) = (1 − exp(−t/τg)) · exp(−t/τd), where τg is the time constant for the growth phase of the potential and τd is the time constant for the decay phase. Based on physiological data from excitatory synapses, we used 1 ms for the value of τg and 20 ms for the value of τd (Sayer et al., 1990).
Classification of neural signals.
We analyzed neural activity in three different epochs of the trial. For each period, t tests were performed on the spike rates in 20 ms intervals throughout the epoch time period, compared with a baseline period that consisted of the 500 ms before target onset. If values of p < 0.05 for three or more intervals during the time period, the cell was deemed to have activity significantly different from baseline. The first epoch consisted of the time between target onset and movement onset. The second epoch began 200 ms before movement onset and continued for 250 ms after movement onset. The third epoch was from 200 ms before movement end to 500 ms after the time reward was received. The activity of all cells was examined separately for movements to the right and left directions. Cells from each epoch were then further examined to allow for specific classification.
Movement-related cells contained activity that was significantly greater than baseline for three consecutive 20 ms intervals during the second task epoch. Activity changes on trials with movements to the right and left targets were analyzed separately. For a subset of these cells, the activity burst began to decline before movement onset. These cells were identified by visual inspection and were labeled as “early-onset” cells. A second group had movement onset times that occurred after the movement began in one or both directions. These cell directions were removed from the countermanding analysis, as they are unlikely to control the initiation of movement and, if included, would bias the percentage of neurons that fail to meet the criteria for controlling movement. A third group of movement-related cells decreased their activity during arm movements (suppressed cells) as indicated by a dip in activity during the movement period accompanied by three significant p values. Activity on the visually guided saccade task was also analyzed in a similar manner. Saccade cells had a burst of activity with two significant serial p values during the saccade period in at least one direction. Cells with saccade activity were removed from the potential movement-related group to ensure saccade-related activity did not bias arm movement-related responses. Visual cells had significant activity during the first task epoch on the saccade task when trials from all directions were combined. In all cases, we define the time of response onset as the middle time value of the first time bin that showed a significant difference.
Relationship to response generation and inhibition.
The logic of the stop signal paradigm sets two criteria a neuron must meet to play a causally sufficient role in the control of action. First, the neuron must discharge differently when a movement is initiated versus when it is canceled. Second, the difference in activity in response to the stop signal must occur before the stop signal reaction time. Thus, recording the activity of single neurons in this task allows us to determine whether these neurons generate signals that are sufficient to control the initiation or suppression of movements. Activity related to response initiation should decrease for successful cancelations, whereas activity related to inhibition should increase (Hanes et al., 1998).
The activity when a movement is canceled can be compared with the activity when a movement is produced, but would have been canceled if the stop signal had been presented. This comparison consists of successfully canceled trials and no-stop signal trials with reaction times greater than the stop signal reaction time added to the stop signal delay (latency-matched trials). The rationale is that the no-stop signal trials with reaction times exceeding the SSRT are those that afford enough time for the STOP process to finish before the GO process and on which the planned movement therefore would be canceled. We compared the spike rate on canceled and no-stop signal trials for movements to the right and left for each SSD. For the first SSD, we examined the time period from target onset to 500 ms after target onset in 20 ms time bins. For each subsequent SSD, we extended the time period by 100 ms to ensure modulation after all stop signals was detected. In particular, for longer stop signal delays, the number of canceled trials rapidly decreases. In order not to miss a potential activity difference despite the resulting reduction in statistical power, we lowered the criteria for a significant overall difference to at least two out of three consecutive 20 ms bins with a p < 0.05. For neurons with significant activity differences, we define the onset of this difference as the middle of the first bin that shows a significant difference. We refer to this time as the cancelation time. For each cell, cancelation times were identified for each SSD for movements in each direction separately. If the cancelation time occurred before the SSRT for any of these comparisons, the cell was deemed to have sufficient activity to play a causal role in initiation. Neurons tested with the variable reward version of the task were included in the analysis of the neuronal cancelation times.
Reward contingency.
Movement-related activity was examined for responses on return movements back to the central start location. To account for possible differences in movement velocity, only trials with movements from an overlapping velocity distribution were used. Activity on velocity-matched return movements was compared with velocity-matched baseline activity in 20 ms intervals and three significant p values were required for a cell to be classified as having potential return activity. A second criteria required activity for return movements on noncanceled trials to also be significantly different from baseline. Activity on corrected trials, in which return movements result in a reward, was also examined. Trials with an overlapping velocity distribution were used and activity during the movement period was compared with the baseline period. As the trial number was reduced, two p values were required to deem an activity difference significant.
In addition, we computed two indices to quantify the influence of reward on movement-related activity. The first index compared activity on rewarded movements (out to the target) with activity on nonrewarded movements (back to the center), during no-stop signal trials. We measured the mean neural activity during the outward movements (O) and during the return movement (R) from the opposite target that has the same direction as the outward movement and calculated the following contrast index: (O − R)/(O + R).
The second index compared activity of neurons on return movements that are rewarded (corrected trials) with activity on return movements that are not rewarded (no-stop signal trials). We measured the mean neural activity during the correction movements (C) and during the return movement (R) in the same direction and calculated the following contrast index: (C − R)/(C + R). For both reward contingency indices, positive values indicate greater activity during rewarded movements than nonrewarded movements.
EMG signals.
For all EMG recordings, 60 Hz noise was removed and activity was then filtered using a fourth-order Butterworth filter with a low-pass filter at 30 Hz. Muscle activity was analyzed in the same manner as the neurons using the mean filtered activity across trials for each recording session. Activity onset times for movements in both directions were computed based on a comparison of activity during the movement and baseline periods.
Results
Behavior
The behavioral findings from the countermanding paradigm are shown in Figure 3. Figure 3A shows the response time distribution from an example session from monkey B (left; mean response time, 410 ms; SD, 68 ms) and the inhibition function for this recording session (middle). The SSRT obtained from these data was 141 ms. The velocity distribution aligned on movement onset is also shown for the recording session for movements to the right and left targets (Fig. 3A, right; movements to the right indicated by a positive deflection, and movements to the left indicated by a negative deflection). The response time distributions and inhibition functions across all recording sessions are shown in Figure 3, B (monkey B) and C (monkey E). The mean response time across all sessions was 400 ms (SD, 40 ms) for monkey B and 430 ms (SD, 66 ms) for monkey E. The mean SSDs used for monkey B were 126 ms (range, 120–130 ms), 215 ms (205–220 ms), 299 ms (290–310 ms), and 285 ms (375–400 ms). The SSDs used for monkey E were 150, 240, 330, and 420 ms and remained the same across all sessions. On the far right of Figure 3, B and C, is shown the mean proportion of each type of stop trial by SSD for monkey B (Fig. 3B) and monkey E (Fig. 3C) (red, canceled trials; blue, corrected trials; green, noncanceled trials; monkey B: canceled, 0.92, 0.73, 0.28, 0.11; noncanceled, 0.04, 0.08, 0.25, 0.69; corrected, 0.04, 0.19, 0.47, 0.20; monkey E: canceled, 0.94, 0.60, 0.21, 0.10; noncanceled, 0.01, 0.08, 0.37, 0.66; corrected, 0.05; 0.33, 0.42, 0.24). The distribution of overall SSRT estimates obtained from the response time distributions and inhibition functions of each recording session are shown in Figure 3, D (monkey B) and E (monkey E). Table 1 indicates the average SSRT estimates of the four different methods for both monkeys. The mean SSRT for monkey B was 139 ms, and for monkey E was 138 ms. These numbers are slightly longer than the mean SSRT (90 ms) obtained in saccade versions of the countermanding task. The difference is likely attributable to mechanical differences between the two effector systems or a longer afferent delay of the visual stimulus to the skeletal-motor system.
Figure 3.
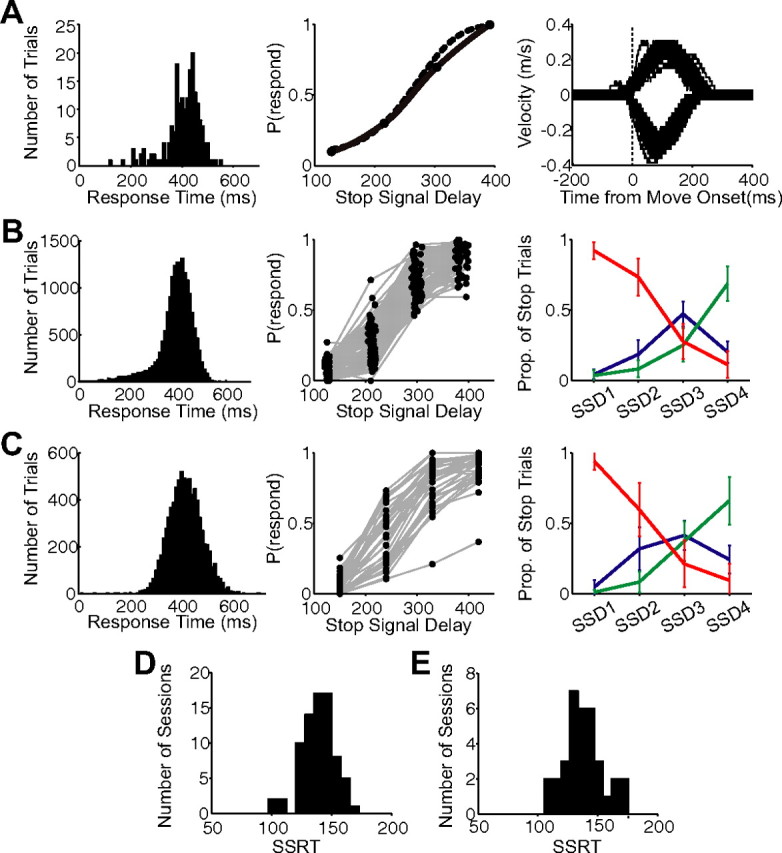
Behavior. A, The behavioral data from an example session from monkey B: response time distribution (left), the inhibition function for this recording session (middle; estimation based on a Weibull fit indicated by a dotted line, and estimation based on a monotonic spline fit indicated by a solid line), and the velocity distribution aligned on movement onset (right; movements to the right indicated by a positive deflection, and movements to the left indicated by a negative deflection). B, C, The behavioral data across all recording sessions for monkey B (B) and monkey E (C): the response time distributions (left), inhibition functions (middle), and mean proportion of each type of stop trial by SSD (right; red, canceled trials; blue, corrected trials; green, noncanceled trials). D, E, The distribution of overall SSRT estimates obtained from the response time distributions and inhibition functions of each recording session for monkey B (D) and monkey E (E).
Table 1.
Average stop signal reaction times for the two monkeys
| Subject | Integration |
Mean of the inhibition function |
||||||
|---|---|---|---|---|---|---|---|---|
| 1st SSD (ms) | 2nd SSD (ms) | 3rd SSD (ms) | 4th SSD (ms) | Mean (ms) | Raw (ms) | Weibull (ms) | Spline (ms) | |
| Monkey B | 174 | 159 | 142 | 95.7 | 142.7 | 92.8 | 147 | 146 |
| Monkey E | 201 | 169 | 147 | 106 | 155.8 | 106 | 164 | 163 |
The first five columns relate to the method of integration. They list the SSRT calculated individually from the first four stop signal delays and their mean value. The next three columns relate to three different estimates based on the mean of the inhibition function. They list the SSRTs calculated from the raw behavioral data, from fitting the data with a Weibull function and from fitting the data with a monotonic spline.
Neuronal data set
The activity of 414 neurons was recorded from the SMA and pre-SMA in the left hemispheres of two rhesus monkeys while they performed an arm movement countermanding task (Fig. 1). We recorded the activity of 158 pre-SMA and 197 SMA cells that had activity related to at least one task epoch (see Materials and Methods). Of these, 74% (117 of 158) of pre-SMA cells and 76% (150 of 197) of SMA cells were found to have activity that was significantly different from baseline during the movement period, and did not show saccadic activity on a simple saccade task. We will refer to these 267 SMA and pre-SMA neurons as movement-related cells. A similar number of SMA neurons were recorded in each of the two monkeys (monkey B, 87; monkey E, 63), but the majority of pre-SMA neurons were recorded in one of the animals (monkey B, 105; monkey E, 12). In addition, we found 12 SMA and pre-SMA neurons that showed no significant activity modulation during movements but that had higher activity during canceled trials. Together, these 279 neurons form the data set for the analyses described in this paper.
Movement-related activity in the pre-SMA and SMA
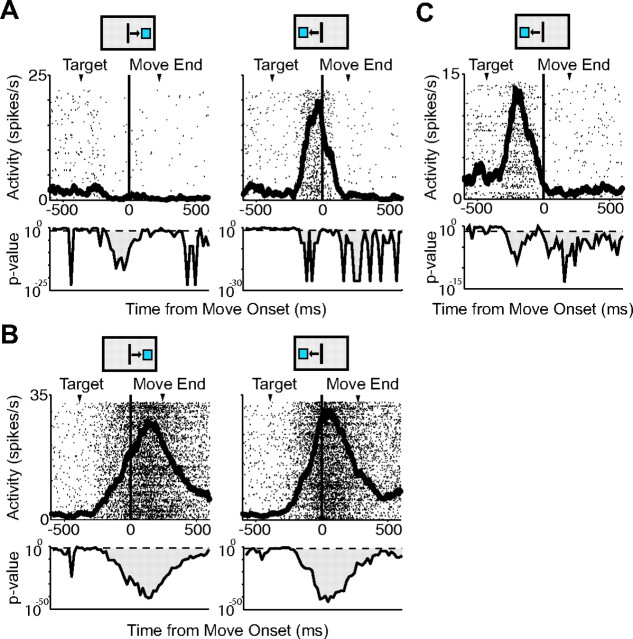
The majority of the movement-related cells showed an increase in activity during the movement period (pre-SMA: 89%, 104 of 117; SMA: 89%, 133 of 150). There was no significant difference in the number of movement-related cells in the two areas (χ2 test, p = 0.95). Some neurons showed a decrease in activity during the time of movement (pre-SMA: 11%, 13 of 117; SMA: 11%, 17 of 150) (Table 2). We found many neurons that showed significant changes in activity for movements only in one direction (pre-SMA: 30%, 35 of 117; SMA: 22%, 33 of 150) (Fig. 4A). The majority of cells, however, showed significant changes in activity for movements both to the right and left. We refer to these as bidirectional movement cells (pre-SMA: 70%, 82 of 117; SMA: 78%, 117 of 150) (Fig. 4B). A number of the bidirectional cells had significantly more activity in one direction. The bidirectional cell in Figure 4B is an example of a cell that exhibits this directional effect (pre-SMA: 66%, 77 of 117; SMA: 68%, 102 of 150). Thus, overall, the majority of cells are directionally tuned, although many cells are active for movements in both directions. A subset of the movement-related cells exhibited activity peaks that were closely tied to movement onset but occurred before the arm movement began. This was not a visual response, as the cells did not show activity before eye movements in the simple saccade task. We refer to these neurons as early-onset movement cells (Fig. 4C). There were significantly more early-onset cells in the pre-SMA (26% of movement-related cells; 31 of 117) than in the SMA (15%; 22 of 150; χ2, p < 0.01). In addition, the onset of movement-related activity in the pre-SMA was significantly earlier than that in the SMA (pre-SMA, 158 ms before movement onset; SMA, 116 ms before movement onset; t test, p > 0.05).
Table 2.
Neuron types in recording sample
| Area | Movement related |
Cancelation related |
|||||
|---|---|---|---|---|---|---|---|
| Increased |
Decreased | All | |||||
| Regular | Early onset | CT before SSRT | CT after SSRT | All | |||
| Pre-SMA | 73 | 31 | 13 | 117 | 5 | 17 | 22 |
| SMA | 111 | 22 | 17 | 150 | 2 | 16 | 18 |
Movement-related neurons have activity that is significantly different from baseline during the movement period. Cancelation-related neurons have higher activity during canceled trials than noncanceled trials. We divided them by whether their cancelation time (CT) was before or after the SSRT. Some movement-related neurons with decreasing activity were also classified as cancelation related.
Figure 4.
Movement-related cells. A, Spike density function for a movement-related cell from the SMA active for movements to the right target, but not for movements to the left target. Spike density functions are shown overlaying raster plots. Results of t tests performed on movement-related activity compared with baseline activity in 20 ms intervals are shown below each spike density function. The dotted horizontal line indicates p = 0.05 boundary. B, Movement-related cell from the SMA with bidirectional activity. C, Spike density function for a pre-SMA cell showing early-onset activity. The arrowheads mark the average time of target onset and movement end. The black box above each plot indicates the movement direction.
Movement-related activity is not sufficient to control arm movement initiation
It has been suggested that neuronal activity in pre-SMA and SMA plays a critical role in the initiation or suppression of goal-directed movements. Here, we test this hypothesis directly by examining the time course of the movement-related activity in the countermanding task. This task provides two criteria that allow for the identification of neural activity that is sufficient to control movement initiation or inhibition. First, neurons must show an activity difference when a movement is initiated versus when it is suppressed. In the countermanding task, the neuron must therefore change its activity when a movement that is in preparation is successfully canceled. Second, this change in activity must occur before the SSRT, which represents an estimate of the time that is necessary to complete the cancelation. We compared activity on canceled trials to that on the latency-matched no-stop signal trials. Activity was aligned on the time at which the go signal (the target box) appeared. Because the stop signal appears at different times, we analyzed the activity on canceled trials separately for each SSD and movement direction. For each SSD, we identified no-stop signal trials with a reaction time greater than the SSD added to the SSRT. These trials, which we termed latency-matched no-stop signal trials, could have been canceled if a stop signal had been presented, because movement was initiated after the estimated amount of time it took the STOP process to finish.
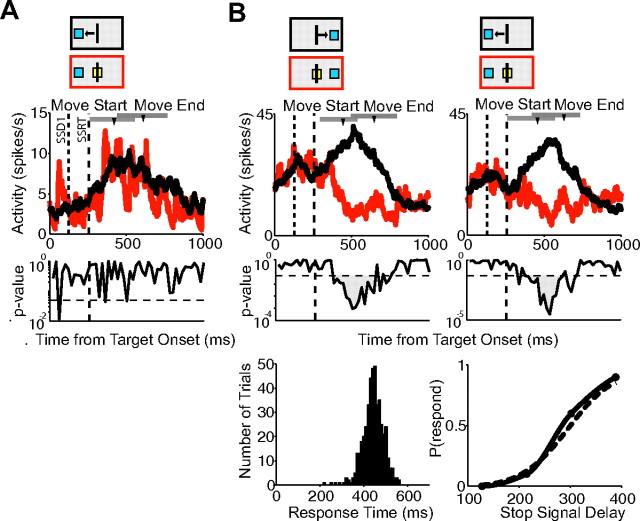
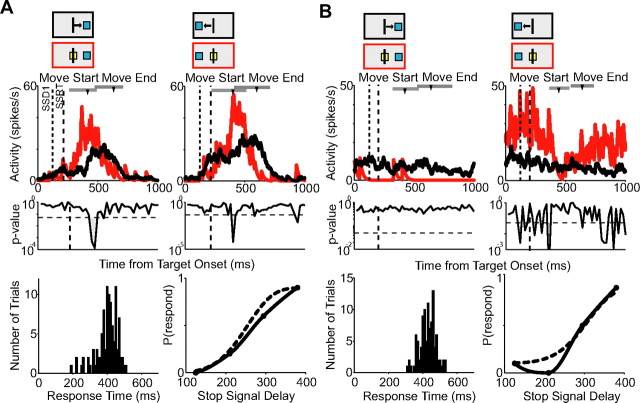
For this analysis, we included only neurons whose activity onset on no-stop signal trials and canceled trials preceded movement onset (pre-SMA, 107 cells; SMA, 136 cells). To our surprise, we found that almost none of these pre-SMA and SMA cells carried a signal that was sufficient to control movement initiation. The majority of cells did not change their activity when the arm movement was canceled. In the pre-SMA, 74% of this group of movement-related cells (79 of 107) did not show a significant difference on latency-matched no-stop signal trials and canceled trials. In the SMA, 83% of cells (113 of 136) failed to show a significant difference. The SMA neuron shown in Figure 5A is an example of this activity pattern. The reaction time distribution and inhibition function for the recording session are shown below (mean response time, 388 ms; SSRT, 155 ms).
Figure 5.
Movement-related activity on canceled trials. A, Spike density functions for canceled trials (red) and latency-matched no-stop signal trials (black) showing no significant difference for one SMA cell for movements to the right and left targets. The first dotted line represents the SSD. The second dashed line represents the SSRT. B, Activity from a pre-SMA cell showing a difference in activity on latency-matched no-stop signal and canceled trials for the first SSD for movements to the right and left. Cancelation time occurs after the SSRT boundary for both plots. The response time distribution and inhibition function for the recording session are shown below. The inhibition function is estimated using a Weibull (dotted line) and monotonic spline (solid line) fit. Mean response time, 448 ms; SSRT, 150 ms. The arrowheads mark the average time of movement start and end. The range is indicated by the gray bar. The red and black boxes above each plot indicate the type of trial, the target location, and the movement direction (for no-stop signal trials).
Second, except for one SMA cell, all the neurons that did show an activity difference when movements were canceled, exhibited this change after the SSRT. The pre-SMA neuron shown in Figure 5B is an example of this activity pattern. This cell slowly increased its activity on no-stop signal trials (black line). On canceled trials (red line), this buildup of activity stopped and the activity decreased. We will refer to the time when this difference first reaches significance as the cancelation time. The cancelation time follows the SSRT (dashed line) for all SSDs (dotted line). Results for the first SSD for movements to the right and left are shown in Figure 5B along with the reaction time distribution and inhibition function for the recording session (mean response time, 448 ms; SSRT, 150 ms). Across all pre-SMA and SMA movement-related neurons, the cancelation time occurred on average 132 ms (SD, 60 ms) after the SSRT. According to the countermanding paradigm, the conclusion we can draw is that the activity of these cells is not sufficient to determine whether a movement is initiated or not.
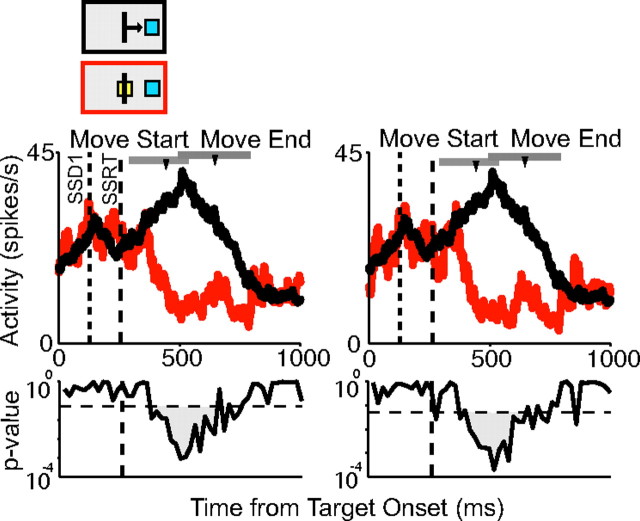
In contrast to saccades, skeletomotor movements are not ballistic. In our analysis, a movement was considered canceled if the cursor did not exit the center box. We thus considered the possibility that very small movements might be made on canceled trials that biased the cancelation time. The comparison of activity on no-stop signal and canceled trials was therefore repeated with only those canceled trials in which there was no change in handlebar position (Fig. 6). None of the neurons had a cancelation time that was before the SSRT when small movements were eliminated. We required at least five remaining canceled trials for the adjusted comparison. There were enough trials to perform this analysis on 211 movement-related cells (96 pre-SMA and 115 SMA). Only 6% of cells (13 of 211) showed a difference on no-stop signal trials and canceled trials and the cancelation time was on average 187 ms (SD, 48 ms), 55 ms later than the average cancelation time in the previous analysis. Thus, very small movements made on canceled trials do not appear to explain the late cancelation time.
Figure 6.
Control for small movements during canceled trials. Spike density functions for canceled trials (red) and latency-matched no-stop signal trials (black) for the first SSD (left). The neuron is the same pre-SMA neuron as illustrated in Figure 5B. Even when small movements are removed (right), the cancelation time still occurs after the SSRT boundary (dotted line). Conventions are as in Figure 5.
In addition, we also recorded some cells in the arm countermanding task that showed saccade-related activity in the visually guided saccade task (9 pre-SMA and 13 SMA). None of these neurons showed activity that was sufficient to control arm movement initiation or inhibition.
Movement-related activity and the control of arm movement inhibition
Some neurons showed significantly higher activity on canceled trials than on no-stop signal trials (pre-SMA: 14% task related, 22 of 158; SMA: 9%, 18 of 197) and thus could play a role in stopping movement (Fig. 7). The majority of these neurons showed a significant decrease of activity during movements and was also classified as movement-related cells (16 of 22 overlapped in pre-SMA; 10 of 18 in the SMA). We examined these cells to determine whether they exhibited activity that was causally sufficient to control movement inhibition. For the majority of single pre-SMA (77%; 17 of 22) and SMA (89%; 16 of 18) neurons, the activity increase followed the SSRT (Fig. 7A). These neurons cannot be causally responsible for the suppression of the arm movement on canceled trials, but we cannot rule out an inhibitory function of these neurons in general. For example, they might be recruited at a later stage to sustain the inhibition of particular responses. Alternatively, they may play an evaluative role, signaling conflict because of competing go and stop demands (Stuphorn et al., 2000). Future work will help distinguish potential roles. A small subset of cells with higher activity on canceled trials appeared to have activity that was sufficient to play a causal role in movement inhibition. In the pre-SMA, 23% (5 of 22) of the cells with higher activity on canceled trials had cancelation times before the SSRT, and in the SMA, 11% (2 of 18) showed this early difference time (Fig. 7B). All neurons that showed the early difference did so only for one of the two movement directions. Thus, the pre-SMA/SMA region may play a role in response inhibition.
Figure 7.
Inhibition neurons. A, SMA cell with a possible role in stopping movement. Activity on canceled trials (red) and latency-matched no-stop signal trials (black) is shown demonstrating a larger canceled response. Response becomes significant after the SSRT. Mean response time, 406 ms; SSRT, 126 ms. B, Pre-SMA cell that could be involved in inhibiting movement. Cancelation time falls before the SSRT boundary. Cancelation time occurs before the SSRT boundary for leftward movements. Mean response time, 433 ms; SSRT, 116 ms. Conventions are as in Figure 5.
Muscle activity in the countermanding paradigm
We recorded EMG activity from six different arm muscles: two shoulder muscles (pectoralis, deltoid), two arm muscles (biceps, triceps), and two wrist muscles (ECR, FCR). The two shoulder muscles acted as an agonist/antagonist pair. The deltoid was active for movements to the right, but not for movements to the left (Fig. 8A), whereas the pectoralis is active for movements to the left, but not the right (Fig. 8B). The ECR and FCR showed a similar agonist/antagonist pattern (Fig. 8C,D). In contrast, the triceps and biceps both showed predominant activity for leftward movements in this task (Fig. 8E,F).
Figure 8.
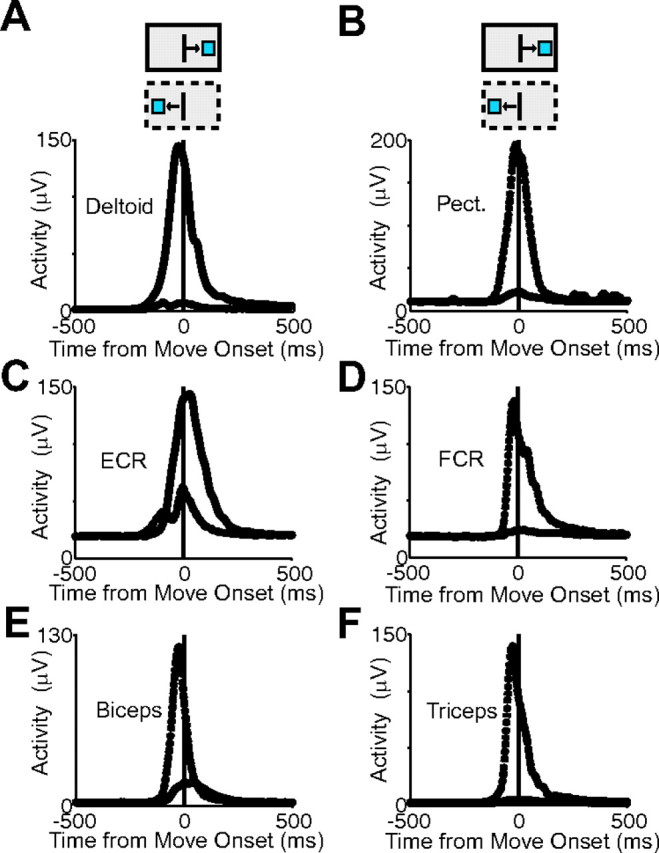
Muscle activity. A, Average activity for deltoid for one recording session. The solid line indicates activity for movements toward the right target, and the dotted line indicates activity for movements toward the left target. B, Pectoralis activity showing large leftward response. C–F, Activity of ECR, FCR, biceps, and triceps showing activity for preferred and nonpreferred directions. The solid and dotted boxes above each plot indicate the movement direction.
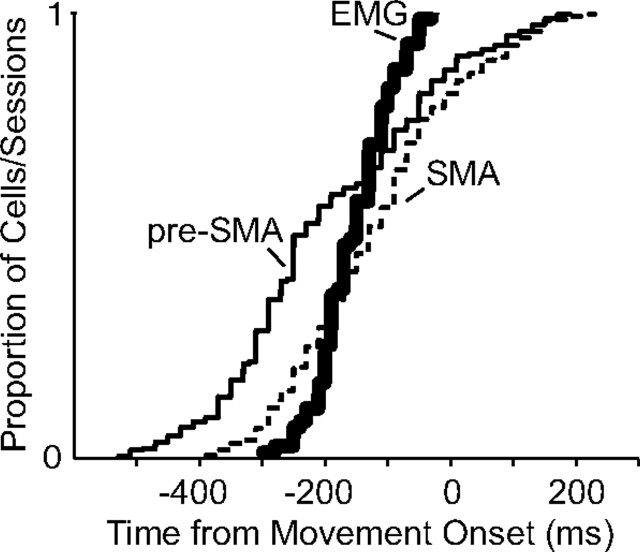
For a neuron to be causally involved in initiating movement, it must activate either directly or indirectly the muscles needed to carry out the movement, and thus, by definition, the neural activity must precede the muscle activity. EMG activity for the six different muscles was therefore examined on a subset of recording sessions to compare the timing of the onset of movement activity with the onset of muscle activity. On average, the pre-SMA activity began 4 ms before the muscle activity, whereas the SMA activity followed the muscle activity by 38 ms (muscles, 154 ms; pre-SMA, 158 ms; SMA, 116 ms before movement onset) (Fig. 9). However, the subset of movement-related neurons that became active before movement onset preceded the muscle activity onset (pre-SMA, 201 ms; SMA, 158 ms before movement onset). Onset times of the individual muscles ranged from 95 to 185 ms before movement onset (Table 3). The triceps and biceps were the last two muscles to be active. These two muscles seem to be mostly responsible for supporting the ongoing arm movement by increasing arm stiffness.
Figure 9.
Onset time distribution of neural and muscle activity. The thin solid line indicates onset times of movement-related pre-SMA neurons (mean, 245 ms before movement onset). The thin dashed line indicates onset times of movement-related SMA neurons (mean, 188 ms before movement onset). The thick line indicates onset times of all muscles (mean, 154 ms before movement onset).
Table 3.
Muscle onset times
| Muscle | Onset time (ms) | n = |
|---|---|---|
| Biceps | −106 | 11 |
| Triceps | −95 | 8 |
| Pectoralis | −159 | 11 |
| Deltoid | −185 | 10 |
| Flexor carpi radialis | −137 | 15 |
| Extensor carpi radialis | −165 | 15 |
Onset times for the muscle activity of six different arm muscles relative to the time of cursor movement onset. The number of recording sessions is shown to the right (n).
We applied the same countermanding analysis to the EMG recordings that we used to analyze the activity of movement-related neurons. All muscles showed either decreased activity on canceled trials or were never activated at all. Across all muscles, the cancelation time occurred on average 0.3 ms after the SSRT. In principle, there are two different ways in which an arm movement could be canceled. One possibility is that the excitatory drive of agonist muscles is reduced, so that the force levels are insufficient to move the arm. In this case, the neurons that drive the muscles would also stop their activity increase and instead decrease their activity, in a manner similar to saccadic movement cells in the frontal eye field and superior colliculus (Hanes et al., 1998; Paré and Hanes, 2003). Alternatively, antagonist muscles could be activated to block the effect of agonist muscle activation. In this case, the neurons that drive the agonist muscles would not have to reduce their activity, but neurons that drive antagonist muscles would increase their activity. The EMG recordings clearly show that, in our task, movement generation is stopped by relaxing the agonist muscle before it reaches an activity level sufficient for movement initiation. There is no evidence for cocontraction of antagonist muscles to prevent the arm movement. Figure 10 shows the response of the two agonist/antagonist muscle pairs on no-stop signal trials and canceled trials for movements to the right and to the left. For each pair, we see activity on movements only in one direction and little or no response on canceled trials. It is therefore very unlikely that the early increase in neural activity observed for some neurons on canceled trials is attributable to the activation of a muscle antagonist.
Figure 10.
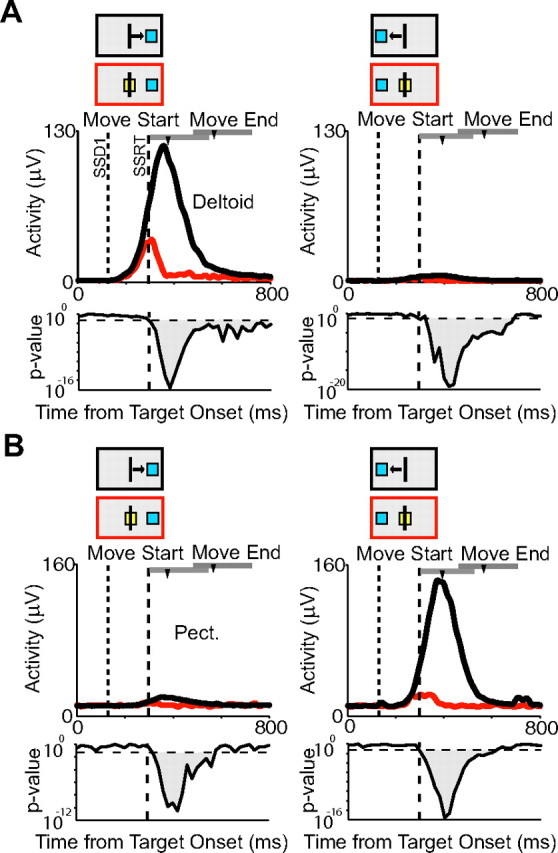
Muscle activity on canceled trials. Deltoid (A) and pectoralis (B) activity on latency-matched no-stop signal trials (black) and canceled trials (red) for the first SSD. The first column shows activity for targets shown to the right, and the second column shows activity for targets shown to the left. Conventions are as in Figure 5.
Comparison of cancelation time for neurons and muscles
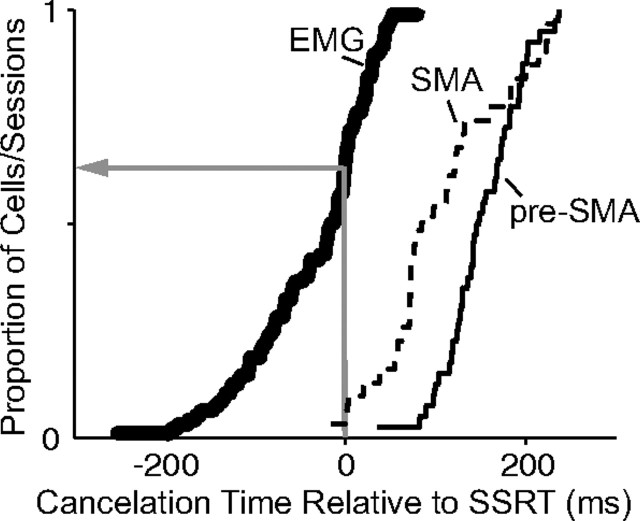
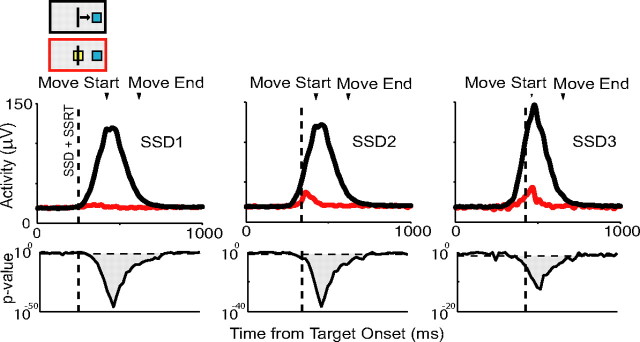
Next, we compared the cancelation times of neurons and muscles to determine the relative timing of their respective activity changes. This comparison allowed us to circumvent uncertainty in the estimation of the SSRT, since the same estimate was used for both populations. For this comparison, we excluded the recordings from biceps and triceps, since these two muscles did not appear to belong to the primary drivers of the arm movement we used in our experiment. The EMG activity of the remaining agonist/antagonist pairs typically showed a rapid rise immediately before movement onset (see Fig. 12). However, the sum of short SSDs and SSRT was often so early relative to movement onset that, on canceled trials, the muscle never showed any significant activation. During such trials, the cancelation could only manifest itself late in the trial when the EMG activity that normally would have occurred was absent, as illustrated in the panels on the left of Figure 11. In this situation, the cancelation time was erroneously determined to be after the SSRT. To avoid such artifacts, we only calculated the cancelation time for those SSDs in which there was significant EMG activity on canceled trials. To ensure a fair comparison, we used the same activity criterion in the case of neural activity.
Figure 12.
Comparison of muscle and neural cancelation times. Cumulative proportion of recording sessions from pre-SMA neurons (solid thin line), SMA neurons (dashed thin line), and muscles (thick line) with cancelation times relative to the SSRT boundary. The red arrow points to the proportion of muscle cancelation times before the SSRT (0.68). For the pre-SMA neurons and SMA neurons, this proportion is 0 and 0.3, respectively.
Figure 11.
Muscle activity on canceled trials with different SSD. Activity for the extensor carpi radialis muscle on latency-matched no-stop signal trials (black) and canceled trials (red) for three SSDs. The cancelation time becomes progressively earlier for each SSD. The SSRT boundary is shown as a dotted line. Conventions are as in Figure 5.
In some recordings, the EMG activity begins to show differences at the very onset of activation, as illustrated in the panels on the right of Figure 11. In those cases, the muscle cancelation time is calculated to coincide with the beginning of muscle activity. This likely reflects some early inhibitory process that suppresses the recruitment of motor neurons and thus prevents the muscle from exerting sufficient force to initiate the movement. It is possible that the onset of this inhibitory process is even earlier than the onset of muscle activity. In this case, our estimation of muscle cancelation time would be later than the actual one. However, such a shift would not affect a direct comparison of muscle and neuronal cancelation times.
A comparison of the muscle and neuron cancelation times across SSDs and sessions is shown in Figure 12. The neural activity change clearly occurred after the SSRT and followed the muscle activity change. The average cancelation time for the muscles was 25 ms before the SSRT, whereas the average cancelation time for the neurons was 132 ms after the SSRT (pre-SMA: 152 ms; SD, 43 ms; SMA: 106 ms; SD, 69 ms). The majority of muscle cancelation times (68%; 49 of 72), but only a minority of neuronal cancelation times (pre-SMA: 0%, 0 of 40; SMA: 3%, 1 of 31) preceded the SSRT boundary. Thus, the movement-related neurons in pre-SMA and SMA clearly could not be responsible for the change in EMG activity on canceled trials.
Reward-contingent movement neurons
A fundamental aspect of goal-directed behavior is the expected outcome of the behavior. We observed that many movement-related cells were only active during movements toward a target that would result in a potential reward. Return movements made back to the center location did not elicit a burst of activity. An example of this pattern of activity is shown in Figure 13A. The majority of movement-related neurons in pre-SMA (100 of 117 cells; 85%) and SMA (102 of 150 cells; 68%) had activity only on movements directed toward a rewarded target but did not exhibit activity significantly different from baseline when movements were made back to the center box. We refer to these cells as reward-contingent movement neurons. The number of reward-contingent movement cells was significantly higher in the pre-SMA than in the SMA (χ2 test, p < 0.001).
Figure 13.
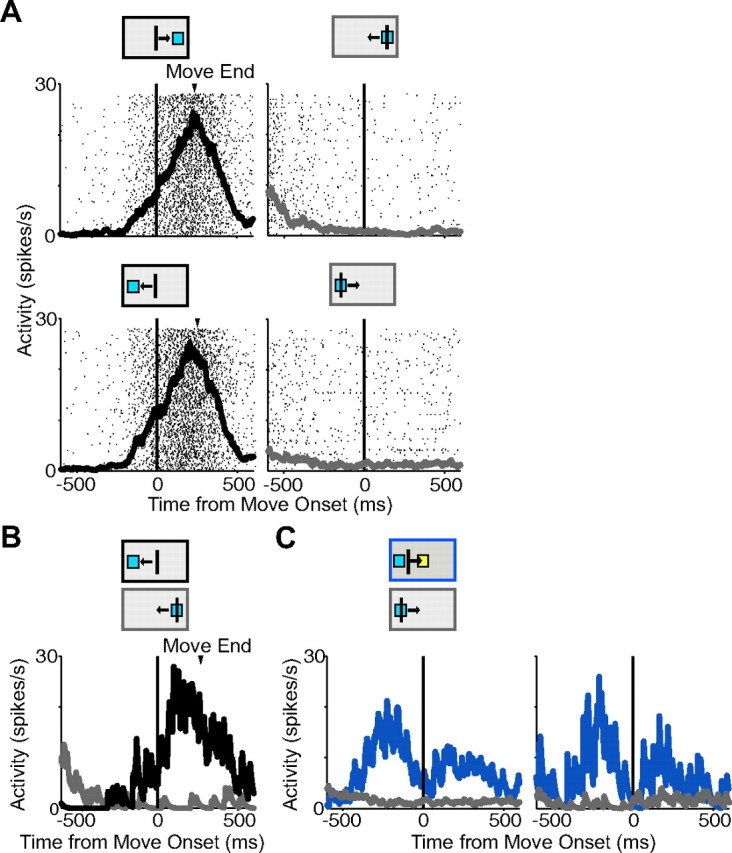
Reward-contingent movement cell. A, Movement-related cell from the SMA showing activity for rightward movements to the target (black; top left) but no activity for movements back to the center (gray; top right). This cell also has activity for movements toward the left target (black; bottom left) but again has no return movement activity (gray; bottom right). B, Activity for the same cell for movements to the left target (black) and back from the right target (gray) from an overlapping velocity range. C, Activity for return movements for no-stop signal trials (gray) and corrected trials (blue) showing that the cell has return activity only for rewarded movements. Activity from an overlapping velocity distribution is shown on the right. The arrowhead marks the average time of movement end. The black, gray, and blue boxes above the plots show the type and direction of movement.
Movements toward the target and back to the center were not always made with equal velocities. To control for the possibility that activity differences were attributable to differences in velocity, we selectively compared target driven and return movements from trials with an overlapping velocity distribution. Figure 13B shows the difference in activity for the same neuron shown in Figure 13A on trials from on overlapping velocity distribution for movements toward the left target and back from the right target to the center location.
We next examined how these cells responded on corrected trials, in which the return movement does result in reward. Notably, significant return activity was observed on corrected trials for 31% of reward-contingent pre-SMA neurons (31 of 100 cells) and 21% (21 of 102) of reward-contingent SMA neurons. In Figure 13C, left, activity for the same example cell is shown demonstrating no rise in activity for return movements from the left target back to the center location (gray), but a rise in activity for the same movement on corrected trials (blue). The difference in response is maintained when only activity on trials from an overlapping velocity distribution is compared (Fig. 13C, right).
The majority of reward-contingent cells in both the pre-SMA (66 of 100; 66%) and SMA (66 of 102; 65%) had directional movement-related activity. The proportion of directional cells was not significantly different for reward-contingent and non-reward-contingent neurons across all pre-SMA and SMA neurons (Table 4) (χ2 tests: pre-SMA, p = 0.92; SMA, p = 0.63). Thus, most reward-contingent movement cells are not likely to represent a general arousal or motivation signal. Instead, they seem to carry a signal that is selective for arm movements in specific directions.
Table 4.
Distribution of directionality and reward contingency across pre-SMA and SMA
| Reward contingent |
Not reward contingent |
Total | |||
|---|---|---|---|---|---|
| Directional | Nondirectional | Directional | Nondirectional | ||
| Pre-SMA | 66 | 34 | 9 | 8 | 117 |
| SMA | 66 | 36 | 35 | 13 | 150 |
| Total | 132 | 70 | 44 | 21 | 267 |
These findings were in contrast to the behavior of the muscles. When EMG activity was examined for movements to and from the targets, we observe directional activity independent of reward expectation. Figure 14A shows an example recording from the deltoid muscle, which was active for rightward movements to the target (top, left, black) (Fig. 8A). In contrast to the reward-contingent neurons, the muscle was also active for rightward movements back from the left target (bottom, right, gray). A direct comparison of EMG activity from trials with an overlapping velocity distribution indicates a similar, but not identical activation pattern of the muscle for movements in the same direction, but in different parts of the workspace (Fig. 14B). Likewise, the EMG activity for rightward return movements is similar for corrected trials (blue) and for no-stop signal trials (gray) (Fig. 14C).
Figure 14.
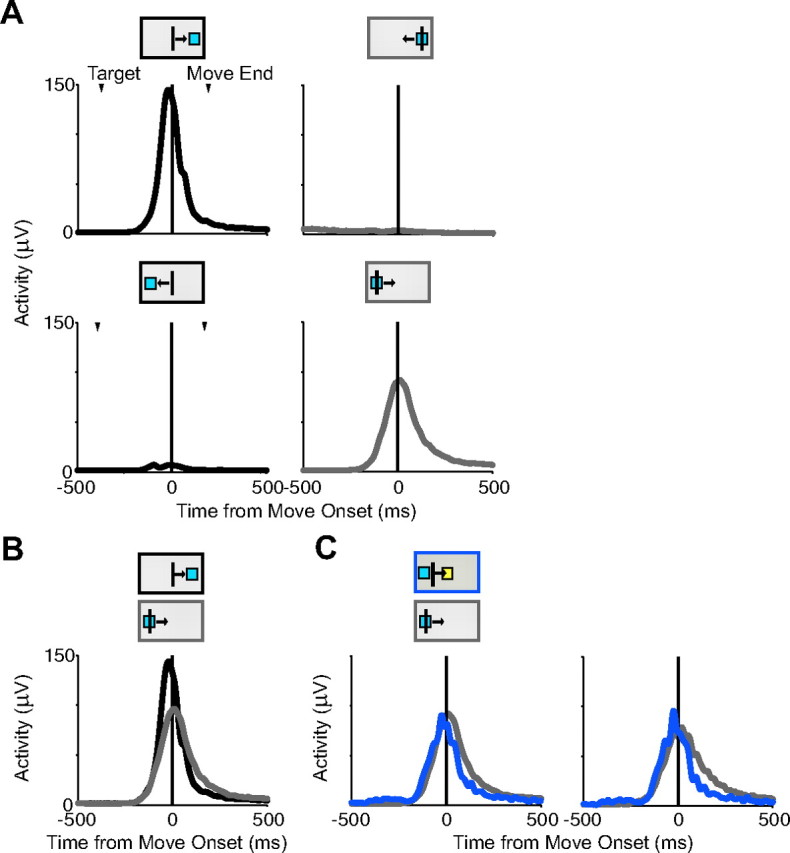
Muscle activity on corrected trials. Deltoid activity for one recording session is shown in the same format as neural activity in Figure 11. A, Activity for movements to (black) and from (gray) the right target (top row) and movements to and from the left target (bottom row) illustrating direction-specific activity. B, Activity for movements to the right target (black) and back from the left target (gray) from an overlapping velocity range. C, Activity for return movements for no-stop signal trials (gray) and corrected trials (blue) showing return activity for both types of trials. Activity from an overlapping velocity distribution is shown on the right. Conventions are as in Figure 13.
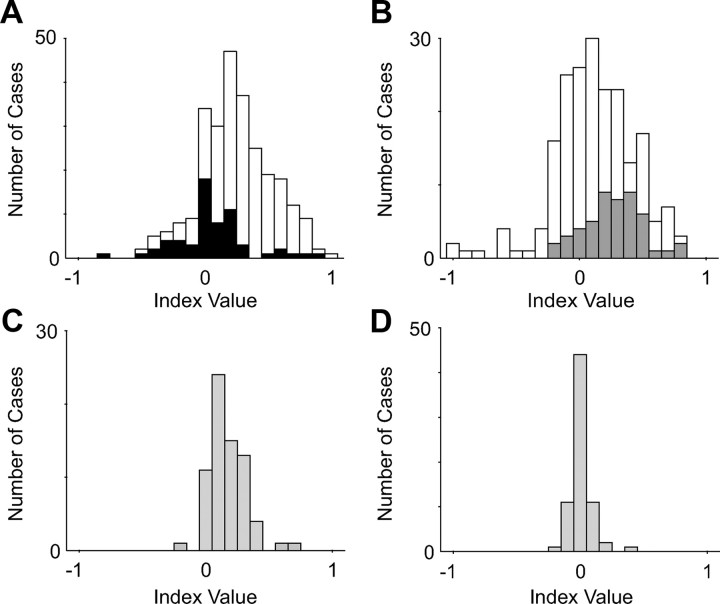
To further examine how reward affected movement-related activity across the population of movement neurons, we calculated two indices. The first index (Fig. 15A) looked at the difference in activity for outward rewarded movements (O) and return movements that are unrewarded (R): (O − R/O + R). The reward-contingent movement cells (white bars), which have no significant return movement activity, had a significant positive mean index (mean index value, 0.30; SD, 0.27; t test, p < 10−36). This indicated that they were much more active for rewarded than for nonrewarded movements. In contrast, the movement-related cells (black bars) that also showed significant activity for nonrewarded movements had a mean index that was not significantly different from zero (mean index value, 0.05; SD, 0.25; t test, p = 0.16). The difference in means between the two distributions was highly significant (t test, p < 10−8). We therefore concluded that the reward-contingent neurons could be treated as a separate population of cells. The second index (Fig. 15B) compared the return movement activity of the reward-contingent cells on rewarded corrected trials (C) and nonrewarded no-stop signal trials (R): (C − R/R + C). As expected, the neurons that showed significant activity on corrected trials (dark gray bars) had a significant positive mean index value (mean index value, 0.27; SD, 0.23; t test, p < 10−9). However, the neurons that showed no significant activity on either type of return movement (white bars) had a much larger variance and a mean index close to but still significantly different from zero (mean index value, 0.04; SD, 0.34; t test, p = 0.01). These values likely reflect the higher noise levels inherent in the activities on which the index calculation is based. The difference in means between the two distributions was significant (t test, p < 0.001).
Figure 15.
Effect of reward on movement-related activity. A, Distribution of index values that describe the relative difference in activity for movements in the same direction that are made toward a target (rewarded movement) and back to the center (nonrewarded movement). Positive values indicate greater activity for rewarded movements. Each movement-related neuron contributes one index value. Index values for neurons with significant activity only for rewarded movements are shown in white. B, Distribution of index values that describe the relative difference for return movements that are not rewarded (no-stop signal trial return movements) and return movements that are rewarded (corrected trial return movements). Only reward-contingent movement cells are shown. Positive values indicate greater activity for rewarded movements. Cells with significant activity for return movements on corrected trials are shown in dark gray. C, Same index as shown in A for muscle activity. D, Same index as shown in B for muscle activity.
For comparison, we also computed the two indices for the muscle activity (light gray bars). In the case of the first index (Fig. 15C), the mean index value of the muscles was significantly positive (mean index value, 0.17; SD, 0.14; t test, p < 10−14). The positivity of the index likely reflects the finding that the muscle activity during outward movements tends to be higher than that during return movement (Fig. 14B). Nevertheless, the mean index of the reward-contingent neurons was significantly larger than the one for the muscles (t test, p < 0.001). In contrast, the return movement activity on corrected trials (which is rewarded) was similar to that on no-stop signal trials (which is not rewarded) (Fig. 14C). Accordingly, in the case of the second index (Fig. 15D), the mean index value of the muscles was not significantly different from zero (mean index value, 0.01; SD, 0.08; t test, p = 0.35) and significantly smaller than the index value of the reward-contingent neurons with significant activity on corrected trials (t test, p < 10−12). Together, the two indices of reward modulation confirmed our classification based on the significance tests.
If the movement-related activity were contingent on the outcome of the movement, we should also see a difference in activity for trials when the monkeys made an erroneous movement to the target. Specifically, we predicted that activity on noncanceled trials would extinguish earlier than activity on no-stop signal trials because the monkeys are cued by the appearance of the stop signal that they are making a movement that will not result in reward. We therefore examined the time when the movement-related activity ended on no-stop signal trials and noncanceled trials for each of the reward-contingent movement neurons. The movement response was significant on noncanceled trials for 83 of 100 pre-SMA reward-contingent cells and 85 of 102 SMA cells. As predicted, we found that the movement-related activity for the majority of these pre-SMA (69 of 83; 83%) and SMA (71 of 85; 84%) neurons ended earlier on noncanceled trials than on no-stop signal trials. The mean difference between the end of movement-related activity on noncanceled and no-stop signal trials was 74 and 89 ms, respectively, for the pre-SMA and SMA. In contrast, the mean difference in end times for the actual movement, measured by the position of the handlebar on no-stop signal and noncanceled trials, was 12 ms. A t test showed that the neural activity difference times were significantly different from the handlebar difference times (t test, p < 0.0001). There is no significant difference of the mean velocity on noncanceled and no-stop signal trials (t test, p = 0.36), although movements on noncanceled trials are slightly faster. Figure 16A shows an example from a single cell showing an end activity difference time of 100 ms for noncanceled trials (green) and no-stop signal trials (black) for movements toward the right target. Figure 16B shows the population responses for all reward-driven movement cells in the pre-SMA (top) and SMA (bottom) on noncanceled and no-stop signal trials, clearly demonstrating that movement-related activity on noncanceled trials extinguishes earlier than that on no-stop signal trials. The vertical dashed line indicates the mean SSD time (i.e., the reappearance of the start box at the center of the screen). This happened between 16 and 30 ms before movement onset. In contrast, the neuronal activity difference developed ∼200 ms after movement onset. Such a long delay makes it unlikely that the activity difference is in response to the changed visual stimulation. Mean velocity trajectories show that there was little difference in the way the movement was made. Our findings show that the majority of movement-related neuronal activity in the pre-SMA and SMA is contingent on the expected reward outcome of the trial.
Figure 16.

Movement-related activity on noncanceled trials ends earlier than activity on no-stop signal trials. A, Movement-related activity from a single cell in the pre-SMA with activity on no-stop signal trials (black) and on noncanceled trials (green). Activity on noncanceled trials ends earlier than it does on the no-stop signal trials (100 ms difference for movements to the right). The mean time the stop signal is presented is indicated by the dotted line (44.5 ms before movement onset). The velocity trajectory for each trial is shown above plot of neural data (gray, no-stop signal trials; green, noncanceled trials) along with the mean trajectory (heavy lines). B, Combined normalized activity across pre-SMA neurons (top) and SMA neurons (bottom) for movements to the right and left showing that noncanceled trial activity ends earlier than no-stop signal trial activity across populations. The mean time the stop signal is presented is indicated by the dotted line (pre-SMA: 17.8 ms before movement onset right, 29.3 ms left; SMA: 16.6 ms right, 17.9 ms left). Mean velocity trajectories across days are shown above each plot of the neural data (black, no-stop signal trials; green, noncanceled trials). Movements in both directions are indicated with a positive deflection.
Movement-related activity is modified by size of expected reward
To obtain a better understanding of how reward modifies the observed movement-related responses, we altered the countermanding task so that on 25–50% of trials the monkey received twice the normal reward amount for making the same movement. A high-reward trial was indicated to the animal at the start of the trial by the color of the initial center box. No significant change in either the velocity or the reaction time was observed for high- and low-reward trials [mean velocity: low-reward trials, 20.5 (±2.14) cm/s (monkey 1), and 15.6 (±2.1) cm/s (monkey 2); high-reward trials, 20.4 (±2.19) cm/s (monkey 1), and 15.9 (±2.7) cm/s (monkey 2); mean reaction time: low-reward trials, 416.4 (±59) ms (monkey 1), and 410.1 (±56) ms (monkey 2); high-reward trials, 418.5 (±61) ms (monkey 1), and 400.6 (±55) ms (monkey 2)]. t tests revealed p values that were just above 0.05 (p = 0.06 for velocity and 0.051 for reaction time). In contrast, we found significantly longer SSRTs for high-reward trials (monkey 1: SSRT low-reward trials, 135 ms; high-reward trials, 161 ms; difference, 26 ms; t test, p < 0.001; monkey 2: SSRT low-reward trials, 136 ms; high-reward trials, 158 ms; difference, 22 ms; t test, p < 0.001). We recorded the activity of 86 movement-related neurons during the altered countermanding task. First, we determined the cancelation time of these neurons separately for high- and low-reward trials. We confirmed that the cancelation time of all pre-SMA and SMA neurons followed the SSRT [mean cancelation time, low-reward trials: 137 ms after SSRT (range, 56–224 ms); mean cancelation time, high-reward trials: 186 ms after SSRT (range, 121–260 ms)]. Subsequently, we examined the movement-related activity to determine whether it was affected by reward size. Figure 17A shows an example movement neuron in the SMA exhibiting elevated activity on high-reward trials (gray) over low-reward trials (black). We found that 25% (7 of 28) of pre-SMA movement-related cells exhibited significantly different activity on high- and low-reward trials. In contrast, 52% (30 of 58) of movement-related cells in the SMA showed this difference, which is a significantly higher proportion of cells (χ2 test, p < 0.05). Most of the early-onset cells in the pre-SMA (42%; 5 of 12) showed differential activity on high- and low-reward trials. Neither of the two early-onset cells found in the SMA showed a significant activity difference, but the number of neurons that we could test was too small to draw any meaningful conclusion from this finding. To examine the collective response of movement-related cells in the region, we pooled neural activity across groups of neurons. We first normalized the spike density function of each individual neuron by dividing it by the maximum neural activity and then took the average of the normalized spike density functions. Cells with significantly higher activity on low-reward trials (six cells for rightward and seven cells for leftward movements) were excluded for this analysis. At a population level, movement-related cells from both the pre-SMA and SMA exhibited significantly higher activity increases on high-reward trials (t test, p < 0.01) (Fig. 17B,C). Early-onset cells from the pre-SMA, but not the SMA, showed a similar significant increase (pre-SMA: t test, p < 0.01 for rightward and leftward movement directions; SMA: t test, p > 0.05).
Figure 17.
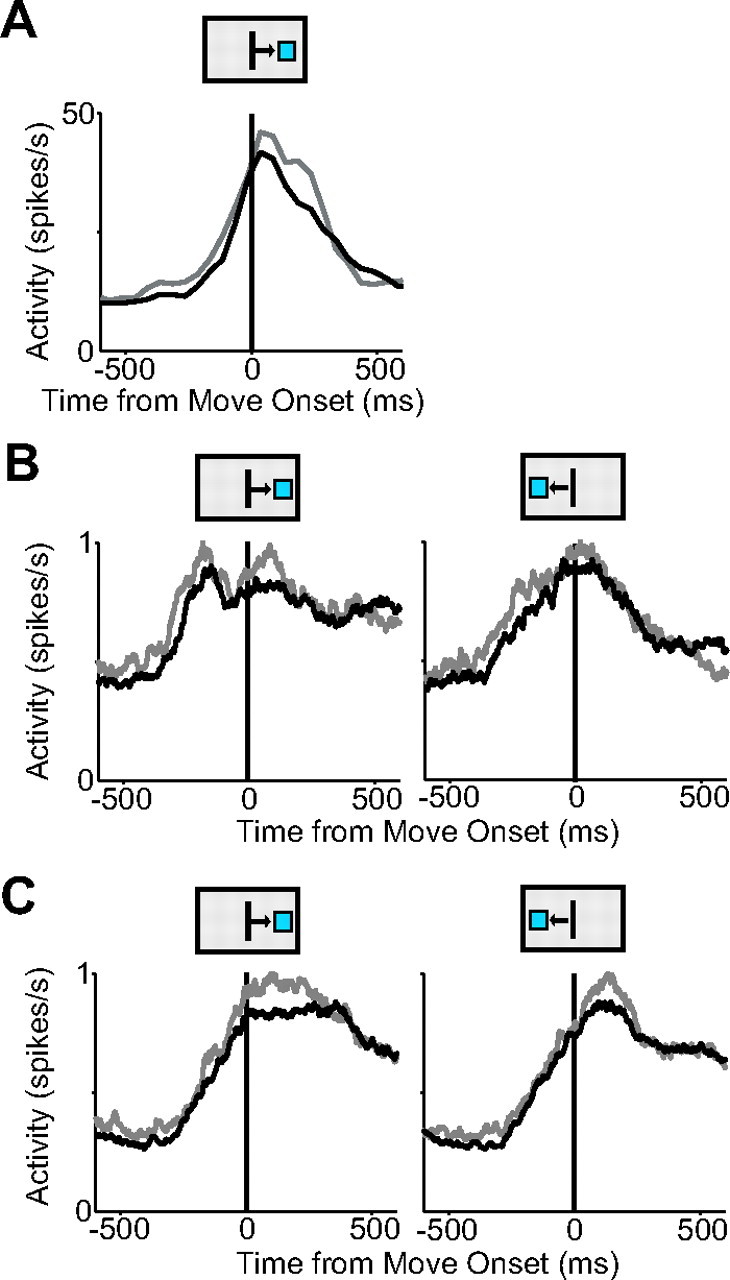
Pre-SMA and SMA movement activity modified by high and low reward. A, Activity for single SMA cell on high-reward (gray) and low-reward (black) trials. B, Mean spike density functions of all pre-SMA movement cells under high (gray)- and low (black)-reward conditions. C, Mean spike density functions for SMA movement cells. The movement direction is indicated by the boxes above the plots.
Discussion
The SMA and pre-SMA are widely considered to play a central role in movement initiation and inhibition because of their activation long before movement onset. However, it has never been examined whether this activity is only correlated with the movement or whether it determines whether or not a movement is carried out. We examined this question using a countermanding paradigm. Our findings suggest that the SMA and pre-SMA represent the motivation for specific actions but do not control whether or not these actions are made.
Movement initiation and inhibition
Our finding that pre-SMA and SMA do not seem to control movement initiation is unexpected, given the close connections of these areas to other motor areas (Luppino et al., 1993; Rizzolatti and Luppino, 2001; Dum and Strick, 2002). Thus, we have to consider how generally our results might apply. In particular, activity in the pre-SMA and SMA is often highly context dependent (Nachev et al., 2008) and might be more involved in motor control under difficult task conditions. Thus, pre-SMA and SMA might simply not be necessary to control responses in the countermanding task. We think this unlikely to be the case. One measure of task difficulty is the degree to which its contingencies encourage the preparation of different, mutually exclusive actions (Botvinick et al., 2001). The behavioral rules of the countermanding task encourage two opposite response tendencies. On the one hand, movements should be executed as fast as possible to receive the reward. On the other hand, movement initiation should be delayed, to wait for the occurrence of a possible stop signal. These two motivations compete with each other and create conflict on all trials, independent of the presence of an actual stop signal. On each single trial, the brain can only select one of the two responses, but over time it has to balance the competing interests. Given this assessment, it seems that the countermanding task contains the basic elements of a complex motor control task, which should engage the medial frontal cortex. Indeed, functional MRI experiments in humans show strong activation of SMA and pre-SMA during the countermanding task (Aron and Poldrack, 2006; Aron et al., 2007). There are other possible objections to the generality of our findings (see supplemental material, available at www.jneurosci.org). Future experiments will be necessary to test whether our findings can be extended to movements generated in other conditions that might differ from the ones in the countermanding paradigm.
The final decision as to whether or not a planned movement is performed must be made downstream of pre-SMA or SMA. It will be important to test other cortical and subcortical motor areas across the skeletomotor system to determine where this decision is finally made (see supplemental material, available at www.jneurosci.org).
Our experiment has provided evidence for the existence of putative inhibitory neurons in the pre-SMA and SMA. The inhibitory cells could play an important role in vetoing goal-directed behavior (Brass and Haggard, 2007; Kühn et al., 2009) or in suppressing automatic behavior (Isoda and Hikosaka, 2007; Sumner et al., 2007). These neurons resemble a group of pre-SMA neurons that are selectively active when the monkey needs to suppress an automatic unwanted action and to facilitate a voluntary desired action (Isoda and Hikosaka, 2007). Like our inhibition neurons, these so-called switch neurons are directional and thus seem to control specific actions. However, a larger fraction of switch neurons was active early enough to be able to influence behavior (switch neurons: 29 of 50, 58%; inhibition neurons: 7 of 40, 18%). This could be attributable to differences in the behavioral measurements in the two studies. The length of the switch process was estimated based on a single behavioral data point (the midpoint between the reaction time distribution for correct and incorrect switch trials). In contrast, the SSRT estimate was based on the average of four independent methods using up to four behavioral data points and therefore was less noisy. This might have led to a more stringent criterion for accessing the ability of a neuron to influence motor behavior. Alternatively, the difference might reflect a real difference in the degree to which pre-SMA and SMA are involved in suppressing an action versus switching from one action to another. It will be important to test neurons in both types of tasks.
Motivation for specific actions
Although our findings make it unlikely that pre-SMA and SMA play a causal role in initiating movements, lesions in these areas do have a profound influence on behavior. We found that the activity of most movement-related neurons was reward contingent. Thus, pre-SMA and SMA might represent the urge to act in a specific way rather than the commitment to do so (for alternative interpretations, see supplemental material, available at www.jneurosci.org).
This interpretation of motor-related pre-SMA and SMA activity as a motivation signal fits with a large number of lesion and recording studies in humans and monkeys that indicate that the medial frontal cortex, in particular pre-SMA, is responsible for self-generated, voluntary actions (Papa et al., 1991; Romo and Schultz, 1992; Deiber et al., 1999) and reflects the reward obtained by these actions (Stuphorn et al., 2000; Ito et al., 2003; Roesch and Olson, 2003, 2004; Campos et al., 2005; Sohn and Lee, 2007). Voluntary behavior is characterized by the motivation to act to obtain a particular goal. Lesions of the pre-SMA and SMA may lead to apathy, because the motivational drive that normally links reward expectation with specific actions is absent. However, since the motor system is still functional, external stimuli may still trigger automatic or habitual movements. This is, in fact, what is observed for SMA lesions in monkeys (Thaler et al., 1988, 1995) and humans (Levy and Dubois, 2006; Schmidt et al., 2008).
We observe motivational signals in pre-SMA and SMA during movement generation. In contrast, activity in the orbitofrontal cortex appears earlier, immediately after a cue indicating potential reward is revealed (Tremblay and Schultz, 1999; Roesch and Olson, 2003, 2004; Padoa-Schioppa and Assad, 2006), but it does not encode the action necessary to obtain the reward (Wallis and Miller, 2003; Padoa-Schioppa and Assad, 2006). Lateral prefrontal cortex activity reflects reward size and preference in the delay period before a response is made (Kobayashi et al., 2006; Sakagami and Watanabe, 2007). Striatal activity arises after a cue is presented and remains high until reward is delivered (Hikosaka, 1989; Hollerman et al., 1998). Thus, early reward-related signals from other brain areas might feed into the SMA and pre-SMA where they are transformed into incentive signals for specific actions.
Comparison with the oculomotor system
The countermanding task was previously used to investigate the control of eye movements. Unlike saccades, arm movements can be stopped at any point along their path (De Jong et al., 1990). The nonballistic nature of the arm movements resulted in some behavioral findings that were different from those in the oculomotor studies. First, we observed some arm movements that were stopped in midflight. Such aborted arm movements likely represented cases in which the STOP process finished too late to suppress the early stages of the arm movement, but early enough to suppress the later stages. This interpretation is supported by the reaction time of these aborted arm movements, which was longer than average, and the fact that they occurred most frequently for SSDs of medium length. Second, on some canceled trials, we observed EMG activation of agonist muscles, similar to findings in human countermanding experiments (De Jong et al., 1990). This activity was weaker than on no-stop signal trials and was not accompanied by overt movements of the handle. Only muscle activity that was sufficiently strong to overcome the inertia of the arm and of the handle itself led to the initiation of the arm movement. Therefore, the subthreshold muscle activity (Fig. 8) did not invalidate the race model. However, it illustrates that for nonballistic movements there is no “point of no return” after which a movement preparation process becomes uncontrollable. Therefore, there is also no unique natural equivalent for the crossing of the threshold in the race model. In our experiment, movement initiation was defined as the moment when the cursor left the starting zone. We could have defined a different threshold, such as the onset of EMG activity. This would have changed how individual trials would have been classified, but it would not have changed the underlying logic of the race model analysis. We set a specific threshold in our experiment and the monkeys learned to control their behavior accordingly.
The frontal eye field and superior colliculus contain neurons that are directly involved in movement inhibition and initiation (Hanes et al., 1998; Paré and Hanes, 2003). Cells in the supplementary eye field (SEF) and anterior cingulate cortex do not (Stuphorn et al., 2009). Instead, they evaluate motor responses and may influence the activity in motor regions (Stuphorn et al., 2000; Ito et al., 2003; Stuphorn and Schall, 2006). Given the differences between eyes and arm motor control, it is remarkable how similar the findings are in SEF and pre-SMA/SMA. This suggests that the functional organization of the medial frontal motor control system follows broadly parallel principles.
Conclusions
In summary, our findings show that pre-SMA and SMA play a role in the suppression of prepared arm movements, but they do not seem to control the initiation of arm movements. Instead, they may represent the urge to act in a specific way. This signal would provide an essential bridge between expected reward information and motor execution.
Footnotes
This work was supported by National Eye Institute Grant R01-EY019039 (V.S.). We are grateful to C. E. Connor, S. Hsiao, and J. D. Schall for comments on this manuscript, and we thank Ryan Aronberg for help with the experiments.
References
- Aron AR, Poldrack RA. Cortical and subcortical contributions to Stop signal response inhibition: role of the subthalamic nucleus. J Neurosci. 2006;26:2424–2433. doi: 10.1523/JNEUROSCI.4682-05.2006. [DOI] [PMC free article] [PubMed] [Google Scholar]
- Aron AR, Behrens TE, Smith S, Frank MJ, Poldrack RA. Triangulating a cognitive control network using diffusion-weighted magnetic resonance imaging (MRI) and functional MRI. J Neurosci. 2007;27:3743–3752. doi: 10.1523/JNEUROSCI.0519-07.2007. [DOI] [PMC free article] [PubMed] [Google Scholar]
- Botvinick MM, Braver TS, Barch DM, Carter CS, Cohen JD. Conflict monitoring and cognitive control. Psychol Rev. 2001;108:624–652. doi: 10.1037/0033-295x.108.3.624. [DOI] [PubMed] [Google Scholar]
- Brass M, Haggard P. To do or not to do: the neural signature of self-control. J Neurosci. 2007;27:9141–9145. doi: 10.1523/JNEUROSCI.0924-07.2007. [DOI] [PMC free article] [PubMed] [Google Scholar]
- Campos M, Breznen B, Bernheim K, Andersen RA. Supplementary motor area encodes reward expectancy in eye-movement tasks. J Neurophysiol. 2005;94:1325–1335. doi: 10.1152/jn.00022.2005. [DOI] [PubMed] [Google Scholar]
- Deiber MP, Honda M, Ibañez V, Sadato N, Hallett M. Mesial motor areas in self-initiated versus externally triggered movements examined with fMRI: effect of movement type and rate. J Neurophysiol. 1999;81:3065–3077. doi: 10.1152/jn.1999.81.6.3065. [DOI] [PubMed] [Google Scholar]
- De Jong R, Coles MG, Logan GD, Gratton G. In search of the point of no return: the control of response processes. J Exp Psychol Hum Percept Perform. 1990;16:164–182. doi: 10.1037/0096-1523.16.1.164. [DOI] [PubMed] [Google Scholar]
- Dum RP, Strick PL. Motor areas in the frontal lobe of the primate. Physiol Behav. 2002;77:677–682. doi: 10.1016/s0031-9384(02)00929-0. [DOI] [PubMed] [Google Scholar]
- Eccles JC. The initiation of voluntary movements by the supplementary motor area. Arch Psychiatr Nervenkr. 1982;231:423–441. doi: 10.1007/BF00342722. [DOI] [PubMed] [Google Scholar]
- Fried I, Katz A, McCarthy G, Sass KJ, Williamson P, Spencer SS, Spencer DD. Functional organization of human supplementary motor cortex studied by electrical stimulation. J Neurosci. 1991;11:3656–3666. doi: 10.1523/JNEUROSCI.11-11-03656.1991. [DOI] [PMC free article] [PubMed] [Google Scholar]
- Goldberg G. Supplementary motor area structure and function: review and hypotheses. Behav Brain Sci. 1985;8:567–616. [Google Scholar]
- Goldberg G, Bloom KK. The alien hand sign. Localization, lateralization and recovery. Am J Phys Med Rehabil. 1990;69:228–238. doi: 10.1097/00002060-199010000-00002. [DOI] [PubMed] [Google Scholar]
- Haggard P. Human volition: towards a neuroscience of will. Nat Rev Neurosci. 2008;9:934–946. doi: 10.1038/nrn2497. [DOI] [PubMed] [Google Scholar]
- Hanes DP, Schall JD. Countermanding saccades in macaque. Vis Neurosci. 1995;12:929–937. doi: 10.1017/s0952523800009482. [DOI] [PubMed] [Google Scholar]
- Hanes DP, Patterson WF, 2nd, Schall JD. Role of frontal eye fields in countermanding saccades: visual, movement, and fixation activity. J Neurophysiol. 1998;79:817–834. doi: 10.1152/jn.1998.79.2.817. [DOI] [PubMed] [Google Scholar]
- Hikosaka O. Role of basal ganglia in saccades. Rev Neurol (Paris) 1989;145:580–586. [PubMed] [Google Scholar]
- Hollerman JR, Tremblay L, Schultz W. Influence of reward expectation on behavior-related neuronal activity in primate striatum. J Neurophysiol. 1998;80:947–963. doi: 10.1152/jn.1998.80.2.947. [DOI] [PubMed] [Google Scholar]
- Ikeda A, Yazawa S, Kunieda T, Ohara S, Terada K, Mikuni N, Nagamine T, Taki W, Kimura J, Shibasaki H. Cognitive motor control in human pre-supplementary motor area studied by subdural recording of discrimination/selection-related potentials. Brain. 1999;122:915–931. doi: 10.1093/brain/122.5.915. [DOI] [PubMed] [Google Scholar]
- Isoda M, Hikosaka O. Switching from automatic to controlled action by monkey medial frontal cortex. Nat Neurosci. 2007;10:240–248. doi: 10.1038/nn1830. [DOI] [PubMed] [Google Scholar]
- Ito S, Stuphorn V, Brown JW, Schall JD. Performance monitoring by the anterior cingulate cortex during saccade countermanding. Science. 2003;302:120–122. doi: 10.1126/science.1087847. [DOI] [PubMed] [Google Scholar]
- Kobayashi S, Nomoto K, Watanabe M, Hikosaka O, Schultz W, Sakagami M. Influences of rewarding and aversive outcomes on activity in macaque lateral prefrontal cortex. Neuron. 2006;51:861–870. doi: 10.1016/j.neuron.2006.08.031. [DOI] [PubMed] [Google Scholar]
- Kornhuber HH, Deecke L. Changes in the brain potential in voluntary movements and passive movements in man: readiness potential and reafferent potentials (in German) Pflugers Arch Gesamte Physiol Menschen Tiere. 1965;284:1–17. [PubMed] [Google Scholar]
- Kühn S, Haggard P, Brass M. Intentional inhibition: how the “veto-area” exerts control. Hum Brain Mapp. 2009;30:2834–2843. doi: 10.1002/hbm.20711. [DOI] [PMC free article] [PubMed] [Google Scholar]
- Lang W, Cheyne D, Kristeva R, Beisteiner R, Lindinger G, Deecke L. Three-dimensional localization of SMA activity preceding voluntary movement. A study of electric and magnetic fields in a patient with infarction of the right supplementary motor area. Exp Brain Res. 1991;87:688–695. doi: 10.1007/BF00227095. [DOI] [PubMed] [Google Scholar]
- Laplane D, Talairach J, Meininger V, Bancaud J, Orgogozo JM. Clinical consequences of corticectomies involving the supplementary motor area in man. J Neurol Sci. 1977;34:301–314. doi: 10.1016/0022-510x(77)90148-4. [DOI] [PubMed] [Google Scholar]
- Levy R, Dubois B. Apathy and the functional anatomy of the prefrontal cortex-basal ganglia circuits. Cereb Cortex. 2006;16:916–928. doi: 10.1093/cercor/bhj043. [DOI] [PubMed] [Google Scholar]
- Logan G, Cowan W. On the ability to inhibit thought and action: a theory of an act of control. Psychol Rev. 1984;91:295–327. doi: 10.1037/a0035230. [DOI] [PubMed] [Google Scholar]
- Lüders HO, Dinner DS, Morris HH, Wyllie E, Comair YG. Cortical electrical stimulation in humans. The negative motor areas. Adv Neurol. 1995;67:115–129. [PubMed] [Google Scholar]
- Luppino G, Matelli M, Camarda R, Rizzolatti G. Corticocortical connections of area F3 (SMA-proper) and area F6 (pre-SMA) in the macaque monkey. J Comp Neurol. 1993;338:114–140. doi: 10.1002/cne.903380109. [DOI] [PubMed] [Google Scholar]
- Mita A, Mushiake H, Shima K, Matsuzaka Y, Tanji J. Interval time coding by neurons in the presupplementary and supplementary motor areas. Nat Neurosci. 2009;12:502–507. doi: 10.1038/nn.2272. [DOI] [PubMed] [Google Scholar]
- Nachev P, Kennard C, Husain M. Functional role of the supplementary and pre-supplementary motor areas. Nat Rev Neurosci. 2008;9:856–869. doi: 10.1038/nrn2478. [DOI] [PubMed] [Google Scholar]
- Okano K, Tanji J. Neuronal activities in the primate motor fields of the agranular frontal cortex preceding visually triggered and self-paced movement. Exp Brain Res. 1987;66:155–166. doi: 10.1007/BF00236211. [DOI] [PubMed] [Google Scholar]
- Padoa-Schioppa C, Assad JA. Neurons in the orbitofrontal cortex encode economic value. Nature. 2006;441:223–226. doi: 10.1038/nature04676. [DOI] [PMC free article] [PubMed] [Google Scholar]
- Papa SM, Artieda J, Obeso JA. Cortical activity preceding self-initiated and externally triggered voluntary movement. Mov Disord. 1991;6:217–224. doi: 10.1002/mds.870060305. [DOI] [PubMed] [Google Scholar]
- Paré M, Hanes DP. Controlled movement processing: superior colliculus activity associated with countermanded saccades. J Neurosci. 2003;23:6480–6489. doi: 10.1523/JNEUROSCI.23-16-06480.2003. [DOI] [PMC free article] [PubMed] [Google Scholar]
- Rizzolatti G, Luppino G. The cortical motor system. Neuron. 2001;31:889–901. doi: 10.1016/s0896-6273(01)00423-8. [DOI] [PubMed] [Google Scholar]
- Roesch MR, Olson CR. Impact of expected reward on neuronal activity in prefrontal cortex, frontal and supplementary eye fields and premotor cortex. J Neurophysiol. 2003;90:1766–1789. doi: 10.1152/jn.00019.2003. [DOI] [PubMed] [Google Scholar]
- Roesch MR, Olson CR. Neuronal activity related to reward value and motivation in primate frontal cortex. Science. 2004;304:307–310. doi: 10.1126/science.1093223. [DOI] [PubMed] [Google Scholar]
- Romo R, Schultz W. Role of primate basal ganglia and frontal cortex in the internal generation of movements. III. Neuronal activity in the supplementary motor area. Exp Brain Res. 1992;91:396–407. doi: 10.1007/BF00227836. [DOI] [PubMed] [Google Scholar]
- Sakagami M, Watanabe M. Integration of cognitive and motivational information in the primate lateral prefrontal cortex. Ann N Y Acad Sci. 2007;1104:89–107. doi: 10.1196/annals.1390.010. [DOI] [PubMed] [Google Scholar]
- Sayer RJ, Friedlander MJ, Redman SJ. The time course and amplitude of EPSPs evoked at synapses between pairs of CA3/CA1 neurons in the hippocampal slice. J Neurosci. 1990;10:826–836. doi: 10.1523/JNEUROSCI.10-03-00826.1990. [DOI] [PMC free article] [PubMed] [Google Scholar]
- Schmidt L, d'Arc BF, Lafargue G, Galanaud D, Czernecki V, Grabli D, Schüpbach M, Hartmann A, Lévy R, Dubois B, Pessiglione M. Disconnecting force from money: effects of basal ganglia damage on incentive motivation. Brain. 2008;131:1303–1310. doi: 10.1093/brain/awn045. [DOI] [PubMed] [Google Scholar]
- Sohn JW, Lee D. Order-dependent modulation of directional signals in the supplementary and presupplementary motor areas. J Neurosci. 2007;27:13655–13666. doi: 10.1523/JNEUROSCI.2982-07.2007. [DOI] [PMC free article] [PubMed] [Google Scholar]
- Stuphorn V, Schall JD. Executive control of countermanding saccades by the supplementary eye field. Nat Neurosci. 2006;9:925–931. doi: 10.1038/nn1714. [DOI] [PubMed] [Google Scholar]
- Stuphorn V, Taylor TL, Schall JD. Performance monitoring by the supplementary eye field. Nature. 2000;408:857–860. doi: 10.1038/35048576. [DOI] [PubMed] [Google Scholar]
- Stuphorn V, Brown JW, Schall JD. Role of supplementary eye field in saccade initiation: executive not direct control. J Neurophysiol. 2009 doi: 10.1152/jn.00221.2009. [DOI] [PMC free article] [PubMed] [Google Scholar]
- Sumner P, Nachev P, Morris P, Peters AM, Jackson SR, Kennard C, Husain M. Human medial frontal cortex mediates unconscious inhibition of voluntary action. Neuron. 2007;54:697–711. doi: 10.1016/j.neuron.2007.05.016. [DOI] [PMC free article] [PubMed] [Google Scholar]
- Thaler D, Chen YC, Nixon PD, Stern CE, Passingham RE. The functions of the medial premotor cortex. I. Simple learned movements. Exp Brain Res. 1995;102:445–460. doi: 10.1007/BF00230649. [DOI] [PubMed] [Google Scholar]
- Thaler DE, Rolls ET, Passingham RE. Neuronal activity of the supplementary motor area (SMA) during internally and externally triggered wrist movements. Neurosci Lett. 1988;93:264–269. doi: 10.1016/0304-3940(88)90093-6. [DOI] [PubMed] [Google Scholar]
- Tremblay L, Schultz W. Relative reward preference in primate orbitofrontal cortex. Nature. 1999;398:704–708. doi: 10.1038/19525. [DOI] [PubMed] [Google Scholar]
- Verbruggen F, Logan GD. After-effects of goal shifting and response inhibition: a comparison of the stop-change and dual-task paradigms. Q J Exp Psychol (Colchester) 2008;61:1151–1159. doi: 10.1080/17470210801994971. [DOI] [PubMed] [Google Scholar]
- Wallis JD, Miller EK. Neuronal activity in primate dorsolateral and orbital prefrontal cortex during performance of a reward preference task. Eur J Neurosci. 2003;18:2069–2081. doi: 10.1046/j.1460-9568.2003.02922.x. [DOI] [PubMed] [Google Scholar]
- Yazawa S, Ikeda A, Kunieda T, Ohara S, Mima T, Nagamine T, Taki W, Kimura J, Hori T, Shibasaki H. Human presupplementary motor area is active before voluntary movement: subdural recording of Bereitschaftspotential from medial frontal cortex. Exp Brain Res. 2000;131:165–177. doi: 10.1007/s002219900311. [DOI] [PubMed] [Google Scholar]


