Abstract
Homeostasis in the intact organism is achieved implicitly by repeated incremental feedback (inhibitory) and feedforward (stimulatory) adjustments enforced via intermittent signal exchange. In separated systems, neurohormone signals act deterministically on target cells via quantifiable effector-response functions. On the other hand, in vivo interglandular signaling dynamics have not been estimable to date. Indeed, experimentally isolating components of an interactive network definitionally disrupts time-sensitive linkages. We implement and validate analytical reconstruction of endogenous effector-response properties via a composite model comprising (i) a deterministic basic feedback and feedforward ensemble structure; (ii) judicious statistical allowance for possible stochastic variability in individual biologically interpretable dose–response properties; and (iii) the sole data requirement of serially observed concentrations of a paired signal (input) and response (output). Application of this analytical strategy to a prototypical neuroendocrine axis in the conscious uninjected horse, sheep, and human (i) illustrates probabilistic estimation of endogenous effector dose–response properties; and (ii) unmasks statistically vivid (2- to 5-fold) random fluctuations in inferred target-gland responsivity within any given pulse train. In conclusion, balanced mathematical formalism allows one to (i) reconstruct deterministic properties of interglandular signaling in the intact mammal and (ii) quantify apparent signal-response variability over short time scales in vivo. The present proof-of-principle experiments introduce a previously undescribed means to estimate time-evolving signal-response relationships without isotope infusion or pathway disruption.
In contradistinction to the remarkable insights gained recently about signaling behavior in isolated systems, virtually nothing is known about quantitative properties of unperturbed interglandular control in vivo. This knowledge deficit is significant, because homeostasis in the whole organism implicitly proceeds via repeated incremental dose–responsive adjustments transduced by the exchange of inhibitory and facilitative signals (1-8). Thematic examples include reciprocal coupling between anorexigenic and satiety factors that govern body weight, sympathetic neuronal and adrenal-glandular linkages that parse adaptations to stress, and glucose and insulin interactions that ration the distribution of metabolic fuels (9-11). The burgeoning repertoire of novel molecular signals establishes a need for integrative formalism to estimate such in vivo effector-response dynamics (12). The present analytical platform offers a first step toward this end.
Methods
Overview. Analysis of isolated components of an interlinked system has provided important insights. However, this approach disrupts intrinsic control of spontaneously unfolding adaptive signal control. The current studies illustrate an analytical strategy to reconstruct unmanipulated in vivo dose–response attributes.
Stochastic Elements. An emergent thesis is that deterministic and stochastic (random) inputs jointly direct physiological patterns of signal exchange (4, 6, 7) (Appendixes A-C). Random inputs may derive from both biological and technical sources, as reflected: (i) in a single secretory cell by time-varying responsiveness to an incoming signal; (ii) in an entire gland by spatial and temporal dispersion of activated cells; (iii) in blood by signal diffusion, advection, and metabolism; (iv) among neurons by way of a random pulse-renewal process; and (v) technically, due to experimental error in sample collection, processing, and assay (13-15). From a modeling perspective, whereas considerations iii-v above are amenable to available mathematical methods, issues i and ii have eluded realistic formulation. We propose a balanced model comprising fixed (deterministic) structure and flexible (stochastic) parameter adaptability to represent time-evolving multisignal interactions in the undisturbed host (Appendixes A-F).
Hormone Secretion, Diffusion, Advection, and Elimination. Secreted molecules undergo physical diffusion (random movement in solution) and linear advection (admixture due to forward blood flow); diffusion and advection across capillary beds; dilution in the pulmonary and systemic circulation; and irreversible metabolism (elimination) by the liver, kidney, spleen, gut, skin, or bone marrow (16). The foregoing processes require simultaneous statistical estimation. To this end, we approximate the advective blood pool as a circular pathway, wherein X(x, t) and Z(x, t) designate the hormone concentration and secretion rate at location x sampled at time t. Let D and C define diffusion and advection coefficients, respectively, and α the rate constant of irrecoverable elimination. The composite impact of secretion, advection, diffusion, and elimination on the instantaneous hormone concentration is well approximated by a convolution of secretion and biexponential elimination (at a fixed sampling location x, left implicit):
 |
where α(1) is a function of D, C, and in lesser measure α; and, α(2) equals α (16) (Appendix D). The amplitudes, a and 1-a, and distribution volumes of luteinizing hormone (LH) and testosterone (Te) are known (17).
Allowable Variability in Feedback/Feedforward Interfaces. Feedback (inhibitory) and feedforward (stimulatory) connections are embodied in a logistic dose–response function:
 |
Feedforward is given by B > 0 and feedback by B < 0; A denotes agonist potency (half-maximally effective stimulus concentration, ED50); B defines sensitivity (maximal response steepness); and, at constant D (baseline), C signifies efficacy (asymptotic maximal response) (7, 13, 14, 17). Goldbeter and Koshland (18) offer a theoretic foundation for such cooperative and saturable dose–response properties. The present construction is unique in allowing (but not requiring) stochastic variability individually in A, B, or C (potency, sensitivity, and efficacy) (Appendix C). Each coefficient is readily interpretable biologically.
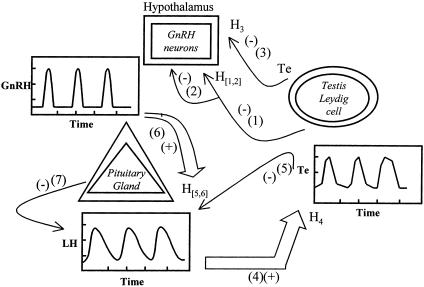
A simplified interactive network among gonadotropin-releasing hormone (GnRH), LH, and Te comprises six dose–response interfaces (13, 14, 16, 19, 20) (Fig. 1). One response function is bivariate, wherein hypothalamic GnRH feedforward and systemic Te feedback jointly determine the rate of pituitary LH secretion. Collectively, statistical analyses entail a priori identification of provisional pulse-onset times (Appendix A); calculation of the time-averaged effector concentration (l1, l2), which approximates the input signal (Appendix B); reconstruction of the stochastically adaptive dose–response interface function, H, at time t (Appendix C); estimation of hormone distribution and elimination kinetics (Appendix D); representation of ligand exchange among the free fluid phase and plasma-binding proteins (Appendix E); and computation of the instantaneous secretion rate, defined as the output of the relevant H function (Appendix F). Albeit listed separately, analyses in Appendixes B-F are carried out simultaneously by using the combined concentration time series of GnRH, LH, and Te in the sheep and horse and of LH and Te in the human (7, 12-17, 19).
Fig. 1.
Schema of male steroidogenic axis and core feedback/feedforward interactions (Center). Arrows identify interglandular connections, wherein wide arrows (+) signify feedforward and thin (-) feedback. Arabic numbers and subscripted H denotes dose–response interface functions (Appendix C). Regulatory signals are hypothalamic GnRH, pituitary LH, and testicular Te.
Experiments in the Horse, Sheep, and Human. Experiments include: (i)/(ii) in the stallion (n = 4) and ram (n = 2), simultaneous sampling of GnRH and LH concentrations every 5 min in peripituitary (cavernous-sinus) blood and of Te every 15 min (horse) and 5 min (sheep) in jugular blood for 6 and 12 h, respectively; and (iii) in the human, concurrent measurement of peripheral LH and spermatic-vein Te concentrations every 20 min for 17 h in one volunteer (before varicocelectomy) and of systemic LH and total and bioavailable [non-sex hormone-binding globulin (SHBG)-bound] Te concentrations every 10 min for 24 h in two young men.
Results
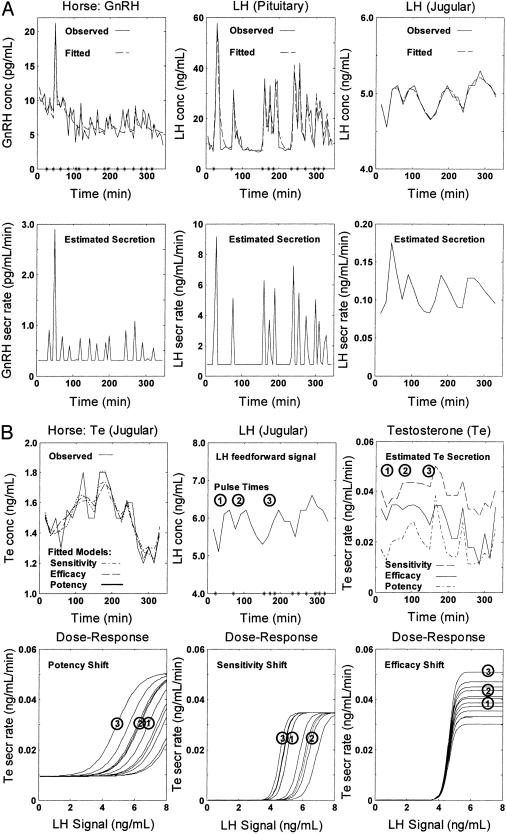
Fig. 2 depicts simultaneous GnRH, LH, and Te time series collected in a stallion procedurally adapted without anesthesia, sedation, or restraint. Plots depict measured GnRH and LH (Fig. 2A) and Te (Fig. 2B) concentrations and analytically computed secretion rates. Model-based analyses provided statistical estimates of each measured outcome (both are shown for comparison). Dose–response reconstruction yielded prominent random fluctuations in individual pulse-by-pulse agonist potency, response sensitivity, or stimulus efficacy. This inference was made in four horses.
Fig. 2.
(A) Paired GnRH and LH concentration (con) time series monitored every 5 min in pituitary blood and Te con sampled every 15 min in jugular blood for 6 h in an awake unrestrained stallion. (Upper) Observed (directly measured, continuous line) and fitted (analytically estimated, dashed) pituitary GnRH (Left) and LH (Center) and jugular LH (Right) con; (Lower) estimated matching secretion rates (sec). Asterisks on abscissa (Upper Left and Center) denote estimated GnRH (hypothalamic) and LH (pituitary) pulse-onset times. (B)(Upper) Measured Te con and estimated Te sec (Left and Right) and estimated LH con and LH pulse-onset times (asterisks, Upper Center); (Lower) families of estimated LH-Te dose–response curves based on potential pulse-by-pulse variability in LH potency (Lower Left), Leydig-cell sensitivity (Lower Center) or LH efficacy (Lower Right). Each circled numeral denotes an individual pulse of LH con paired with Te sec and the estimated LH con-Te sec dose–response function for that pair.
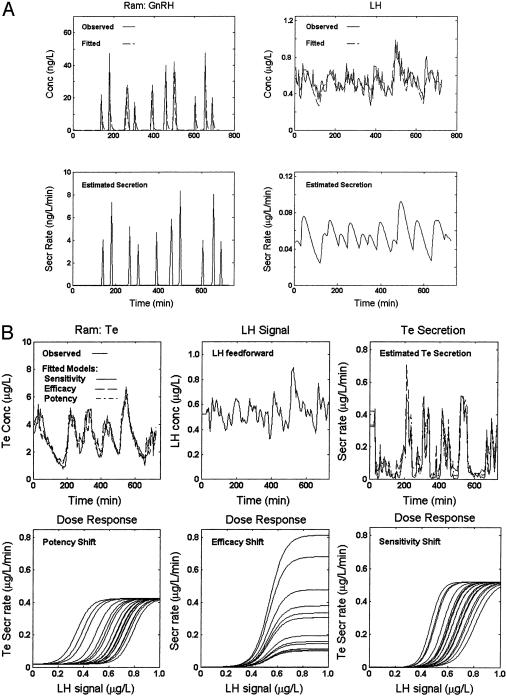
Fig. 3 presents observed time histories and matching analytical estimates of GnRH, LH, and Te concentrations in the awake ram monitored every 5 min for 12 h. Data (in both animals studied) were consistent with prominent (3- and 8-fold) ad seriatim stochastic variability in any one of LH potency, sensitivity, or efficacy.
Fig. 3.
Simultaneous GnRH, LH (pituitary), and Te (jugular) concentrations (con) sampled centrally every 5 min for 12 h in a conscious ram. (A) (Upper) Measured (continuous line) GnRH (Left) and LH (Right) con; and analytically estimated values (fitted, dashed). (Lower) Estimated GnRH and LH secretion rates (sec). (B) Families of LH con-Te sec dose–response estimates, presented as in Fig. 2B.
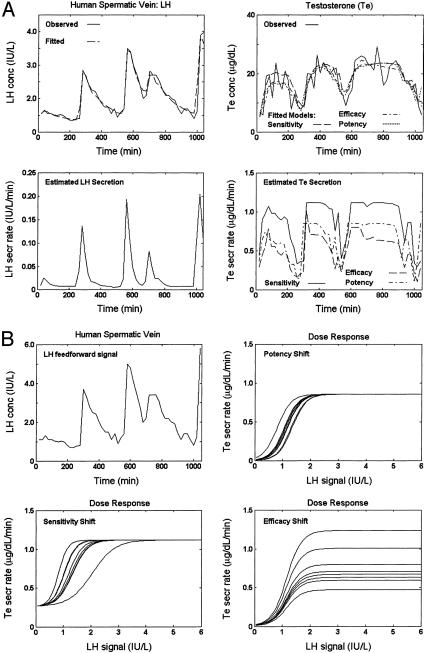
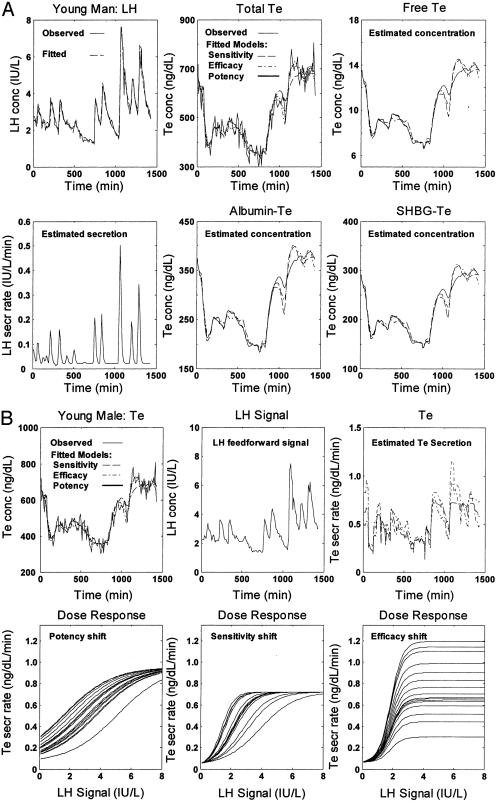
Analyses of paired peripheral LH and spermatic-vein Te concentration time series in one man also forecast random successive perturbations in individually estimated dose–response properties (Fig. 4). Modeling of frequent (10-min) measurements of systemic LH and total and bioavailable (non-SHBG-bound) concentrations for 24 h in (two) young men produced comparable outcomes (Fig. 5).
Fig. 4.
Measured LH (peripheral) and Te (spermatic vein) concentrations (con) and calculated (estimated) secretion rates (sec) in a man sampled every 20 min for 17 h. (A)(Upper Left) Observed (continuous) and fitted (dashed) LH con. (Lower) Estimated LH sec. (Upper Right) Measured (continuous) and estimated Te con with permissible variability in dose–response sensitivity (dashed), efficacy (dashed-dot), or potency (dotted); (Lower) estimated Te sec with allowable shifts in feedforward sensitivity (continuous), efficacy (dashed), or potency (dashed-dot). (B) (Upper Left) Estimated LH con signal (input stimulus). (Lower Left and Right) Families of LH con-Te sec dose–response estimates with possible variability in sensitivity (Lower Left), potency (Upper Right), or efficacy (Lower Right).
Fig. 5.
Evaluation of human LH and Te dynamics from systemic measurements made every 10 min 24 h. (A)(Upper Left) Observed (continuous) and fitted (dashed) LH con; and (Lower) estimated LH sec. (Upper Center) Total Te con, measured (continuous), and estimated with an allowable variability in sensitivity (dashed), efficacy (dashed-dot), or potency (dotted). (Lower) Observed and estimated albumin-bound Te con. (Right) Estimated free (Upper) and SHBG-bound (Lower) Te con. (B)(Upper Left) Measured (continuous) and estimated total Te con in models of possibly variable feedforward sensitivity (dashed), efficacy (dashed-dot), and potency (dotted); (Center) estimated LH con signal. (Right) Estimated Te sec for permissible random adaptations in sensitivity (dashed), efficacy (dashed-dot), or potency (dotted). (Lower) Analytically estimated LH con-Te sec dose–response interface with potential stochastic fluctuations in potency (Left), sensitivity (Center), or efficacy (Right).
Discussion
The present work is unique in (i) showing that deterministic effector-response properties are analytically estimable in a prototypical neuroendocrine axis of the uninjected conscious horse, sheep, and human; and (ii) inferring that endogenous dose–response properties manifest marked (2- to 5-fold) random variability on a pulse-to-pulse basis. In principle, successive stochastic adaptations of in vivo interglandular dose–response linkages might reflect recurrent epochs of partial target-cell desensitization and resensitization; cycles of intraglandular inhibition and facilitation by autocrine or paracrine signals; and/or nonuniform ligand delivery, uptake, action, or inactivation within the target gland. The first conjecture mirrors classical pharmacological paradigms (5, 21), which may or may not be relevant to physiological adaptations. The second notion of local gatekeeper control reflects the capability of intraglandular signals and neuronal inputs to modulate cellular responses. Also, the postulate of variable effector access to target cells arises from potentially time-varying microvascular and interstitial-fluid dynamics. From a technical perspective, the current analyses allow for unpredictable fluctuations in individual (rather than combined) agonist potency, sensitivity, or efficacy. Accordingly, we do not yet know whether two or more stochastic elements operate conjointly.
Summary and Conclusion
The outcomes presented here frame the proposition that composite deterministic and stochastic inputs govern endogenous effector-response properties under free-running conditions. Robustness of this interpretation is implied by consistent inference among dissimilar paradigms of hormone sampling site (pituitary, jugular, forearm, and spermatic vein), frequency (every 5-20 min), and duration (6-24 h); in both the presence (human) and absence (horse and sheep) of plasma ligand-binding proteins; and for three different mammalian species. Thus, we speculate that successive random perturbations of in vivo input-output interface properties are biologically fundamental. If so, the current analytical platform should find broad investigative utility in statistical estimation of other effector-response surfaces that mediate multiglandular communication in the unmanipulated animal and human (Introduction). A forthcoming challenge is simultaneous modeling of (positive) feedforward and (negative) feedback linkages within (and ultimately among) biological control systems. The proximate analytical requirements are accurate sequential measurements of concentrations of a pertinent signal-response pair; relevant formulation of primary linkages in the core network structure; a priori statistical verification of the resultant model form; and direct experimental validation of parameter estimates.
In conclusion, the significance of a noninvasive strategy of analytically reconstructing endogenous signal-response dynamics is highlighted by >645,000 studies of effector dose–response properties analyzed under feedback-isolated and/or pathway-disrupted conditions reported in the last decade (www.nlm.nih.gov). We extend this important scientific foundation by demonstrating probabilistic reconstruction of composite deterministic and stochastic signal-response properties in the uninfused, unblocked, and un-stimulated host.
Acknowledgments
Support was provided by Grants K01 AG19164, R01 AG23133, and DK60717 from the National Institutes of Health (Bethesda); Interdisciplinary Grant in the Mathematical Sciences DMS-0107680 from the National Science Foundation (Washington, DC); and Grant M01 RR00585 to the General Clinical Research Center of the Mayo Clinic and Foundation from the National Center for Research Resources (Rockville, MD).
Appendixes: Jointly Deterministic and Stochastic Feedback Model
Key analytical equations of the ensemble model follow, with justification given in refs. 7, 13-14, 16, 19, 20, and 22-24.
Appendix A: Pulse Times. Apriori LH (L) and GnRH (G) pulse-onset times are estimated by a previously developed method (19) and then treated as fixed:
 |
Appendix B: LH Feedforward Signal on Te Secretion. Agonism, FL(t), is enforced via a delayed time-averaging of LH concentrations, XL, wherein time delays are (l1, l2)
 |
Appendix C: Ensemble Secretion Formulation. Total Te secretion, ZTe(t), arises directly from LH feedforward via a four-parameter dose–response function with allowable stochastic variability in any one of feedforward efficacy, sensitivity, or potency; additively with concomitant basal Te production (βTe); and indirectly via random effects on GnRH and LH burst mass ( ). The shape of GnRH and LH secretory bursts is embodied in a three-parameter waveform (generalized Gamma probability density) of instantaneous secretion rates evolving over time, ψG and ψL.
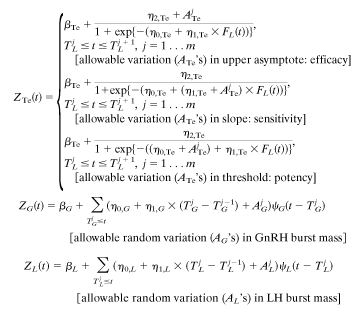
Appendix D: Dissipation of Hormone Concentrations by Biexponential Kinetics. For fast and slow rates of elimination of GnRH given by  and
and  , we have established that
 |
with analogous expressions for LH and Te (see below in the case of Te).
Appendix E: Kinetics of Free and Specific Protein-Bound Te Exchange in Plasma. Let the vector  denote the three primary Te compartments, which sum to the total Te concentration (XTe(t)); terms
  and
and  define off-rate constants; and
  and
and  signify on-rate constants [based on populational mean equilibrium dissociation constants, SHBG (1.0 nM) and albumin (25 μM), and matching concentrations, SHBG (49 nM) and albumin (0.678 mM)] (25). Thereby, we estimated equilibrium fractions of free SHBG- and albumin-bound Te of 2%, 43%, and 55%. Joint Te kinetics, including exchange with SHBG and albumin, are defined by the solutions, j = 1, 2:
 |
where B(j) is above matrix, δ(t) = (ZTe(t), 0, 0)′ and  . One solves for
  recursively by:
  , thereby obtaining the total Te concentration.
Appendix F: Realization of Hormone Concentration Time Series. Sample hormone concentrations with experimental uncertainty, εk(i), are then defined by:
 |
where Xk(ti) is the output of the combined secretion and elimination function (C-E, above). In the case of secretion models for GnRH and LH and reconstruction of the possibly efficacy-shifted LH-Te dose–response function, random elements (AG, AL, and ATe) enter into secretion rates linearly; thus, the maximum likelihood estimate (MLE),  : of the parameter is obtained by maximizing the corresponding Gaussian likelihood function. In the case of estimates of allowably variable feedforward sensitivity and potency, random elements contribute nonlinearly to secretion rates. Therefore, estimation proceeds iteratively in two stages: (i) random effects are held fixed, and dose–response parameters are maximized (as above); and (ii) parameters are held fixed, and conditional expectations of the Gaussian random effects are obtained via an expectation-maximization algorithm. Variances and covariances of estimated parameters are computed explicitly.
Estimates of the secretion rates are then obtained as the conditional expectations evaluated at the MLE  :
:
 |
A convolution of these estimated secretion rates with their estimated biexponential kinetics, a linear procedure, results in the fitted concentrations: Ŷk,i, i = 1,..., n, k = G, L, Te.
Application of this method is shown for estimated secretion rates and fitted concentrations of GnRH, LH, and Te in Figs. 2, 3, 4, 5.
This paper was submitted directly (Track II) to the PNAS office.
Abbreviations: GnRH, gonadotropin-releasing hormone; LH, luteinizing hormone; Te, testosterone; SHBG, sex hormone-binding globulin.
References
- 1.Smith, W. R. (1983) Am. J. Physiol. 245, R473-R477. [DOI] [PubMed] [Google Scholar]
- 2.Dempsher, D. P., Gann, D. S. & Phair, R. D. (1984) Am. J. Physiol. 246, R587-R596. [DOI] [PubMed] [Google Scholar]
- 3.Cartwright, M. & Husain, M. (1986) J. Theor. Biol. 123, 239-250. [DOI] [PubMed] [Google Scholar]
- 4.Veldhuis, J. D., Carlson, M. L. & Johnson, M. L. (1987) Proc. Natl. Acad. Sci. USA 84, 7686-7690. [DOI] [PMC free article] [PubMed] [Google Scholar]
- 5.Levy, G. (1994) Clin. Pharmacol. Ther. 56, 356-358. [DOI] [PubMed] [Google Scholar]
- 6.Pincus, S. M., Mulligan, T., Iranmanesh, A., Gheorghiu, S., Godschalk, M. & Veldhuis, J. D. (1996) Proc. Natl. Acad. Sci. USA 93, 14100-14105. [DOI] [PMC free article] [PubMed] [Google Scholar]
- 7.Keenan, D. M., Licinio, J. & Veldhuis, J. D. (2001) Proc. Natl. Acad. Sci. USA 98, 4028-4033. [DOI] [PMC free article] [PubMed] [Google Scholar]
- 8.Knobil, E. (1980) Recent Prog. Horm. Res. 36, 53-58. [DOI] [PubMed] [Google Scholar]
- 9.Kojima, M., Hosoda, H., Date, Y., Nakazato, M., Matsuo, H. & Kangawa, K. (1999) Nature 402, 656-660. [DOI] [PubMed] [Google Scholar]
- 10.Gaillard, R. C., Riondel, A., Muller, A. F., Herrmann, W. & Baulieu, E. E. (1984) Proc. Natl. Acad. Sci. USA 81, 3879-3882. [DOI] [PMC free article] [PubMed] [Google Scholar]
- 11.Bruning, J. C., Gautam, D., Burks, D. J., Gillette, J., Schubert, M., Orban, P. C., Klein, R., Krone, W., Muller-Wieland, D. & Kahn, C. R. (2000) Science 289, 2122-2125. [DOI] [PubMed] [Google Scholar]
- 12.Schulze, A. & Downward, J. (2001) Nat. Cell Biol. 3, E190-E195. [DOI] [PubMed] [Google Scholar]
- 13.Keenan, D. M. & Veldhuis, J. D. (1998) Am. J. Physiol. 275, E157-E176. [DOI] [PubMed] [Google Scholar]
- 14.Keenan, D. M., Sun, W. & Veldhuis, J. D. (2000) SIAM J. Appl. Math. 61, 934-965. [Google Scholar]
- 15.Pincus, S. M. & Kalman, R. E. (1997) Proc. Natl. Acad. Sci. USA 94, 3513-3518. [DOI] [PMC free article] [PubMed] [Google Scholar]
- 16.Keenan, D. M. & Veldhuis, J. D. (2001) Am. J. Physiol. 280, R1755-R1771. [DOI] [PubMed] [Google Scholar]
- 17.Veldhuis, J. D. (1999) in Reproductive Endocrinology, eds. Yen, S. S. C., Jaffe, R. B. & Barbieri, R. L. (Saunders, Philadelphia), pp. 622-631.
- 18.Goldbeter, A. & Koshland, D. E., Jr. (1981) Proc. Natl. Acad. Sci. USA 78, 6840-6844. [DOI] [PMC free article] [PubMed] [Google Scholar]
- 19.Keenan, D. M. & Veldhuis, J. D. (1997) Am. J. Physiol. 273, R1182-R1192. [DOI] [PubMed] [Google Scholar]
- 20.Keenan, D. M., Veldhuis, J. D. & Yang, R. (1998) Am. J. Physiol. 275, R1939-R1949. [DOI] [PubMed] [Google Scholar]
- 21.Wagner, J. G. (1968) J. Theor. Biol. 20, 173-201. [DOI] [PubMed] [Google Scholar]
- 22.Sun, W. (1995) Ph.D. thesis (University of Virginia, Charlottesville).
- 23.Yang, R. (1997) Ph.D. thesis (University of Virginia, Charlottesville).
- 24.Chattopadhyay, S. (2001) Ph.D. thesis (University of Virginia, Charlottesville).
- 25.Sodergard, R., Backstrom, T., Shanbhag, V. & Carstensen, H. (1982) J. Steroid Biochem. 16, 801-810. [DOI] [PubMed] [Google Scholar]


