Abstract
Thiolate-protected gold nanoparticles (AuNPs) are a highly versatile nanomaterial, with wide-ranging physical properties dependent upon the protecting thiolate ligands and gold core size. These nanoparticles serve as a scaffold for a diverse and rapidly increasing number of applications, extending from molecular electronics to vaccine development. Key to the development of such applications is the ability to quickly and precisely characterize synthesized AuNPs. While a unique set of challenges have inhibited the potential of mass spectrometry in this area, recent improvements have made mass spectrometry a dominant technique in the characterization of small AuNPs, specifically those with discrete sizes and structures referred to as monolayer-protected gold clusters (MPCs). The unique ability of mass spectrometry to analyze the protecting monolayer of the AuNP may cause it to become a major technique in the characterization of larger AuNPs. The development of mass spectrometry techniques for AuNP characterization has begun to reveal interesting new areas of research. This report is a discussion of the historical challenges in this field, the emerging techniques which aim to meet those challenges, and the future role of mass spectrometry in the growing field of thiolate-protected AuNPs.
Introduction
The story of the ligand-protected gold nanoparticle (AuNP) is relatively short due to its recent arrival in the world of nanotechnology. Colloidal gold, which does not feature any organic ligands, has been known for much of recorded history; it has been used for various medicinal remedies and to provide color in ceramics and stained glass. In the 19th century, Michael Faraday observed the diversity of colors in colloidal gold and theorized that the spectral diversity was due to size variation, but this was only a small part of the diversity of nanosized gold colloids.1,2 Phosphines, amines, and thiols have all been used to protect gold nanoparticles, but thiolate ligands became the most popular after the development of Brust’s synthesis, a facile and versatile route to the formation of thiolate-protected AuNPs.3 Since the only requirement for the ligand is a free thiol, anything from biologically available glutathione and cysteine-bearing peptides to exotic aromatic “molecular wire” molecules can be used. Thiolate-protected AuNPs have since become a scaffold for a wide variety of applications, such as molecular electronics,4 catalysis,5 biosensing,6 and vaccine development.7
Two defining properties – core size and protecting ligands – dominate the character of these nanoparticles. While unprotected, colloidal gold nanoparticles have a core diameter typically between 2–150 nm,8 thiolate-protected AuNPs are generally <10 nm in diameter.9 The smallest nanoparticles which have discrete sizes and structures will be referred to more specifically as monolayer-protected gold clusters (MPCs). For this report, the monolayer should be understood to be a monolayer of the “staple” gold-thiolate complexes which will be discussed later, and the term “cluster” is used to specify the small and well-defined nature of the nanoparticle. These MPCs generally have molecular or quantum properties, such as tunable band gaps, quantized charging, and discrete optical absorbance bands.10 Larger cores exhibit properties of bulk gold, such as a surface plasmon band with a size-dependent λmax near 520 nm.11 The protecting ligands contribute to the electronic properties of the nanoparticle in addition to determining chemical functionality and solubility.
Thus, the characterization of nanoparticle core size and protecting ligands has great utility for AuNP-based applications. A number of techniques are commonly utilized for this characterization. Ultraviolet-visible (UV-Vis) spectroscopy is used to measure size based on the presence or absence of a surface plasmon band or the unique absorbance spectrum of very small MPCs.12 Transmission electron microscopy (TEM) allows imaging of the gold core,3 owing to the high electron density of gold compared to the organic ligands. Commonly, nuclear magnetic resonance (NMR)13 or infrared spectroscopy (IR)14 are used for characterizing the protecting ligands, and thermogravimetric analysis (TGA)13 is used to determine the proportion of gold and ligand present in the nanoparticles. This information can be used in conjunction with TEM to give an average molecular formula for the nanoparticles.13
Mass spectrometry (MS) is unique in that it has been proven capable of performing all three tasks – measuring core size, characterizing the protecting ligands, and yielding a molecular formula – simultaneously. Mass spectrometry as a technique has faced several challenges arising from the unique nature and size of ligand-protected AuNPs. As challenges are overcome, the use of mass spectrometry in the analysis of small AuNPs is increasing rapidly. In this report, the development of MS techniques and improvements are detailed, and applications based on those improvements are discussed.
Core size estimation and “magic-sized” MPCs
The earliest use of mass spectrometry for the characterization of thiolate-protected AuNPs are found in work from the late 1990s. These reports quickly revealed the problem inherent in mass analysis of AuNPs: ionization typically leads to fragmentation of the nanoparticle. For electrospray ionization (ESI), low mass gold-thiolate ions are common.15 Matrix-assisted laser desorption/ionization (MALDI) and laser desorption/ionization (LDI) without matrix assistance generates few nanoparticle ions until the laser fluence is sufficiently high for photolytic cleavage of the thiolate C-S bond. The ions that are observed are generally clusters of gold and sulfur, with a complete loss of the protecting ligands.16 However, since ions roughly correspond to the mass of the core alone, the size of the core could be inferred from its mass. Using a simple calculation based on the properties of bulk gold, an approximate core diameter could be obtained as described by Schaaff et al.:17
| (1) |
From the mass spectrum, the number of gold atoms (NAu) can be estimated. An approximate core diameter (Deq) can then be calculated using two assumptions: first, that the gold adopts a face-centered cubic (fcc) packing structure (with a number density of ca. 59 atoms·nm−3) and second, that the nanoparticle is spherical in shape. The later discovery of gold-thiolate “staple” structures and non-fcc packing18–20 in MPCs introduces some error in the estimated number density term. However, the respective error from denser packing and more distant capping gold atoms drives the number density in different directions, minimizing the net error. To illustrate, the calculated and measured diameters of the MPCs whose structures are known can be compared.18,19 For Au25(SCH2CH2Ph)18, if only the dense icosahedral Au13 core is considered, the calculated diameter of 7.5 Å is much greater than the measured diameter of 5.6 Å. However, if the staple gold atoms are included, the calculated diameter of 9.3 Å is much closer to the measured diameter of 9.8 Å. For Au102(p-MBA)44 the error is remarkably small: 1.5 nm calculated compared to a roughly 1.55 nm measured diameter.
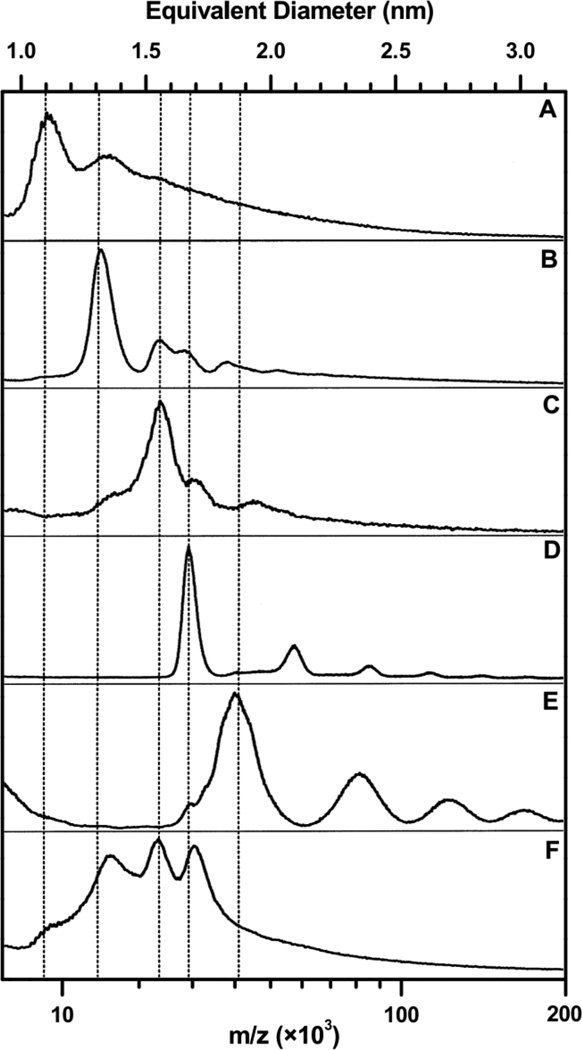
Equation 1 was first utilized when members of the Whetten lab discovered21,22 that a portion of synthesized nanoparticles contained a series of discretely sized cores less than 2 nm in diameter. The mere existence of synthetically favored core sizes made this new discovery intriguing. Mass spectrometry was used (Figure 1) to estimate the core diameters of these newly discovered MPCs. The favored or “magic” sizes that were reported included what were later identified as the Au38(SR)24, Au102(SR)44, and Au144/146(SR)59/60 clusters, which continue to be common in studies of MPCs and their properties.
Figure 1.
Initial LDI mass spectra of various magic-sized MPCs. Spectra A–E each correspond to a particular magic size, having been fractionated from a mixture of synthesized nanoparticles. Spectra A–D represent fractions corresponding to Au38(SC12H25)24, Au68(SC18H37)34, Au102(SC6H13)44, and Au144/146(SC6H13)59/60, respectively. The fraction in spectrum E is unidentified. Spectrum F is a representative unfractionated mixture of nanoparticles with dodecanethiolate ligands. Adapted with permission from ref. 17. Copyright 1997 American Chemical Society.
Schaaff later described the FWHM of MPC mass spectra as superior to the resolution of TEM with regards to gold core size measurement.23 Mass spectrometry is additionally capable of obtaining size population information for mixtures of MPCs which have a size range less amenable to TEM measurements. Ideally, the core size of larger nanoparticles could be measured using mass spectrometry. However, commonly used detectors exhibit lower sensitivity with increasing mass; since the mass of an AuNP increases exponentially with diameter size, larger ions will be unobservable. The use of kinetic energy-dependent detectors could hypothetically circumvent this problem, but these detectors are highly impractical for use in this context. In addition, the lower volatility and higher molecular formula dispersity of larger AuNPs would significantly decrease and broaden the signal, making such an endeavor unlikely to succeed. Nevertheless, mass spectrometry is a very useful tool in the development of applications for MPCs exhibiting desired quantum effects, especially in light of recent synthetic work exclusively creating sizes under 2 nm.24,25
Advances in MS methodologies for AuNP analysis
Through the discovery of the magic-sized MPCs, researchers had demonstrated that mass spectrometry could be a formidable tool for elucidating size distributions of small clusters. Ideally, mass spectrometric analysis of thiolate-protected AuNPs would yield not only information about the core size, but also the ligand composition decorating the AuNP. However, because of the ubiquitous fragmentation of the ligands from the gold core, this ideal was not realized until the advent of improved MALDI- and ESI-based methodologies.
Matrix-assisted laser desorption/ionization
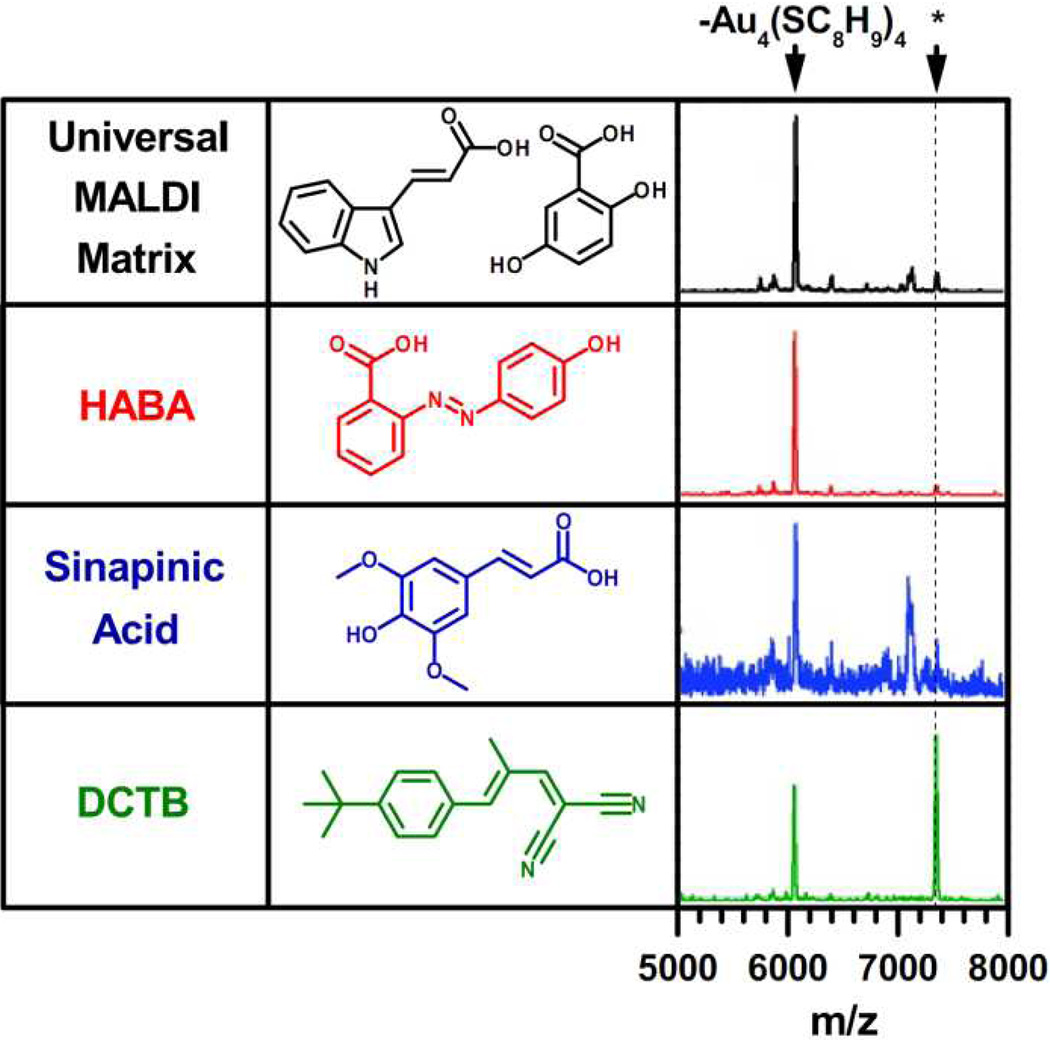
The use of traditional weak organic acid MALDI matrices have provided a means to measure the mass of the core of ligand-protected AuNPs; however, these matrices do not prevent extensive ligand fragmentation. Following the initial studies reported in the late 1990s, it was not until 2008 that the first MALDI spectra (Figure 2) of intact ligand-protected AuNPs was published by Dass et al.26 Very recent work has extended the effective range of MALDI-MS AuNP characterization to 18 kDa for Au68(SCH2CH2Ph)34.27 The success of these efforts was due to the use of a unique matrix, trans-2-[3-(4-tert-butylphenyl)-2-methyl-2-propenylidene] malononitrile (DCTB), which ionizes by electron transfer rather than the proton transfer of weak organic acid matrices.28 In spite of this solution to the fragmentation problem, MALDI-MS analysis will be limited to small MPCs indefinitely due to the problems associated with larger AuNPs mentioned in the previous section.
Figure 2.
MALDI-MS spectra of Au25(SCH2CH2Ph)18 using various matrices, demonstrating the unique capability of the DCTB matrix to generate intact ligand-protected AuNP ions. The most prominent fragment shown corresponds to Au21(SCH2CH2Ph)14, resulting from a loss of Au4(SCH2CH2Ph)4. The peaks marked with an asterisk correspond to the intact [Au25(SCH2CH2Ph)18]+ species. Adapted with permission from ref. 26. Copyright 2008 American Chemical Society.
The analysis of AuNPs with hydrophilic ligands has posed a problem for both MALDI and ESI. These ligands are necessary for applications which require water-soluble thiolate-protected AuNPs. For hydrophobic AuNPs, the relatively low-energy electron transfer is conducive to ionization without fragmentation. However, hydrophilic ligands of choice are commonly terminated with carboxylic acids, which at physiological pH exist in a carboxylate form. The steric confinement of high charge density results in significant Coulombic repulsion and fragmentation following ionization, particularly for larger particles with lower surface curvature and a higher charge density. No MALDI-MS spectra of intact hydrophilic ligand-protected AuNPs have been reported to date.
Electrospray ionization
The first unfragmented mass spectra were obtained using ESI,15 due to its softness as an ionization technique; however, the electrospray process is not well-suited for AuNPs. Alkanethiolates are the most commonly used ligands, and are among the best ligands for generating magic-sized MPCs. Unfortunately, alkanethiolates are traditionally difficult to ionize in either the positive or the negative mode, but ionization can be enhanced through the use of ligand exchange. In 2007, Tracy et al.29 reported the ligand exchange of methoxy penta(ethylene glycol)thiolate ligands onto Au25(SCH2CH2Ph)18 clusters, allowing observation of highly charged MPCs. More recently, Fields-Zinna and colleagues utilized quaternary amine ligands with an intrinsic charge to enhance the ionization of larger MPCs.30
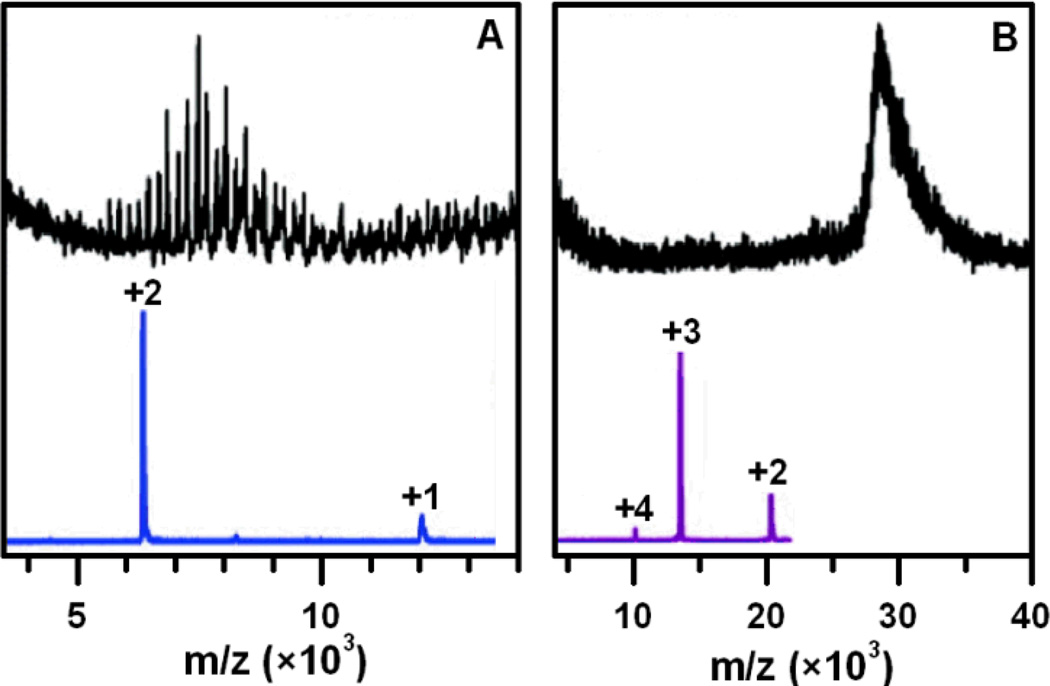
A different approach was explored by Tsukuda and coworkers, who oxidized or reduced the clusters prior to ESI-MS analysis using Ce(SO4)2 or NaBH4.31 This approach allowed the observation of relatively large, intact MPCs (Figure 3).32 Approaches which enhance the charge state of intact MPCs are significant for the future due to their applicability to larger AuNPs, and their ability to overcome the attenuated signal of high-mass ions.
Figure 3.
LDI (above) and ESI (below) mass spectra of Au38(SC12H25)24 (A) and Au144(SC12H25)59 (B) as obtained by Chaki et al. Samples were oxidized with Ce(SO4)2 prior to analysis. Adapted with permission from ref. 32. Copyright 2008 American Chemical Society.
The first unfragmented AuNP mass spectrum reported was that of the small Au25 cluster protected by glutathione ligands (abbreviated SG here to highlight the thiolate bonding).15 However, due to a large amount of chemical noise and an alternate molecular formula with a very similar mass, the ion was mistakenly identified as Au28(SG)16 until corrected in 2005.12 This underscores two challenges of peak identification from intact AuNPs, namely that multiple molecular formulae can be nearly isobaric, and that impurities or ligand fragmentation can generate a large amount of chemical noise which frustrates the assignment of atomic information. Clean samples and instrumentation with very high resolving power decreases the uncertainty of molecular formula assignments,33 since the number of indistinguishable, nearly-isobaric permutations are decreased.
New applications and emerging trends
Apart from the characterization of synthesized nanoparticles, applications of MS-based AuNP analysis have included investigations into the nature and properties of AuNPs, particularly the small MPCs. Two applications are detailed in this section, namely mixed-ligand and gold-thiolate complex analysis. These were selected for their promise in the future of AuNP research. Both have implications for routine MS-based AuNP characterization while also revealing new information about the nanoparticles.
Mixed-ligand analysis
With the ability to analyze intact MPCs, it is now possible to investigate variations in the stoichiometry of different ligands on the basis of mass, considering the gold core to be a constant mass. This has enabled the characterization of mixed-ligand AuNPs since, assuming one is comparing ligands of different masses, each population of ligands will correspond to a unique mass. Mass spectrometry alone allows the observation of ligand mixtures of discrete stoichiometry. Other techniques, primarily nuclear magnetic resonance (NMR) spectroscopy, provide population averages, yielding only the percent coverage of different thiolate ligands on an average nanoparticle.
The characterization of mixed-ligand AuNPs has significant implications in a wide range of applications, ranging from biological to electronic. While AuNPs are typically protected by a uniform monolayer of a single ligand species, a mixture of ligands is required for many applications where the demands of synthetic parameters, solubility, and chemical functionality require more than a single species can provide. For example, covering an entire nanoparticle with a given epitope for a vaccine would be costly, difficult, and likely render the nanoparticle insoluble. Thus, having multiple ligand species with different chemical roles is desirable. This can be accomplished through the combination of a higher proportion of a shorter capping ligand to achieve the desired solubility properties with a smaller proportion of longer ligands containing the epitope moiety.34
Diverse mixtures of ligands can be placed on a nanoparticle through the presence of multiple thiols during the AuNP synthesis or through ligand exchange (also known as place-exchange) reactions. For some applications, it may be acceptable to know that the ligand of interest is present on the nanoparticle surface. Ideally, the relative amounts of nanoparticles featuring a given stoichiometry of ligands would be identified. This “ligand exchange distribution” can only be accurately observed using mass spectrometry if the ionization efficiency is the same for all nanoparticles, regardless of the specific mixture of ligands present. The amount of variation in ionization efficiency across mixed-ligand populations should be dictated by the specific chemical properties of the ligands present. However, ligand exchange distributions obtained by Murray and coworkers reveal symmetric distributions for different stoichiometries of phenylethanethiolate and hexanethiolate ligands, which seems to indicate a uniform ionization efficiency.26
The first MS-based mixed-ligand analysis focused on the ligand exchange kinetics of small Au25(SR)18-x(SR’)x clusters.35 The kinetics of ligand exchange for thiols on gold films has been thoroughly explored and extrapolated to three-dimensional nanoparticles.36 An understanding of on/off rates for terraces, edges, and vertices based on self-assembled monolayers may conceptually be true for nanoparticles; however, the existence of semi-ring Au(SR)2 and Au2(SR)3 structures on AuNP surfaces may complicate a direct extrapolation. Two thiolate positions – those connected to the core and those that only bind to the outer “staple” gold atoms – are expected to have similar but distinct exchange rates. Further complexities arise from ligand-ligand intermolecular interactions. For example, three different types of interactions were identified in the crystal structure of Au102(p-MBA)44.18
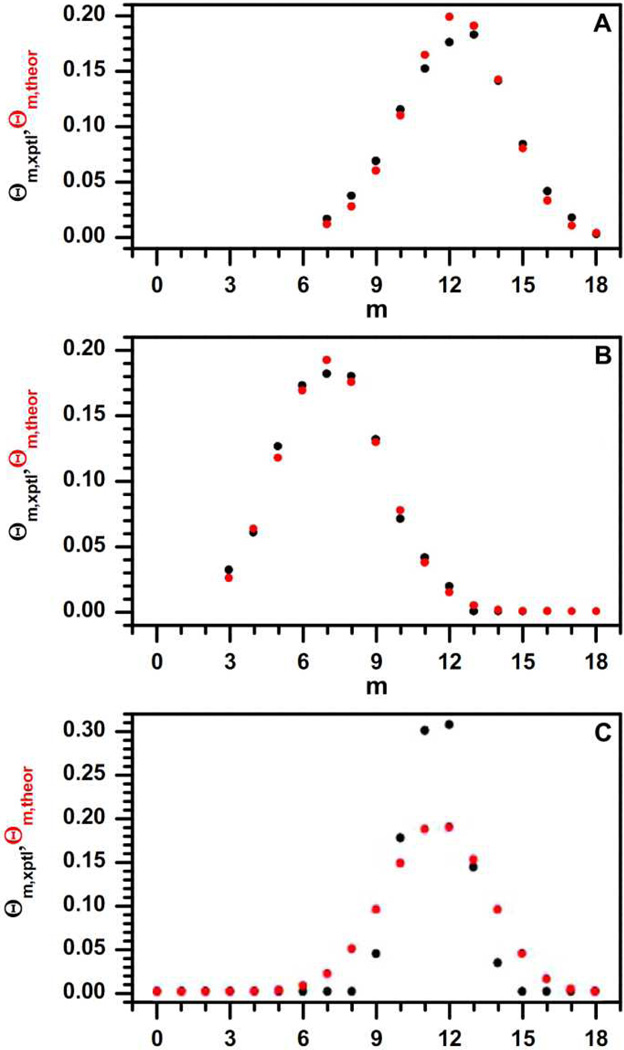
The work by Dass et al. explored ligand exchange kinetics for MPCs with mixtures of phenylethanethiol, hexanethiol, and thiophenol ligands.35 Clusters with a mixture of hexanethiol and phenylethanethiol, generated both through post-synthesis ligand exchange (Fig. 4A) and mixed-ligand synthesis (Fig. 4B), agreed well with the predicted ligand exchange distribution. However, the ligand exchange distribution of place-exchanged thiophenol was much narrower than expected (Fig. 4C). This may imply the existence of ligand-ligand interactions which more strictly control the number of ligands which can exchange. This work demonstrates the capabilities of MS-based ligand analysis, as well as providing future directions to investigate the variables of ligand exchange reactions for ligand-protected AuNPs.
Figure 4.
Comparison of theoretical (red) and experimental (black) ligand exchange distributions, where m is the number of phenylethanethiol ligands, Au25(SCH2CH2Ph)m(SR)18-m, and Θ is the proportion of the entire cluster population featuring its respective value of m. Hexanethiol ligand exchange (A) and hexanethiol/phenylethane thiol mixed Brust synthesis (B) matched with calculated ligand distributions, but thiophenol ligand exchange (C) demonstrated a narrower ligand exchange distribution. Adapted with permission from ref. 35. Copyright 2008 American Chemical Society.
Gold-thiolate precursor complexes and capping structures
Complexes of cationic gold and thiols are well-known, having been used for medicinal purposes for some time.37 The complexes form both ring and linear structures; aurophilic binding induce aggregation until, in many cases, they become insoluble. In the Brust synthesis, these complexes are generated and then reduced to form ligand-protected AuNPs. An alternative case of cationic gold binding to thiolate ligands are self-assembled monolayers (SAMs), where a planar film of gold is oxidized by binding to the thiolate monolayer. It was long assumed that gold nanoparticles were a kind of three-dimensional SAM, with planar gold surfaces on every face of the nanoparticle.
The first experimental evidence of a distinct and discrete capping structure arose in 2007, when Cliffel and coworkers analyzed tiopronin (Tio)-protected AuNPs using ESI-MS and found a dominant Au4(Tio)4 ion species.38 This Au4(Tio)4 complex – most likely a tetrameric ring structure39 – was estimated to be a favorably eliminated structural formation present on the surface of the nanoparticle. The same tetrameric complex ion was obtained by ESI-MS analysis of a gold-tiopronin precursor complex, and more recently by MALDI-MS.39 The two separate analyses which yielded a remarkably similar mass spectrum indicated that the surface of AuNPs was dominated by cationic gold-thiolate complexes not dissimilar to the precursor complexes prior to reduction.
Kornberg and colleagues’ crystal structure of the Au102(p-MBA)44 cluster, published later in 2007, revealed the presence of semi-ring “staple” structures which capped a gold core.18 In the 2008 MALDI-MS study of Au25(SCH2CH2Ph)18 by Dass and co-workers, the first major fragment upon raising laser fluence corresponded to a loss of Au4(SCH2CH2Ph)4, as shown in Fig. 3.26 The same loss has been prominent in MALDI-MS spectra of Au38(SCH2CH2Ph)24 and Au68(SCH2CH2Ph)34.27 Heaven et al. published the crystal structure of [Au25(SCH2CH2Ph)18]− later in 2008.19 No Au4(SCH2CH2Ph)4 features were present on the cluster, suggesting that the feature appears during ionization prior to elimination. This idea is strongly reinforced by Dass’ recent observation of a similar elimination from Au68(SCH2CH2Ph)34 and Au38(SCH2CH2Ph)24.27 It should be noted that the cluster in Heaven’s crystal structure was negatively charged, while the tetramer loss is more prominent in the positive ion mode. Furthermore, tandem ESI-MS spectra obtained by Fields-Zinna et al. which shows a tetrameric ion generated from [Au25(SCH2CH2Ph)18]+ after collision-induced dissociation (CID).40The well-known “staple” Au2(SR)3 capping structure of this MPC was also present in the spectrum. This work demonstrates the capabilities of CID to provide an interesting view into the gold-thiolate capping structures of hydrophobic – and potentially hydrophilic – MPCs.
The tetrameric Au4(SR)4 feature may be intrinsic to nanoparticle structures: for the Au38(SCH3)24 nanoparticle, Häkkinen used density field theory to predict the existence of six (AuSCH3)4 rings surrounding the core.41 The tetrameric ring structure was described as having a “convergence in stability and electronic properties.”42 Furthermore, computational work by Gronbeck et al. investigated the differences between staple complexes, as seen in crystal structures, and tetrameric cycles and linear multimers of gold-thiolate complexes when located on a metallic gold Au(111) surface.43 The tetrameric ring complex was lower in energy than three-fold hollow thiolate binding, but higher in energy than staple structures. The prominence of these Au4(SR)4 ions suggests some degree of similarity between the architecture of gold-thiolate complexes and the cationic gold of AuNPs.
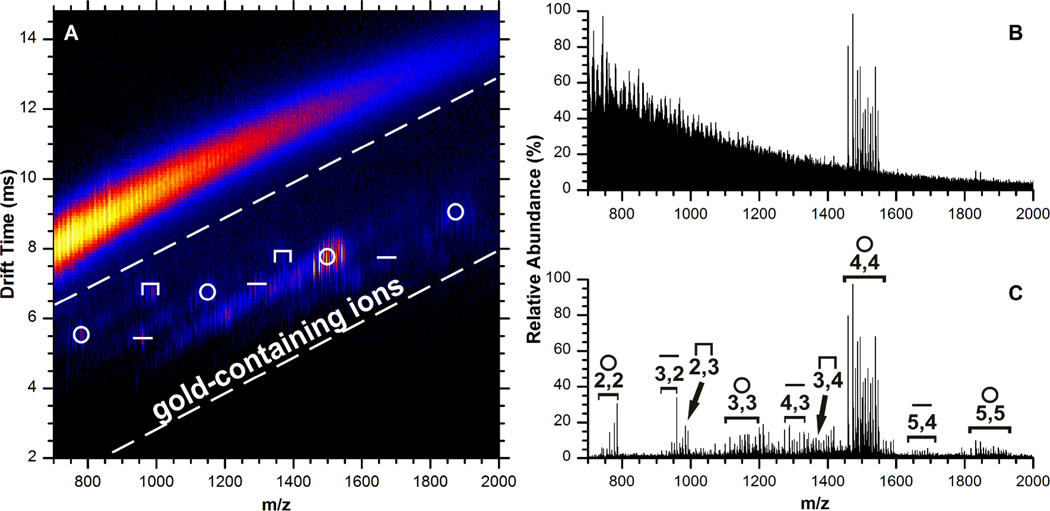
Gold-thiolate fragments other than the tetrameric Au4(SR)4 ion are generated from AuNP surfaces, as reported by Fields-Zinna et al.40 Our recent work, following the ion mobility spectrometry work of Zachariah et al.,44 utilized a coupled MALDI-ion mobility-mass spectrometry (IM-MS) technique to reduce chemical noise and observe lower-intensity ion species, revealing gold-thiolate fragments from the AuNP surface with multiple stoichiometries.45
Investigations of the relationship between gold-thiolate complexes and AuNP structure have implications for improving AuNP syntheses. A recent study has suggested that the physical structure of a gold-glutathionate complex controls the size of the AuNPs formed by reduction.46 Another study improved the yield of Au25(CH2CH2Ph)18 clusters by controlling the size of a gold-phenylethanethiolate precursor complex aggregate.47 These reports indicate that the next step in improving AuNP syntheses may involve precise control of the gold-thiolate complex structure. A technique yielding precise structural information on an atomic level would be required to advance such research. Mass spectrometry provided the first indicator of unique AuNP structural capping phenomena, and the continuing investigation of the relationship between gold-thiolate complexes and AuNP structure may require the unique capabilities of an MS-based platform.
Conclusion
Mass spectrometry is a powerful analytical tool in part because of its capacity for revealing what would otherwise be unobtainable information. For this reason, mass spectrometry has played a prominent role in discovery and application development of ligand-protected AuNPs. While much of the progress detailed in this report has occurred over the last two years, this progress has contributed greatly to our understanding of small AuNPs, thereby fueling interest in their unique properties and enabling potential applications. As the capabilities of mass spectrometry are extended further into the realm of AuNP research, it will continue to drive advances in the development and applications of thiolate-protected AuNPs.
Figure 5.
Ion mobility-mass spectrum of tiopronin-protected AuNPs in positive ion mode (A), and the total (B) and extracted (C) mass spectrum. Extracted signal is from the outlined region of the two dimensional plot. The symbols above the ion species indicate their assigned structure: ring (○), linear (–), and staple (Π). In panel C, species are labeled by their molecular formula x,y for Aux(Tio)y. The spectrum is very similar to that obtained from gold-tiopronin in positive ion mode. Reproduced with permission from ref. 45. Copyright 2010 American Chemical Society.
Acknowledgements
Financial support for this work was provided by a Chemistry-Biology Interface training grant (NIH 5T32GM065086) in support of K.M.H., NIH GM 076479 to D.E.C., and the Vanderbilt College of Arts and Sciences, the Vanderbilt Institute of Chemical Biology, and the American Society for Mass Spectrometry to J.A.M.
References
- 1.Faraday M. Philos Trans R Soc London. 1857;147:145–181. [Google Scholar]
- 2.Thompson D. Gold Bull. 2007;40:267–269. [Google Scholar]
- 3.Brust M, Walker M, Bethell D, Schiffrin DJ, Whyman R. J Chem Soc Chem Comm. 1994:801–802. [Google Scholar]
- 4.Cervera J, Manzanares JA, Mafe S. J Appl Phys. 2009;105:074315. [Google Scholar]
- 5.Pasquato L, Pengo P, Scrimin P. J Mater Chem. 2004;14:3481–3487. [Google Scholar]
- 6.Wilson R. Chem Soc Rev. 2008;37:2028–2045. doi: 10.1039/b712179m. [DOI] [PubMed] [Google Scholar]
- 7.Manea F, Bindoli C, Fallarini S, Lombardi G, Polito L, Lay L, Bonomi R, Mancin F, Scrimin P. Adv Mater. 2008;20:4348–4352. [Google Scholar]
- 8.Thaxton CS, Mirkin CA. In: Nanobiotechnology. Editon edn. Niemeyer C, Mirkin C, editors. Weinheim, Germany: Wiley-VCH Verlag GmbH & Co. KGaA; 2004. pp. 288–307. [Google Scholar]
- 9.Cliffel DE, Turner BN, Huffman BJ. In: Wiley Interdisciplinary Reviews: Nanomedicine and Nanobiotechnology. Editon edn. Baker JR, editor. Vol. 1. Hoboken, New Jersey: John Wiley & Sons, Inc.; 2009. pp. 47–59. [DOI] [PMC free article] [PubMed] [Google Scholar]
- 10.Chen SW, Ingram RS, Hostetler MJ, Pietron JJ, Murray RW, Schaaff TG, Khoury JT, Alvarez MM, Whetten RL. Science. 1998;280:2098–2101. doi: 10.1126/science.280.5372.2098. [DOI] [PubMed] [Google Scholar]
- 11.Alvarez MM, Khoury JT, Schaaff TG, Shafigullin MN, Vezmar I, Whetten RL. J Phys Chem B. 1997;101:3706–3712. [Google Scholar]
- 12.Negishi Y, Nobusada K, Tsukuda T. J. Am. Chem. Soc. 2005;127:5261–5270. doi: 10.1021/ja042218h. [DOI] [PubMed] [Google Scholar]
- 13.Terrill RH, Postlethwaite TA, Chen CH, Poon CD, Terzis A, Chen AD, Hutchison JE, Clark MR, Wignall G, Londono JD, Superfine R, Falvo M, Johnson CS, Samulski ET, Murray RW. J Am Chem Soc. 1995;117:12537–12548. [Google Scholar]
- 14.Hostetler MJ, Stokes JJ, Murray RW. Langmuir. 1996;12:3604–3612. [Google Scholar]
- 15.Schaaff TG, Knight G, Shafigullin MN, Borkman RF, Whetten RL. J Phys Chem B. 1998;102:10643–10646. [Google Scholar]
- 16.Arnold RJ, Reilly JP. J Am Chem Soc. 1998;120:1528–1532. [Google Scholar]
- 17.Schaaff TG, Shafigullin MN, Khoury JT, Vezmar I, Whetten RL, Cullen WG, First PN, Gutierrez-Wing C, Ascensio J, Jose-Yacaman MJ. J Phys Chem B. 1997;101:7885–7891. [Google Scholar]
- 18.Jadzinsky PD, Calero G, Ackerson CJ, Bushnell DA, Kornberg RD. Science. 2007;318:430–433. doi: 10.1126/science.1148624. [DOI] [PubMed] [Google Scholar]
- 19.Heaven MW, Dass A, White PS, Holt KM, Murray RW. J Am Chem Soc. 2008;130:3754–3755. doi: 10.1021/ja800561b. [DOI] [PubMed] [Google Scholar]
- 20.Lopez-Acevedo O, Akola J, Whetten RL, Gronbeck H, Hakkinen H. J Phys Chem C. 2009;113:5035–5038. [Google Scholar]
- 21.Whetten RL, Khoury JT, Alvarez MM, Murthy S, Vezmar I, Wang ZL, Stephens PW, Cleveland CL, Luedtke WD, Landman U. Adv Mater. 1996;8:428–433. [Google Scholar]
- 22.Alvarez MM, Khoury JT, Schaaff TG, Shafigullin M, Vezmar I, Whetten RL. Chem Phys Lett. 1997;266:91–98. [Google Scholar]
- 23.Schaaff TG. Anal Chem. 2004;76:6187–6196. doi: 10.1021/ac0353482. [DOI] [PubMed] [Google Scholar]
- 24.Wu Z, Suhan J, Jin RC. J Mater Chem. 2009;19:622–626. [Google Scholar]
- 25.Qian H, Jin R. Nano Letters. 2009 doi: 10.1021/nl902300y. [DOI] [PubMed] [Google Scholar]
- 26.Dass A, Stevenson A, Dubay GR, Tracy JB, Murray RW. J Am Chem Soc. 2008;130:5940–5946. doi: 10.1021/ja710323t. [DOI] [PubMed] [Google Scholar]
- 27.Dass A. J Am Chem Soc. 2009;131:11666–11667. doi: 10.1021/ja904713f. [DOI] [PubMed] [Google Scholar]
- 28.Vasil'ev YV, Khvostenko OG, Streletskii AV, Boltalina OV, Kotsiris SG, Drewello T. J Phys Chem A. 2006;110:5967–5972. doi: 10.1021/jp060568f. [DOI] [PubMed] [Google Scholar]
- 29.Tracy JB, Kalyuzhny G, Crowe MC, Balasubramanian R, Choi JP, Murray RW. J Am Chem Soc. 2007;129:6706–6707. doi: 10.1021/ja071042r. [DOI] [PubMed] [Google Scholar]
- 30.Fields-Zinna CA, Sardar R, Beasley CA, Murray RW. J Am Chem Soc. 2009;131:16266–16271. doi: 10.1021/ja906976w. [DOI] [PubMed] [Google Scholar]
- 31.Negishi Y, Chaki NK, Shichibu Y, Whetten RL, Tsukuda T. J Am Chem Soc. 2007;129:11322–11323. doi: 10.1021/ja073580+. [DOI] [PubMed] [Google Scholar]
- 32.Chaki NK, Negishi Y, Tsunoyama H, Shichibu Y, Tsukuda T. J Am Chem Soc. 2008;130:8608–8610. doi: 10.1021/ja8005379. [DOI] [PubMed] [Google Scholar]
- 33.Marshall AG, Hendrickson CL, Shi SDH. Anal Chem. 2002;74:253a–259a. doi: 10.1021/ac022010j. [DOI] [PubMed] [Google Scholar]
- 34.Gerdon AE, Wright DW, Cliffel DE. Biomacromolecules. 2005;6:3419–3424. doi: 10.1021/bm050475o. [DOI] [PubMed] [Google Scholar]
- 35.Dass A, Holt K, Parker JF, Feldberg SW, Murray RW. J Phys Chem C. 2008;112:20276–20283. [Google Scholar]
- 36.Hostetler MJ, Templeton AC, Murray RW. Langmuir. 1999;15:3782–3789. [Google Scholar]
- 37.Shaw CF. Chem Rev. 1999;99:2589–2600. doi: 10.1021/cr980431o. [DOI] [PubMed] [Google Scholar]
- 38.Gies AP, Hercules DM, Gerdon AE, Cliffel DE. J Am Chem Soc. 2007;129:1095–1104. doi: 10.1021/ja0639057. [DOI] [PubMed] [Google Scholar]
- 39.Simpson CA, Huffman BJ, Harkness KM, Tian P, Billinge SJL, Cliffel DE. (in preparation). [Google Scholar]
- 40.Fields-Zinna CA, Sampson JS, Crowe MC, Tracy JB, Parker JF, deNey AM, Muddiman DC, Murray RW. J Am Chem Soc. 2009;131:13844–13851. doi: 10.1021/ja905787y. [DOI] [PubMed] [Google Scholar]
- 41.Häkkinen H, Walter M, Gronbeck H. J Phys Chem B. 2006;110:9927–9931. doi: 10.1021/jp0619787. [DOI] [PubMed] [Google Scholar]
- 42.Grönbeck H, Walter M, Häkkinen H. J Am Chem Soc. 2006;128:10268–10275. doi: 10.1021/ja062584w. [DOI] [PubMed] [Google Scholar]
- 43.Grönbeck H, Häkkinen H, Whetten RL. J Phys Chem C. 2008;112:15940–15942. [Google Scholar]
- 44.Tsai DH, Zangmeister RA, Pease LF, Tarlov MJ, Zachariah MR. Langmuir. 2008;24:8483–8490. doi: 10.1021/la7024846. [DOI] [PubMed] [Google Scholar]
- 45.Harkness KM, Fenn LS, Cliffel DE, McLean JA. 2009 (submitted). [Google Scholar]
- 46.Briñas RP, Hu MH, Qian LP, Lymar ES, Hainfeld JF. J Am Chem Soc. 2008;130:975–982. doi: 10.1021/ja076333e. [DOI] [PMC free article] [PubMed] [Google Scholar]
- 47.Zhu M, Lanni E, Garg N, Bier ME, Jin R. J Am Chem Soc. 2008;130:1138–1139. doi: 10.1021/ja0782448. [DOI] [PubMed] [Google Scholar]


