

Abstract
There is an emerging need for viral gene specific quantitative PCR (qPCR) assays that validate and complement whole transcriptome level technologies, including microarray and next generation sequencing. Therefore, a compilation of qPCR assays that represented the breadth of the entire Herpes simplex virus type 1 (HSV-1) genome were developed and evaluated. SYBR Green-I-based quantitation of each of the 74 HSV-1 lytic genes enabled accurate and reproducible detection of viral genes using a minimal number of reaction conditions. The amplification specificity of these assays for HSV-1 target genes was confirmed by amplicon size and purity determination on agarose gels, melt temperature dissociation curve analysis, and direct DNA sequencing of amplified products. Analysis of representative target genes demonstrated that these assays accurately and reproducibly quantified target gene expression across a wide and linear range of detection. In addition, minimal intra- and inter-assay variability was observed with significant well-to-well and plate-to-plate/assay-to-assay precision. To evaluate the utility of the developed qPCR assay system, kinetic profiles of viral gene expression were determined for an array of representative genes from all HSV-1 transcriptional gene classes. Collectively, these data demonstrate that the compiled optimized qPCR assays is a scalable and cost-effective method to assess HSV-1 gene expression with broad application potential, including investigation of pathogenesis and antiviral therapies. In addition, they can be employed to validate and complement evolving technologies for genome-wide transcriptome analysis.
Keywords: Herpes simplex virus, RT-PCR, SYBR Green-I, Transcriptome, HSV-1, Quantitative PCR
1. Introduction
The human Herpesviridae family consists of 9 large DNA viruses that encode open reading frames that specify between 74 and 164 genes. The alphaherpesvirus, Herpes simplex virus type 1 (HSV-1), specifies a 152 kilobase pair genome that encodes 77 open reading frames of which three are diploid (Pellett and Roizman, 2007; Roizman et al, 2007). These genes are expressed during the HSV lytic replicative cycle in a triphasic sequential and coordinately regulated temporal cascade of gene expression (Honess and Roizman, 1974, 1975; Roizman et al., 1975). First, immediate early or alpha (IE/a) genes are expressed immediately upon deposition of viral DNA into the nucleus (Honess and Roizman, 1974, 1975). Next, IE proteins launch the expression of early or Beta (E/β3) genes that initiate viral DNA replication and elicit subsequent late or gamma (L/γ) gene expression (Honess and Roizman, 1974); Lastly, the L/γ genes consist of proteins that are either structural in nature or function to mediate capsid assembly, virion maturation, and viral egress (Honess and Roizman, 1974). The gamma gene class has been further subdivided into γ1 and γ2 genes, with γ2 gene transcription absolutely dependent on viral DNA replication. Consequently, the effects of cellular proteins, viral gene mutations/deletions, or pharmaceutical drugs on these highly ordered viral transcriptional patterns can provide insights into their functional activities. For example, HSV infected cells that are treated with the viral DNA replication inhibitors foscarnet or acyclovir exhibit an altered transcriptional pattern, whereby there is an accumulation of early β transcripts and suppression of late γ gene expression (Jones and Roizman, 1979; Holland et al, 1980; Hall et al., 1982).
Microarray and RNA sequencing (RNA-Seq) are emerging and expanding high throughput technologies that enable whole genome transcriptional analysis of the effects of various experimental conditions. In virus infected cells, these technologies enable simultaneous assessment of both host and viral transcription. However, despite these technologies generating data with immense depth, results still require confirmation by more standard and accepted approaches, such as quantitative real-time PCR (qPCR). qPCR arrays, such as the system presented in this study, can complement, corroborate, and validate results obtained from these contemporary methodologies. For most viruses with small genomes, designing qPCR assays that can assess whole genome transcriptional changes is relatively uncomplicated. However, for viruses with large complex genomes, like those of the Herpesviridae family, the enormity of the task can be challenging.
In order to assess the effects of various conditions on viral transcription, we have developed a compilation of qPCR assays within plate arrays that represent the breadth of the whole viral genome. These qPCR arrays were designed to: (1) represent the entire HSV genome across all HSV transcriptional classes; (2) utilize adaptable SYBR Green-I-based quantitation to alleviate probe design, synthesis and development that is expensive and would be required for 74 individual HSV-1 genes; (3) be specific for target viral genes without cross-reactivity to host cellular transcripts; (4) minimize the required number of amplification conditions; (5) follow, where possible, Minimal Information for Publication of Quantitative Realtime PCR Experiments (MIQE) guidelines for qPCR assay development (Bustin et al., 2009; Bustin, 2010; Huggett et al., 2013); (6) quantify levels of viral transcripts relative to a host reference gene; (7) be linear in amplification across varying target concentrations; and (8) be reproducible with minimal intra- or inter-assay variation. Described in this study is the development, evaluation and implementation of these assays to assess relative transcriptional kinetic profiles of representative genes from each transcriptional class.
2. Materials and methods
2.1. Viruses and cells
African green monkey kidney (Vero) cells were obtained from ATCC (Manassas, VA) and were maintained in DMEM supplemented with 5% FCS. The RE strain of HSV-1 (HSV-1(RE)), a known corneal keratitis inducing strain of HSV-1 (Hendricks et al., 1989; Hendricks and Tumpey, 1990), was one of the parental wildtype strains utilized in these studies and was obtained initially from Dr. James Hill, Louisiana State University Health Sciences Lions Eye Center. HSV-1(RE) virus stocks were propagated in Vero cells and stored as infectious cell preparations at −80 °C. Purified HSV-1 KOS strain (ATCC) viral genomic DNA was prepared on a sodium iodide gradient, resuspended in Tris EDTA buffer, and stored as aliquoted frozen stocks.
2.2. Primer design and synthesis
The published genomic sequence of human herpesvirus 1, strain 17 (Genbank Accession no. NC_001806.1) was used as template to identify comprehensive, genome-wide coding sequences for each HSV-1 transcript (McGeoch et al., 1988a, b). In order to specifically amplify regions within each coding sequence, unique primers were designed to avoid overlapping genes and assessed subsequently for potential hairpin formations, 3′ complementarities, and self-annealing sites using OligoCalc (Kibbe, 2007). Primer pairs were selected to generate amplicons of 90–200 base pairs (Tables 1–5). All primer sets were designed initially with uniform annealing temperatures to facilitate assessing multiple gene targets within the same PCR run. Prospective primers and their generated amplicons were analyzed in silico for cross-reactivity and recognition of other HSV-1 strains and verified to have no significant homology to Homo sapiens host genes using the genomic database for human and human transcripts and BLASTn (NCBI). All designed iterations of primer pairs were tested empirically for amplification of target genes from HSV-1 KOS genomic viral DNA and cDNA isolated from HSV-1 RE infected cells. Any primer pairs that exhibited any amplification product at or before 30 cycles from cDNA prepared from non-infected cell lysates were excluded from further analysis. The specificity of each selected primer pair was evaluated by melt curve analysis, agarose gel electrophoresis, and DNA sequencing and confirmed to be a single uniform amplification product of appropriate apparent molecular size and sequence. Final optimized primer sequences, associated gene references, specific assay conditions, and amplicon characteristics are described in Tables 1–5. In addition, cellular 18s ribosomal RNA (rRNA) was utilized to normalize qPCR reactions (FOR: 5′CCAGTAAGTGCGGGTCATAAGC3′; REV: 5′GCCTCACTAAACCATCCAATCGG3′) (Mbong et al., 2012). All primers were synthesized by Integrated DNA Technologies (IDT-DNA, Coralville, IA, USA).
Table 1.
HSV-1 alpha (α) genes: oligonucleotide primer sequences, PCR annealing temperatures, expected PCR product size, and observed melt temperatures.
| Gene name | Gene ID no. | Primer sequence (5′-3′) | Annealing | Size (bp) | Melt temp. |
|---|---|---|---|---|---|
| RS1:ICP4 | 2703391 | FOR: 5′-CGGTGATGAAGGAGCTGCTGTTGC-3′ | 55 | 145 | 91 |
| REV: 5′-CTGATCACGCGGCTGCTGTACA-3′ | |||||
| US1: ICP22 | 2703435 | FOR: 5′-ATGCAATGCTACGGCGCTCGGT-3′ | 55 | 99 | 88 |
| REV: 5′-ACAGCTGATTGATACACTGGCGC-3′ | |||||
| US12: ICP47 | 2703441 | FOR: 5′-TCGTGCACGGCGGTTCTG-3′ | 55 | 110 | 86.5 |
| REV: 5′-ACCTTCCTGGACACCATGCG-3′ | |||||
| RL2: ICP0 | 2703389 | FOR: 5′-GTCGCCTTACGTGAACAAGAC-3′ | 55 | 114 | 85.5 |
| REV: 5′-GTCGCCATGTTTCCCGTCTG-3′ | |||||
| UL54: ICP27 | 2703426 | FOR: 5′-AGACGCCTCGTCCGACGGA-3′ | 55 | 74 | 87 |
| REV: 5′-GAGGCGCGACCACACACTGT-3′ |
Table 5.
HSV-1 gamma2 (γ2) genes: oligonucleotide primer sequences, PCR annealing temperatures, expected PCR product size, and observed melt temperatures.
| Gene name | Gene ID no. | Primer sequence (5′-3′) | Annealing | Size (bp) | Melt temp. |
|---|---|---|---|---|---|
| US2: Membrane-Associated Ubiquitin Interacting | 2703399 | FOR: 5′-GCACCGGATGGGACGTCGT-3′ | 55 | 101 | 85.5 |
| REV: 5′-CGGACGGGAGCGCGATTGT-3′ | |||||
| US11: dsRNA Binding Protein | 2703439 | FOR: 5′-TCTCTGGGAGCTCGCGGTA-3′ | 55 | 143 | 87.5 |
| REV: 5′-GGTGCGGACACTACGATCT-3′ | |||||
| RL1: ICP34.5 | 2703395 | FOR: 5′-CGCCTTCTTGTTCGCTGCT-3′ | 55 | 80 | 86 |
| REV: 5′-CCAGTCGTCGTCATCGTCGT-3′ | |||||
| UL3: Nucleocytoplasmic Shuffling Protein | 2703461 | FOR: 5′-GGAGTTCCCTCTGCGCTT-3′ | 55 | 107 | 84.5 |
| REV: 5′-CGAATGGAATCTGCGGGAGT-3′ | |||||
| UL4: Nuclear Protein Associated with ICP22 | 2703362 | FOR: 5′-TGGTTGCAGTGATGTAAATGGTG-3′ | 55 | 182 | 89 |
| REV: 5′-TGCCTACCGCTTTATAGGCCG-3′ | |||||
| UL10: Glycoprotein M (gM) | 2703379 | FOR: 5′-GACGTATCTGCGTCAGGTGC-3′ | 55 | 110 | 89 |
| REV: 5′-CCGTGCACAGGAAGACGC-3′ | |||||
| UL14: Tegument Protein | 2703384 | FOR: 5′-GTTAGCTGCCACATGACCAGC-3′ | 55 | 145 | 87 |
| REV: 5′-TGGACGCCGTGGACGATCG-3′ | |||||
| UL25: Capsid Vertices Protein | 2703377 | FOR: 5′-GCCGCTACGATACGACAC-3′ | 55 | 99 | 86 |
| REV: 5′-CAGGTCCCGAACACCAC-3′ | |||||
| UL32: DNA Packaging Protein | 2703352 | FOR: 5′-CACGGAGGCCCGGAGTC-3′ | 55 | 154 | 90 |
| REV: 5′-CGATGCCCAGCCCGACC-3′ | |||||
| UL33: Interacts with DNA Packaging Terminase | 2703353 | FOR: 5′-CGTCTGGTTCGAGGATATGAC-3′ | 55 | 121 | 87.5 |
| REV: 5′-AGGCCCGGCGTACGTCAG-3′ | |||||
| UL35: Capsid Hexons | 2703356 | FOR: 5′-TTTCTCCGCGGTCAGGCG-3′ | 55 | 89 | 87 |
| REV: 5′-TCGCCCGCGAACATAGGC-3′ | |||||
| UL36: Ubiquitin Specific Protease | 2703357 | FOR: 5′-ACTGTCATACTCTGTGTAGTCG-3′ | 55 | 133 | 89 |
| REV: 5′-CGCGCTGGGAAAGCTGAGT-3′ | |||||
| UL38: Interacts with Capsid Triplex Subunit 2 | 2703359 | FOR: 5′-CGTGATCAAGAGCCAGCTCC-3′ | 55 | 192 | 91 |
| REV: 5′-ACCTGGCCAGCCGAGCAAC-3′ | |||||
| UL44: Glycoprotein C (gC) | 2703410 | FOR: 5′-GAGGAGGTCCTGACGAACATCACC-3′ | 55 | 140 | 90.5 |
| REV: 5′-CCGGTGACAGAATACAACGGAGG-3′ | |||||
| UL45: Type 2 Membrane Protein | 2703412 | FOR: 5′-GTGATCATTGCCGCGTTGGT-3′ | 55 | 217 | 91 |
| REV: 5′-TTGCCGACTGGACGCGTGC-3′ | |||||
| UL49A: Glycoprotein N (gN) | 2703419 | FOR: 5′-TGGGTCTCGCACCGCGC-3′ | 55 | 91 | 91.5 |
| REV: 5′-CCTTAGCGGCGGGAGACG-3′ | |||||
| UL53: Glycoprotein K (gK) | 2703425 | FOR: 5′-CTTGAACTACGCAGGCCGCATC-3′ REV: 5′-CGGGTCCGTCTCAAACAACTGAAC-3′ | 55 | 127 | 85.5 |
| UL55: Nuclear Protein | 2703427 | FOR: 5′-GGCCGTGCGGAGTTACCTG-3′ REV: 5′-GGTGGTTAACCAGGTCCGC-3′ | 55 | 143 | 85 |
| UL56: Type 2 Membrane Protein | 2703428 | FOR: 5′-CCTGTACAGCTCGCGCGAAT-3′ | 55 | 136 | 89 |
| REV: 5′-CCCAACCTATGCCACTGTCG-3′ |
2.3. Total RNA extraction, isolation, and purification
To initiate synchronous infection for kinetics analysis, HSV-1 RE strain (MOI = 5) was adsorbed for 1 h on subconfluent Vero cells in 12-well plates that were pre-chilled (4°C) in 500 μl DMEM, 1.5% heat-inactivated FCS, as we have described previously (Foster et al., 1998, 1999; Kadeppagari et al., 2012; Sanchez et al., 2012). Following the 1 h incubation, all media was removed, replaced with 1 ml of pre-warmed (37 °C) media and incubated at 37 °C for 0, 1, 2, 4, 8, 12, 18, or 24 h. At the respective time points, culture supernatants were removed and cells were lysed in 350 μl RLT Buffer (Qiagen RNeasy Mini Kit) with gentle scraping of each well to harvest all cell lysates. Cell lysates were stored at −80 °C until RNA purification. Within 24 h of harvest, cell lysates were thawed on ice and total RNA was purified using the RNeasy Mini Kit (Qiagen, Valencia, CA, USA) according to the manufacturer's protocol with the exception that two optional DNAse I digestion steps were employed to ensure the absence of contaminating viral genomic DNA. First, DNAseI was added to cell lysates prior to RNA purification and then contaminating DNA was further digested via an on-column digestion using RNAse-free DNAse I in Buffer RDD for 15 min at room temperature. All samples were eluted in 50 μl of RNAse-free water and quantified by spectrophotometry.
2.4. cDNA synthesis
cDNA was synthesized immediately after RNA purification using the iScript™ cDNA Synthesis Kit (Bio-Rad Laboratories, Hercules, CA, USA). Each 100 μl cDNA reaction consisted of 20 μl 5 × iScript reaction mix, 5 μl iScript reverse transcriptase, and 4 μg RNA template. Thermal cycling was conducted as follows: 5 min at 25 °C, 30 min at 42 °C, followed by 5 min at 85 °C. Parallel cDNA reactions lacking reverse transcriptase enzyme were included for each experiment to evaluate the presence of contaminating genomic DNA.
2.5. SYBR Green-I qPCR conditions
SYBR Green-I based qPCR was performed using the indicated primer pairs for each target gene (Tables 1–5). Real-time qPCR was carried out using iQ™ SYBR® Green Supermix (Bio-Rad Laboratories; 40 mM Tris-HCl pH 8.4, 100 mM KCl, 1.6 mM dNTPs, 0.625U antibody-mediated hot-start iTaq DNA polymerase, 6 mM MgCl2, SYBR Green-I, 20 nM fluorescein, and stabilizers). Each 25 μl total PCR reaction contained 3 μl of 1:4 diluted cDNA template, 12.5 μl iQ™ SYBR® Green Supermix, and 200 nM of each primer. All realtime qPCR reactions were carried out using a Bio-Rad CFX96™ Real-Time System and CFX Manager 2.0 (Bio-Rad Laboratories, Hercules, CA, USA) in white Multiplate™ 96-well plates covered with Microseal ‘B’ adhesive seals. Three-step cycling parameters were used for a majority of PCR reactions and were as follows: initial denaturation at 95 °C for 3 min followed by 30 cycles of 95 °C for 15 s, annealing at 55 °C for 30 s, followed by a 30 s extension at 72 °C. To minimize cross-reactivity issues and increase specificity, a two-step cycling parameter was used for PCR reactions against UL30 and UL42 and was as follows: initial denaturation at 95 °C for 3 min followed by 30 cycles of 95 °C for 15 s and annealing at 65 °C for 30 s. Following amplification, amplicon specificity and purity for each PCR run was confirmed by melt curve analysis.
2.6. Agarose gel electrophoresis, PCR purification, and DNA sequencing
7 μl aliquots of all HSV target gene PCR products were analyzed for purity and specificity on a 1.8% agarose gel run in 0.5 × Tris Borate EDTA (TBE) buffer. The remaining amplified DNA was purified using DNA Clean and Concentrator-5 columns and reagents (Zymo Research) according to the manufacturer's directions. Purified PCR products were sequenced directly (ACGT, Inc) using gene specific primers. Sequences were compared to the HSV-1 genome and the NCBI database (BLASTn) to confirm specificity of each HSV target gene amplified.
2.7. Assay precision and reproducibility
Assay precision was determined for representative HSV target genes. Amplification of target genes across a 2-fold dilution series of HSV-1 KOS strain genomic DNA (from 42.2 pg to 1350 pg) was assessed and the Cq values were plotted relative to genomic DNA. The linearity of amplification for each gene was determined by the R2 values of each dilution series. Intra-assay (within the day/across the plate) and inter-assay (independent assessment over 4 days/between plate) variability was determined according to MIQE (Minimal Information for Publication of Quantitative Realtime PCR Experiments) guidelines (McGowin et al., 2009; Bustin et al., 2009; Bustin, 2010; Huggett et al., 2013). The mean, standard deviation (S.D.), coefficient of variation (CV) of the cycle of quantification (Cq) were calculated separately for amplification of representative target genes from cDNA prepared at 4 and 12 h post infection (h p.i.) or genomic viral DNA. The intra- and inter-assay variability assessed by the CV was determined by the S.D./mean multiplied by 100 to express as a percentage CV, as described previously (Santhosh et al., 2007; Bustin et al., 2009; Amer and Almajhdi, 2011).
2.8. Analysis of HSV transcriptional profiles
qPCR was performed on arrays of representative genes from each HSV-1 transcriptional gene class to quantify viral transcript abundance at 0,1, 2, 4, 8,12,18, and 24 h p.i. Viral gene transcripts were normalized to the mean Cq values (meanCqof18s@timeX) of cellular 18s rRNA expression, which was determined as the mean Cq of in triplicate parallel reactions for each time point (Chey et al., 2010). Normalized viral transcript expression levels relative to the internal cellular 18s rRNA reference gene were calculated by the ΔCq at time X using the equation: ΔCqtimeX = (Cqofviraltranscript@timeX – meanCqof18s@timeX). Relative fold change in gene expression for each specific viral gene was calculated by the 2−ΔΔCq method (Livak and Schmittgen, 2001). For each time point of each gene analyzed, the ΔΔCq was determined relative to that gene's ΔCq value at a time point for that gene's kinetic class where gene expression was first detected. That was for α genes at 1 h p.i., for β genes at 2h p.i. and for γ genes at 4h p.i. Therefore, the ΔΔq = (ΔCqof viral transcript@timeX – ΔCqofviraltranscript@timeY); where Y = (α genes:1 h p.i.; β genes:2 h p.i.; γ genes:4 h p.i.). Relative fold change for each time point was then expressed by the equation 2−ΔΔCq.
2.9. Heat map visualization of HSV transcriptional profiles
Heat maps were generated within Microsoft Excel to assist in visualization and comparative analysis of gene expression patterns. The fold change values across each individual gene, as calculated by the 2−ΔΔCq method (Livak and Schmittgen, 2001), were converted to colorized values using Excel's conditional formatting color-scale function and a three defined point color scale gradient: (1) no expression was assigned a bright green color; (2) the highest value in the kinetic series was assigned a bright red color; (3) the 50th percentile within the kinetic series was assigned a bright yellow color; (4) values that fell within these three specific color identifiers were assigned within the gradient of colors between these values. Assigned color values and genes were segregated by gene transcriptional class and figures were compiled in Adobe Photoshop.
3. Results
3.1. Design and optimization of SYBR Green-I-based quantitative PCR assays for the whole transcriptome evaluation of HSV-1 gene expression
In order to enable whole HSV-1 transcriptome level validation of microarray and next generation sequencing (NGS) methodologies, we developed a series of primer sets that target each lytic gene of the HSV-1 genome. After several design and testing iterations, final optimized primer sets were selected to not be affected by nucleotide variations amongst HSV-1 strains, to not be cross-reactive with cellular genes, and to not form primer-dimers. The detailed sequences, gene identification numbers, and amplicon size of these primers are segregated by their respective documented or suggested gene transcriptional class (Pellett and Roizman, 2007; Roizman et al, 2007) and are shown in Tables 1–5. Criteria for primer set acceptability included: (1) number of cycles required to develop a detectable signal (Cq) from HSV-1 genomic DNA and infected cell cDNA; (2) complete absence of amplification in control samples; (3) uniform primer concentrations for all gene targets; (4) simultaneous arrayed analysis of most HSV-1 genes by minimizing the number of annealing temperatures required; (5) linearity and accuracy of gene amplifications; (6) reproducibility and precision of amplification reactions; and (7) ability to detect target genes from several HSV-1 strains, includingHSV-1 syn17+, KOS, and RE from genomic and cDNA templates.
Optimal quantitative SYBR Green-I PCR assay conditions were established for these primer sets that resulted in robust linear amplification of HSV-1 target gene transcripts with no amplification signals from uninfected cDNA controls. This required two different reaction conditions. For the vast majority of HSV genes (72 of 74 genes) and cellular 18s rRNA reference gene, reaction conditions with a 55 °C annealing temperature was utilized (Tables 1–5; Fig. 1C; Supplemental Figs. 1C, 2C, and 3C). However, two beta genes, UL30 and UL42, required altered reaction conditions with an annealing temperature of 65 °C in order to fulfill all of our specificity requirements (Table 2; Supplemental Fig. 2B and C). Specific reaction conditions are provided in Section 2.5. All individual qPCR assays exhibited a single linear amplification phase within the logarithmic curve for both genomic viral DNA and cDNA of viral transcripts from infected cells. However, the HSV-1 genomic DNA and infected cell cDNA amplification curves differed due to variances in the levels of the target gene at the specific time point assessed. The method of calculating Cq values from where they cross the indicated threshold are provided within the Section 2. Since HSV-1 has a limited number of spliced genes, primers could not be designed across introns. Therefore, the most critical assay optimization was ensuring that viral genomic DNA was removed completely prior to quantitative analysis. This was verified by the absence of detectable amplification within the no reverse transcriptase (NRT) controls. The complete degradation of genomic viral DNA was ensured by extracting, processing, and purifying RNA with the protocols in Section 2.3.
Fig. 1.
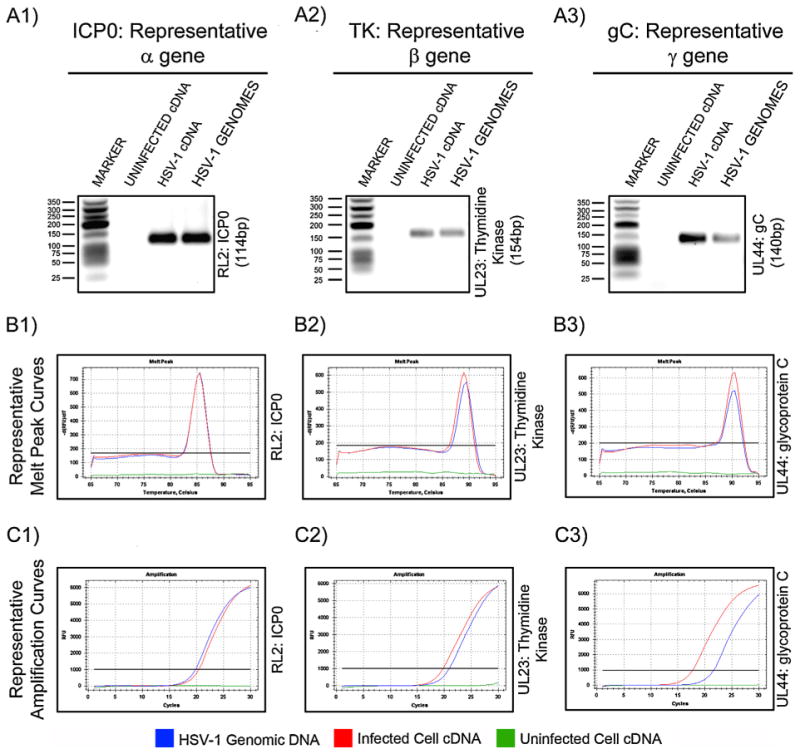
Evaluation of amplification and assay specificity of representative genes from each transcriptional class: RL2/ICP0 (α gene: A1, B1, C1); UL23/Thymidine Kinase β gene: A2, B2, C2); UL44/gC(γ2 gene: A3, B3, C3). Specific amplification of the indicated target genes was assessed by size and purity determination of amplified products on 1.8% TBE agarose gels (A), comparative melt curves of amplified products (B), and relative amplification curves (C). Target specificity and amplification was determined using HSV-1 KOS genomic DNA (HSV-1 genomes; blue lines), cDNA from uninfected cells (uninfected cDNA; green lines), or cDNA from HSV-1 RE infected cells (HSV-1 cDNA; red lines). (For interpretation of the references to color in this figure legend, the reader is referred to the web version of the article.)
Table 2.
HSV-1 beta (β) genes: oligonucleotide primer sequences, PCR annealing temperatures, expected PCR product size, and observed melt temperatures.
| Gene name | Gene ID no. | Primer sequence (5′–3′) | Annealing | Size (bp) | Melt temp. |
|---|---|---|---|---|---|
| UL2: Uracil-DNA Glycosylase | 2703370 | FOR: 5′-GACTTGCGTTTAGCGTGCGC-3′ | 55 | 109 | 87 |
| REV: 5′-CAACCGTGGCCGCTCATC-3′ | |||||
| UL5: Helicase-Primase-Helicase Subunit | 2703420 | FOR: 5′-CTCCCGGAGCGGATTTAAG-3′ | 55 | 118 | 86 |
| REV: 5′-GGACAAGGTCGCCATCTG-3′ | |||||
| UL8: Helicase-Primase Subunit | 2703432 | FOR: 5′-GGTGATGAGCGCAGTCC-3′ | 55 | 100 | 88 |
| REV: 5′-GTCGTGCGTGTCTGTCC-3′ | |||||
| UL9: Ori Binding Helicase | 2703434 | FOR: 5′-CATGTAGCGGTCGTAGTGG-3′ | 55 | 131 | 88.5 |
| REV: 5′-GGGAGCTGTTGTGCCTGT-3′ | |||||
| UL12: Deoxyribonuclease | 2703382 | FOR: 5′-TGGCGTTGTGCTTCAGCCA-3′ | 55 | 106 | 88.5 |
| REV: 5′-TGCCAGCTATGGGCCCTG-3′ | |||||
| UL23: Thymidine Kinase | 2703374 | FOR: 5′-TCGATGTGTCTGTCCTCCG-3′ | 55 | 154 | 89 (89.5a) |
| REV: 5′-ATCCCATCGCCGCCCTC-3′ | |||||
| UL29: ICP8 | 2703458 | FOR: 5′-CATCAGCTGCTCCACCTCGCG-3′ | 55 | 130 | 88 |
| REV: 5′GCAGTACGTGGACCAGGCGGT-3′ | |||||
| UL30: DNA Polymerase Catalytic Subunit | 2703462 | FOR: 5′-CATCACCGACCCGGAGAGGGAC-3′ | 65 | 92 | 86 |
| REV: 5′-GGGCCAGGCGCTTGTTGGTGTA-3′ | |||||
| UL39: Ribonucleotide Reductase Subunit 1 | 2703361 | FOR: 5′-GACTTTCACGGGGAGGAGTT-3′ | 55 | 167 | 87 |
| REV: 5′TAGATGTAGTGGCGGTTCACC-3′ | |||||
| UL40: Ribonucleotide Reductase Subunit 2 | 2703364 | FOR: 5′-GTCCCGACATTAACCACCTG-3′ | 55 | 118 | 85 |
| REV: 5′-AAGCTGAGCTCGCCCTCG-3′ | |||||
| UL42: Polymerase Processivity | 2703407 | FOR: 5′ACGTCCGACGGCGAGG-3′ | 65 | 111 | 87 |
| REV: 5′-CAGGCGCAACTGAACGTC-3′ | |||||
| UL50: dUTPase | 2703421 | FOR: 5′-GTGACTACGGCCCTACCG-3′ | 55 | 141 | 88.5 |
| REV: 5′GAAACCGGCATCCTCCTCG-3′ | |||||
| UL52: Helicase-Primase-Primase Subunit | 2703423 | FOR: 5′TGTCCGACCGTGAATTCATTAC-3′ | 55 | 106 | 85 |
| REV: 5′TTGGGGTCCTGGGTCGTCA-3′ |
The melt temperature for the HSV-1 KOS genomic DNA was 0.5° greater than for the HSV-1 RE cDNA).
Supplementary material related to this article can be found, in the online version, at http://dx.doi.org/10.1016/j.jviromet.2014.02.010.
3.2. Melting curve analysis of amplified gene products
Following real-time gene amplification, a dissociation curve analysis was performed to establish each gene product's specific melting temperature (Tm) and that only a single Tm, which represented a single amplification product, was present. Tm's for individual HSV-1 genes ranged from 83.5 °C to 91.5 °C and are presented for each gene in Tables 1–5. All reactions where potential HSV-1 target genes were present (HSV-1 infected cell cDNA and HSV-1 KOS genomic DNA) exhibited a single dissociation peak (Fig. 1B, red or blue lines; Supplemental Figs. 1B, 2B and 3B, red or blue lines). No dissociation curve/Tm was reported for any reactions from cDNA made from uninfected cells due to lack of PCR amplification (Fig. 1B, green lines; Supplemental Figs. 1B, 2B and 3B, green lines). For two genes, UL23/thymidine kinase (TK) and UL41/virion host shutoff (VHS), there was a 0.5 °C difference between amplification products from HSV-1 genomic DNA from the KOS strain versus cDNA from the RE strain (Tables 2 and 4; Fig. 1 :B2, red versus blue lines). In silico and sequencing analysis of these amplification products revealed a one nucleotide difference within the PCR products of these two strains that could account for the observed differences in Tm. The Tm's reported in Tables 1–5 can be utilized as a reference to confirm specificity and proper gene amplification in future experiments.
Table 4.
HSV-1 gamma1 (γ1) genes: oligonucleotide primer sequences, PCR annealing temperatures, expected PCR product size, and observed melt temperatures.
| Gene name | Gene ID no. | Primer sequence (5′-3′) | Annealing | Size (bp) | Melt temp. |
|---|---|---|---|---|---|
| US3: Kinase | 2703401 | FOR: 5′-GTCACGTGTCTGGTCCTCC-3′ | 55 | 99 | 84.5 |
| REV: 5′-GGAGACCGCTGCGATCTG-3′ | |||||
| US4: Glycoprotein G (gG) | 2703404 | FOR: 5′-GGTTCTTGTCGGTGTATCGG-3′ | 55 | 110 | 85.5 |
| REV: 5′-CGGTCTGGGTCATGTTGG-3′ | |||||
| US6: Glycoprotein D (gD) | 2703444 | FOR: 5′-CTATGACAGCTTCAGCGCCGTCAG-3′ | 55 | 112 | 86.5 |
| REV: 5′-CGTCCAGTCGTTTATCTTCACGAGC-3′ | |||||
| US7: Glycoprotein I (gI) | 2703446 | FOR: 5′-GACGGCGTAGTGGAGGAA-3′ | 55 | 110 | 84 |
| REV: 5′-GGGTAGTGCCACAGCTCT-3′ | |||||
| US8: Glycoprotein E (gE) | 2703448 | FOR: 5′-CGAGGACGTTTCGTTGCTTCC-3′ | 55 | 117 | 87.5 |
| REV: 5′-GAGACCCACGACGGGTGTAA-3′ | |||||
| US8A: Type 2 Membrane Protein | 2703450 | FOR: 5′-GGCATCAATCTCGCCGCCA-3′ | 55 | 163 | 87.5 |
| REV: 5′-GTTCGGCGACCGACGTGG-3′ | |||||
| US10: Unknown Function | 2703436 | FOR: 5′-ACAGGTCGTGCATGTGTC-3′ | 55 | 109 | 87 |
| REV: 5′-CGGGCCAACCAAGAGAC-3′ | |||||
| UL7: Tegument Protein | 2703431 | FOR: 5′-GGTTGCGGTTCGTTCTGGAC-3′ | 55 | 125 | 86.5 |
| REV: 5′-CTCGTTGGCCGTCAGGACC-3′ | |||||
| UL16: Tegument Protein | 2703386 | FOR: 5′-CAGGTCGCTGTCCATGGCC-3′ | 55 | 131 | 90.5 |
| REV: 5′-AGCTGGATGGCGCGTATCTG-3′ | |||||
| UL18: Capsid Triplex Subunit 1 | 2703366 | FOR: 5′-GACCAGCGATCGCAGCTCG-3′′ | 55 | 105 | 86.5 |
| REV: 5′-GGGCTGCCAGACCTCAACG-3′ | |||||
| UL20: Virus Egress Membrane Protein | 2703371 | FOR: 5′-CGTCCGGACTGAAGGTCTC-3′ | 55 | 137 | 87 |
| REV: 5′-GCTCCTCCTGTACGTTAACATC-3′ | |||||
| UL24: Nuclear Protein | 2703375 | FOR: 5′-GCCGCGAGAACGCGCAG-3′ | 55 | 178 | 87.5 |
| REV: 5′-CCTCGAATACCGAGCGACC-3′ | |||||
| UL27: Glycoprotein B (gB) | 2703455 | FOR: 5′-TACTGCGGCTGGCCCACCTTG-3′ | 55 | 114 | 88.5 |
| REV: 5′-GCTCTCGCGCGTGGACCTG-3′ | |||||
| UL34: Type 2 Membrane Nuclear Egress Protein | 2703355 | FOR: 5′-CAGAACACCGGCGTGTCGG-3′ | 55 | 150 | 88 |
| REV: 5′-CTTGATGGTGTCCAGGTCGC-3′ | |||||
| UL37: Tegument Protein | 2703358 | FOR: 5′-GCAGTACTGACTCACCGCGT-3′ | 55 | 193 | 91 |
| REV: 5′-CGCAGACCCCCTGATTCGC-3′ | |||||
| UL41: RNAse Virion Host Shutoff (VHS) | 2703365 | FOR: 5′-GAATTTCGGTCCACGAGACGCG-3′ | 55 | 158 | 91 (91.5a) |
| REV: 5′-GGATGTGCTGCGCGAATGTCACT-3′ | |||||
| UL46: Modulator of VP16 | 2703413 | FOR: 5′-GTTTTCGTAGACCCGCATCC-3′ | 55 | 183 | 90.5 |
| REV: 5′-ATGGAAGCCACGTATCTGACG-3′ | |||||
| UL47: Modulator of VP16 | 2703415 | FOR: 5′-CTCCAGAACCTCCACCTTGGG-3′ | 55 | 113 | 88.5 |
| REV: 5′-CGTCGCCGCTGTTCCTAGA-3′ | |||||
| UL51: Tegument Protein | 2703422 | FOR: 5′-AGCACATCCGCGGACTTGTC-3′ | 55 | 145 | 88.5 |
| REV: 5′-ACCACCCCGGGTTCGAGG-3′ |
The melt temperature for the HSV-1 KOS genomic DNA was 0.5° less than for the HSV-1 RE cDNA).
3.3. Specificity of quantitative PCR assays
The ability of each reaction to amplify a single PCR product representative of its specific gene target was further confirmed by agarose gel electrophoresis and DNA sequencing. Following amplification reactions, all HSV PCR products from each of the 3 conditions were separated on a 1.8% TBE agarose gel. All amplification reactions where potential HSV-1 target genes were present (HSV-1 infected cell cDNA and HSV-1 KOS genomic DNA) exhibited a single amplification product (Fig. 1A; Supplemental Figs. 1A, 2A and 3A) that had an apparent molecular weight that corresponded to the calculated molecular weights of the specific amplicons (Tables 1–5). As expected, no PCR products were evident in amplification reactions of cDNA from uninfected cells. Amplified gene products were sent for direct sequencing and determined to be specific for each HSV-1 target gene. Collectively, these analyses indicated that the observed amplification plots for each target gene were specific for the HSV-1 target that they were designed to detect.
3.4. Assessment of assay linearity and precision
The linearity and precision of the developed quantitative PCR assays for representative genes from the three HSV-1 transcriptional gene classes was evaluated across a 2 fold dilution series of HSV-1 genomic DNA. The resulting amplification plots and analysis of linearity are shown (Fig. 2B and A, respectively). In these reactions, amplification of each of these representative genes across serial 2 fold dilutions of HSV-1 genomic DNA exhibited notable linearity with R2 values ranging from 0.9905 to 0.9988.
Fig. 2.
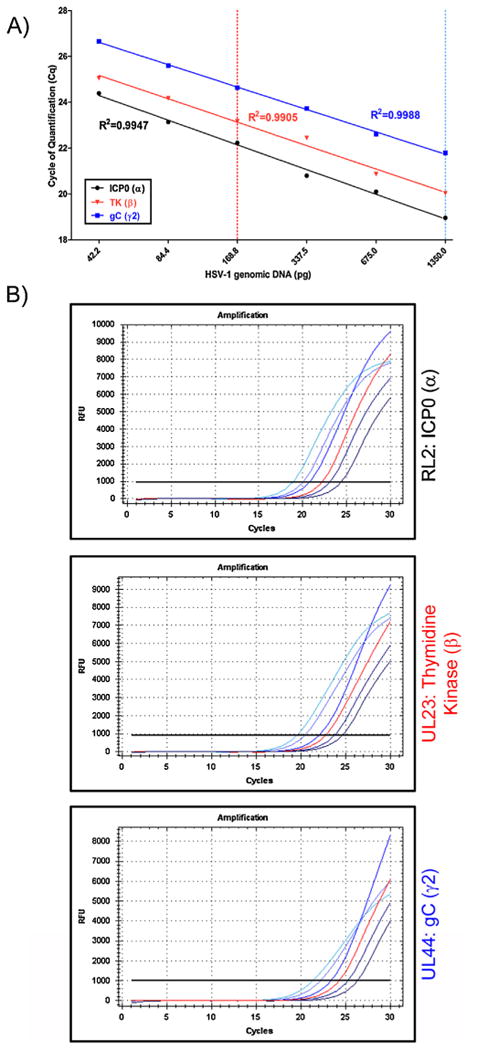
Determination of the linearity of amplification of representative genes from each transcriptional class: RL2/ICP0 (α gene); UL23/Thymidine Kinase (β gene); UL44/gC (γ2 gene). The Cq values for amplification of serial 2 fold dilutions of HSV-1 KOS genomic DNA were determined (B) and plotted relative to the quantity of viral genomic DNA (A). Red and light blue dotted lines (A) correspond to the 168.8 pg (red) and 1350 pg (light blue) amplification curves (B). The R2 value for each representative gene's dilution series is shown as an assessment of assay linearity. (For interpretation of the references to color in this figure legend, the reader is referred to the web version of the article.)
To further assess the precision of the developed assays, intra- and inter-assay variability was determined for representative genes from each of HSV's transcriptional gene classes in accordance with MIQE guidelines (Bustin et al, 2009; Bustin, 2010; Huggett et al., 2013). For each representative gene, precision and reproducibility of each assay was established based on the Cq values obtained from either three separate reactions within a single run (intra-assay or well-to-well variability) or in three consecutive runs over 4 days (inter-assay or plate-to-plate/run-to-run variability) (Table 6) (Santhosh et al., 2007; Amer and Almajhdi, 2011). The calculated S.D. and CV for each intra-assay assessment were low, ranging from 0.02 to 0.12 and from 0.10% to 0.65%, respectively. The inter-assay variability was also exceptionally low with a calculated S.D. range from 0.05 to 0.36 and a CV range from 0.28% to 1.66%.
Table 6.
Representative analysis of assay reproducibility in accordance with MIQE guidelines.
| Variation | Gene analyzed | Template | Cycle of quantification | ||
|---|---|---|---|---|---|
|
| |||||
| Mean | S.D. | % CV | |||
| Intra-assay | RL2: ICP0 | 4 h p.i. cDNA | 20.67 | 0.04 | 0.19 |
| RL2: ICP0 | 12 h p.i. cDNA | 18.04 | 0.02 | 0.10 | |
| RL2: ICP0 | HSV-1 genomic DNA | 20.53 | 0.04 | 0.19 | |
| UL23:TK | 4 h p.i. cDNA | 17.52 | 0.03 | 0.15 | |
| UL23:TK | 12 h p.i. cDNA | 17.66 | 0.08 | 0.46 | |
| UL23:TK | HSV-1 genomic DNA | 21.28 | 0.06 | 0.27 | |
| UL44: gC | 4 h p.i. cDNA | 24.37 | 0.07 | 0.29 | |
| UL44: gC | 12 h p.i. cDNA | 18.85 | 0.12 | 0.65 | |
| UL44: gC | HSV-1 genomic DNA | 23.04 | 0.04 | 0.19 | |
| Inter-assay | RL2: ICP0 | 4 h p.i. cDNA | 20.72 | 0.08 | 0.36 |
| RL2: ICP0 | 12 h p.i. cDNA | 18.11 | 0.05 | 0.30 | |
| RL2: ICP0 | HSV-1 genomic DNA | 20.48 | 0.06 | 0.28 | |
| UL23:TK | 4 h p.i. cDNA | 17.67 | 0.14 | 0.77 | |
| UL23:TK | 12 h p.i. cDNA | 17.77 | 0.10 | 0.55 | |
| UL23:TK | HSV-1 genomic DNA | 21.59 | 0.36 | 1.66 | |
| UL44: gC | 4 h p.i. cDNA | 24.49 | 0.15 | 0.63 | |
| UL44: gC | 12 h p.i. cDNA | 18.91 | 0.12 | 0.63 | |
| UL44: gC | HSV-1 genomic DNA | 23.22 | 0.33 | 1.40 | |
3.5. Evaluation of assay performance for kinetic analysis of HSV-transcriptional gene class expression
Each of the HSV-1 transcriptional gene classes follow well described coordinated temporal patterns of expression that are expressed sequentially. Regulation of these patterns of gene expression is paramount in orchestrating efficient HSV genomic replication and virion assembly. The suitability of these developed PCR assays to assess quantitatively HSV-1 gene transcription was evaluated at various times post infection across a 24 h kinetic course. Relative fold change in expression of each specific gene was determined using the 2−ΔΔCq method (Livak and Schmittgen, 2001) as described in the methods section. During the course of infection, representative genes exhibited patterns of gene expression that reflected the prescribed expression patterns of each gene class (Fig. 3A).
Fig. 3.
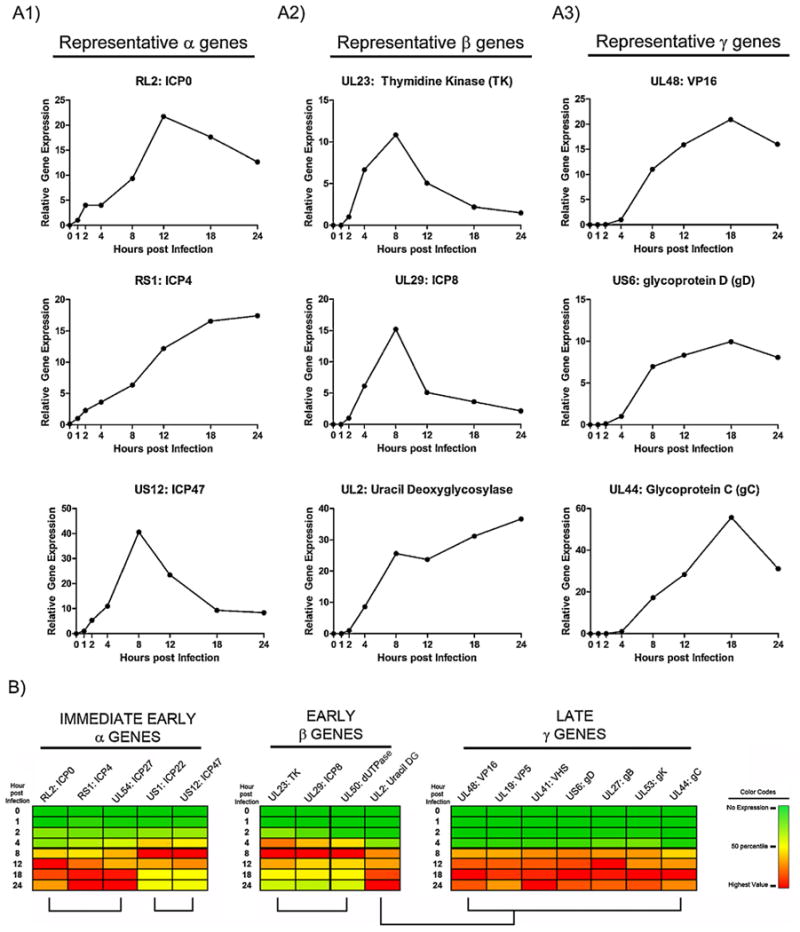
Kinetic analysis of relative HSV gene expression for representative genes from each transcriptional gene class. Relative gene expression was determined for the indicated gene transcript at 0,1,2,4,8,12,18, and 24 h post infection. A1: Kinetic analysis of representative HSV genes that exemplify the three observed expression patterns for the alpha gene transcriptional class. A2: Kinetic analysis of representative HSV genes that exemplify the two observed expression patterns for the beta gene transcriptional class. A3: Kinetic analysis of representative Late/gamma HSV genes. B: Heat map comparison of the relative expression levels within each transcriptional gene class at the assessed time points post infection. Expression levels of a particular gene correlate on the heat map with a three point defined gradient range from green (no expression) to yellow (50% of maximum for each gene) and to red (highest expression level for that gene). (For interpretation of the references to color in this figure legend, the reader is referred to the web version of the article.)
A heat map approach was utilized to assist in visualization and comparative kinetic analysis of gene expression patterns. Segregation and alignment of these heat maps by HSV-1 gene transcriptional class revealed differences in patterns of gene expression that were specific to each class (Fig. 3B). Whereas, most genes in the beta and gamma classes exhibited one pattern of gene expression, genes in the alpha class exhibited two distinct patterns of gene expression. Interestingly, one beta gene, UL2, did not appear similar to the other beta genes, but had a pattern that was reminiscent of the gamma gene class (Fig. 3B).
4. Discussion
Emerging technologies that enable whole transcriptome analysis of viral and cellular gene expression are becoming rapidly more commonplace. Since Dr. Edward Wagner's laboratory developed an oligonucleotide-based DNA microarray approach to study global changes in HSV-1 gene transcript abundance in the late 1990s, many techniques have been developed or utilized for analyzing levels of alpha-herpesvirus gene expression to facilitate recognition of broad effects of various treatments or cellular factors on viral gene expression (Stingley et al., 2000; Wagner et al., 2002; Yang et al., 2002; Cohrs et al., 2003, 2006; Aguilar et al, 2005, 2006; Deitch et al, 2005; Kennedy et al., 2005; Kamakura et al., 2008). However, these techniques can be expensive, generate an immense dataset that requires extensive and complicated analysis, and often still require validation or replication for statistical evaluation by secondary methods, such as qPCR. These factors limit their utility in examining the effects of various treatments at multiple kinetic points, as each new condition or time point increases exponentially the parameters required to be assessed. This study describes the development and evaluation of individual qPCR assays that represent collectively the breadth of the entire HSV-1 transcriptome in a format that would reduce overall cost and simplify assessment of gene expression. Although there are other reports of qPCR primers and conditions that represent individual or subsets of HSV-1 (Chen et al., 1997; Hukkanen et al., 2000; Broberg et al, 2003; Carr and Al-Khatib, 2003; Wang et al, 2005), this work represents a compilation of optimized primer sets and validated reaction conditions that were developed specifically to analyze the entire HSV-1 lytic transcriptome.
Each individual qPCR assay was designed to work in conjunction with other assays and therefore enabled their compilation into a plate arrays that could analyze the majority of HSV-1 genes within a single PCR run. Amplification reactions for HSV-1 target genes were designed to be quantified using SYBR Green-I-based detection, such as to not require expensive probe generation and to permit assay adaptability with additional cellular or viral genes. Quantitative analysis of gene expression via SYBR Green-I detection had several advantages for whole HSV genome level transcriptome assay design and expression analysis: (1) SYBR Green-I could be applied directly to PCR assays without the need to design, synthesize, and optimize fluorescent labeled target-specific probes. (2) SYBR Green-I detection enabled rapid and adaptable assay design, which was critical given the number of genes required to be analyzed. (3) The use of SYBR Green-I is less expensive than fluorogenic detection probes. (4) Once optimized and confirmed to be specific, SYBR Green-I detection utilizes conventional PCR protocols and primer sets that can be arrayed easily in plates for subsequent analysis. Overall, SYBR Green-I-based detection represented the most adaptable, economical approach for large-scale whole transcriptome analysis of HSV-1 gene expression.
The success and adaptability of a qPCR assay for HSV-1 gene expression is highly dependent on several factors. First, it is imperative that the qPCR system has the ability to recognize multiple strains of HSV-1 with a high level of specificity for each target gene. In addition, with multiple gene targets on one plate, optimized performance with a single thermal cycling protocol and reaction condition are necessary for utilizing the system as a qPCR array. Lastly, it is essential for the qPCR system to quantify RNA levels accurately across a wide linear range of template concentrations with minimal intra- and inter-assay variability. Critical to these parameters is the initial design and evaluation of primer sets, which were considered carefully for the assays presented in this study. In turn, the final optimized primer sets were selected to be highly specific for their target gene and recognized multiple HSV-1 strains. The absence of significant intra- or inter-assay variation enables plate-to-plate comparisons between results obtained or to provide statistical significance when examining replicate data sets. In short, these assays can be utilized to measure relative changes in HSV-1 gene expression reproducibly and accurately, either as a primary tool for expression analysis or a confirmatory method following microarray or NGS. One intriguing finding was the ability of melting temperature dissociation curve analysis to detect single nucleotide differences within the amplified products of different strains, especially within the TK gene where mutations can result in drug resistance (Coen and Schaffer, 1980; Furman et al, 1981; Coen et al., 1982; Frobert et al., 2005; Wang et al., 2007).
The applicability of the designed assays was demonstrated by determining the profiles of HSV-1 gene expression kinetics for an array of representative genes from of all HSV-1 transcriptional gene classes. This analysis permitted determination of relative fold changes in each gene across a replicative time course. Since only two reaction conditions were utilized for all designed primer sets, the effects of various conditions can be analyzed on an individual plate the specifies an array of primer sets to most HSV genes, as well as necessary cellular reference genes. Visualization of expression values on a heat map facilitated direct comparison of transcriptional class specific expression profiles. As expected, each transcriptional class exhibited patterns of gene expression that were indicative of their known timing of expression and their roles in HSV-1 replication. Interestingly, the UL2 gene expression pattern did not match other beta genes, but rather exhibited a profile that was reminiscent of the gamma gene class (Fig. 3B). Re-examination of literature related to assignment of transcriptional class categories for the UL2 gene indicated that this gene could fall within either the beta or gamma gene classes (Pellett and Roizman, 2007; Roizman et al., 2007). These data highlight the utility of the developed qPCR array to examine genome-wide expression patterns during experimental HSV-1 infection. Foremost, since these compiled primer sets represent the entire HSV-1 lytic transcriptome, these arrays can facilitate experiments that can complement, corroborate, and validate results obtained from contemporary microarray and NGS technologies.
Supplementary Material
Table 3.
HSV-1 gamma (γ) genes: oligonucleotide primer sequences, PCR annealing temperatures, expected PCR product size, and observed melt temperatures.
| Gene name | Gene ID no. | Primer sequence (5′-3′) | Annealing | Size (bp) | Melt temp. |
|---|---|---|---|---|---|
| US5: Glycoprotein J (gJ) | 2703406 | FOR: 5′-CACCCATCGGGGACCTGC-3′ | 55 | 127 | 88.5 |
| REV: 5′-CAGGACTACGGCGCACAGC-3′ | |||||
| US9: Type 2 Membrane Protein | 2703452 | FOR: 5′-CGATCCGACATGTCCGTGC-3′ | 55 | 107 | 85.5 |
| REV: 5′-ATGCGTACGAGGAAGTCGTTG-3′ | |||||
| UL1: Glycoprotein L (gL) | 2703393 | FOR: 5′-CAACCGAATATGTTATTCGGAGTCGG-3′ | 55 | 104 | 82.5 |
| REV: 5′-CTCGTAACGCCAATCAAGATCGTC-3′ | |||||
| UL6: Capsid Vertex | 2703429 | FOR: 5′-GCGTGGCGGACTACGACCG-3′ | 55 | 169 | 89 |
| REV: 5′-TCGGGAAACAGCCGCTGGA-3′ | |||||
| UL11: Envelope-Associated | 2703380 | FOR: 5′-GGCACGTAGAAATTACCTTCCT-3′ | 55 | 113 | 85 |
| REV: 5′-TGCTGCCGAAACAACGT-3′ | |||||
| UL13: Ser/Thr Kinase | 2703383 | FOR: 5′-ACGTCATACGCCAGGCCGT-3′ | 55 | 110 | 88 |
| REV: 5′-CAGCTGTCGCCGGACTTCG-3′ | |||||
| UL15: DNA Packaging Terminase | 2703385 | FOR: 5′-GCCGTCGCCATCGCCAC-3′ | 55 | 129 | 89.5 |
| REV: 5′-GTACAGCACCGCGCTCCC-3′ | |||||
| UL17: DNA Packaging | 2703388 | FOR: 5′-CCGCTGACGGCCTGGTGAA-3′ | 55 | 131 | 91.5 |
| REV: 5′-CTCGCGTTGGTTCAGCGGG-3′ | |||||
| UL19: VP5 Major Capsid Protein | 2703368 | FOR: 5′-TGGATGGTATGGTCCAGATGC-3′ | 55 | 139 | 90 |
| REV: 5′-GCACAACGGCGCTGCTCT-3′ | |||||
| UL21: Virion Morphogenesis Protein | 2703372 | FOR: 5′-CTGGTCGTTCGAGGGACAG-3′ | 55 | 112 | 87 |
| REV: 5′-ACACCTCGTCCTCCCCAATG-3′ | |||||
| UL22: Glycoprotein H (gH) | 2703373 | FOR: 5′-CTGCCGGAGGACAGCCGA-3′ | 55 | 108 | 87 |
| REV: 5′-GCAGCCCATCTCATCGACG-3′ | |||||
| UL26: Serine Protease Scaffold Protein | 2703453 | FOR: 5′-GGACTCGGGCGAGTTGGCA-3′ | 55 | 172 | 90 |
| REV: 5′-CTGCACGCAGGCGATCAG-3′ | |||||
| UL26.5: Scaffold Protein | 2703454 | FOR: 5′-CTCCCATTACAACCAGCTCGT-3′ | 55 | 112 | 90.5 |
| REV: 5′-CGCACCGTGAGGCCCATAG-3′ | |||||
| UL28: DNA Packaging Terminase Subunit 2 | 2703457 | FOR: 5′-GATGAGGTGGCAGTAGTTTAGC-3′ | 55 | 124 | 83.5 |
| REV: 5′-CCGACCCTGTCCGTATCA-3′ | |||||
| UL31: Nuclear Egress Protein | 2703350 | FOR: 5′-CTCTGCGTTGCGCCGGAC-3′ | 55 | 141 | 88.5 |
| REV: 5′-CTGTACGTCATCTTTCCCGGC-3′ | |||||
| UL43: Type 3 Membrane Protein | 2703408 | FOR: 5′-CGCGGATATACGCCTGGCT-3′ | 55 | 140 | 91.5 |
| REV: 5′-CGCATAGGCGGCGCCCAG-3′ | |||||
| UL48: VP16 Major Transactivator IE Genes | 2703416 | FOR: 5′-CATATCCAGAGCGCCGTAG-3′ | 55 | 138 | 88 |
| REV: 5′-CACTTAGACGGCGAGGAC-3′ | |||||
| UL49: VP22 Major Tegument Protein | 2703417 | FOR: 5′-GCGACGCCGCAGAACGC-3′ | 55 | 144 | 88.5 |
| REV: 5′-ACGAACTCCTTGGCATCACC-3′ |
Acknowledgments
This work is in memory of Dr. James M. Hill, a cherished colleague, friend, and mentor. Without his contributions and continuous support this research would not have been possible. This work was supported by a Louisiana Board of Regents Research Competitiveness Award LEQSF-RD-A-13, by a Research Commercialization grant from the Louisiana Board of Regents through the Louisiana Vaccine Center, and by the National Institutes of Health from the National Center for Research Resources (P20RR021970) and the National Institute of General Medical Sciences (P20GM103501). In addition, this work was supported in part by R01AI112402 from the National Institute of Allergy and Infectious Diseases and U54GM104940 from the National Institute of General Medical Sciences through the Louisiana Clinical and Translational Science Center. The content is solely the responsibility of the authors and does not represent necessarily the official views of the National Center for Research Resources, the National Institute of General Medical Sciences, the National Institute of Allergy and Infectious Diseases or the National Institutes of Health.
References
- Aguilar JS, Devi-Rao GV, Rice MK, Sunabe J, Ghazal P, Wagner EK. Quantitative comparison of the HSV-1 and HSV-2 transcriptomes using DNA microarray analysis. Virology. 2006;348:233–241. doi: 10.1016/j.virol.2005.12.036. [DOI] [PubMed] [Google Scholar]
- Aguilar JS, Ghazal P, Wagner EK. Design of a herpes simplex virus type 2 long oligonucleotide-based microarray: global analysis of HSV-2 transcript abundance during productive infection. Methods Mol Biol. 2005;292:423–448. doi: 10.1385/1-59259-848-x:423. [DOI] [PubMed] [Google Scholar]
- Amer HM, Almajhdi FN. Development of a SYBR Green I based real-time RT-PCR assay for detection and quantification of bovine coronavirus. Mol Cell Probes. 2011;25:101–107. doi: 10.1016/j.mcp.2011.03.001. [DOI] [PMC free article] [PubMed] [Google Scholar]
- Broberg EK, Nygardas M, Salmi AA, Hukkanen V. Low copy number detection of herpes simplex virus type 1 mRNA and mouse Th1 type cytokine mRNAs by Light Cycler quantitative real-time. PCR J Virol Methods. 2003;112:53–65. doi: 10.1016/s0166-0934(03)00191-5. [DOI] [PubMed] [Google Scholar]
- Bustin SA. Why the need for qPCR publication guidelines? – the case for MIQE. Methods. 2010;50:217–226. doi: 10.1016/j.ymeth.2009.12.006. [DOI] [PubMed] [Google Scholar]
- Bustin SA, Benes V, Garson JA, Hellemans J, Huggett J, Kubista M, Mueller R, Nolan T, Pfaffl MW, Shipley GL, Vandesompele J, Wittwer CT. The MIQE guidelines: minimum information for publication of quantitative realtime PCR experiments. Clin Chem. 2009;55:611–622. doi: 10.1373/clinchem.2008.112797. [DOI] [PubMed] [Google Scholar]
- Carr DJ, Al-Khatib K. Biorad Bulletin. Biorad Laboratories Inc.; USA: 2003. Relative quantitation of mRNA: real-time PCR vs end-point PCR; pp. 1–4. [Google Scholar]
- Chen SH, Kramer MF, Schaffer PA, Coen DM. A viral function represses accumulation of transcripts from productive-cycle genes in mouse ganglia latently infected with herpes simplex virus. J Virol. 1997;71:5878–5884. doi: 10.1128/jvi.71.8.5878-5884.1997. [DOI] [PMC free article] [PubMed] [Google Scholar]
- Chey S, Claus C, Liebert UG. Validation and application of normalization factors for gene expression studies in rubella virus-infected cell lines with quantitative real-time PCR. J Cell Biochem. 2010;110:118–128. doi: 10.1002/jcb.22518. [DOI] [PMC free article] [PubMed] [Google Scholar]
- Coen DM, Schaffer PA. Two distinct loci confer resistance to acycloguanosine in herpes simplex virus type 1. Proc Natl Acad Sci U S A. 1980;77:2265–2269. doi: 10.1073/pnas.77.4.2265. [DOI] [PMC free article] [PubMed] [Google Scholar]
- Coen DM, Schaffer PA, Furman PA, Keller PM, Clair MH., St Biochemical and genetic analysis of acyclovir-resistant mutants of herpes simplex virus type 1. Am J Med. 1982;73:351–360. doi: 10.1016/0002-9343(82)90122-x. [DOI] [PubMed] [Google Scholar]
- Cohrs RJ, Gilden DH, Gomi Y, Yamanishi K, Cohen JI. Comparison of virus transcription during lytic infection of the Oka parental and vaccine strains of Varicella-Zoster virus. J Virol. 2006;80:2076–2082. doi: 10.1128/JVI.80.5.2076-2082.2006. [DOI] [PMC free article] [PubMed] [Google Scholar]
- Cohrs RJ, Hurley MP, Gilden DH. Array analysis of viral gene transcription during lytic infection of cells in tissue culture with Varicella-Zoster virus. J Virol. 2003;77:11718–11732. doi: 10.1128/JVI.77.21.11718-11732.2003. [DOI] [PMC free article] [PubMed] [Google Scholar]
- Deitch SB, Gilden DH, Wellish M, Smith J, Cohrs RJ, Mahalingam R. Array analysis of simian varicella virus gene transcription in productively infected cells in tissue culture. J Virol. 2005;79:5315–5325. doi: 10.1128/JVI.79.9.5315-5325.2005. [DOI] [PMC free article] [PubMed] [Google Scholar]
- Foster TP, Chouljenko VN, Kousoulas KG. Functional characterization of the HveA homolog specified by African green monkey kidney cells with a herpes simplex virus expressing the green fluorescence protein. Virology. 1999;258:365–374. doi: 10.1006/viro.1999.9743. [DOI] [PubMed] [Google Scholar]
- Foster TP, Rybachuk GV, Kousoulas KG. Expression of the enhanced green fluorescent protein by herpes simplex virus type 1 (HSV-1) as an in vitro or in vivo marker for virus entry and replication. J Virol Methods. 1998;75:151–160. doi: 10.1016/s0166-0934(98)00107-4. [DOI] [PubMed] [Google Scholar]
- Frobert E, Ooka T, Cortay JC, Lina B, Thouvenot D, Morfin F. Herpes simplex virus thymidine kinase mutations associated with resistance to acyclovir: a site-directed mutagenesis study. Antimicrob Agents Chemother. 2005;49:1055–1059. doi: 10.1128/AAC.49.3.1055-1059.2005. [DOI] [PMC free article] [PubMed] [Google Scholar]
- Furman PA, Coen DM, Clair MH, St, Schaffer PA. Acyclovir-resistant mutants of herpes simplex virus type 1 express altered DNA polymerase or reduced acyclovir phosphorylating activities. J Virol. 1981;40:936–941. doi: 10.1128/jvi.40.3.936-941.1981. [DOI] [PMC free article] [PubMed] [Google Scholar]
- Hall LM, Draper KG, Frink RJ, Costa RH, Wagner EK. Herpes simplex virus mRNA species mapping in EcoRI fragment I. J Virol. 1982;43:594–607. doi: 10.1128/jvi.43.2.594-607.1982. [DOI] [PMC free article] [PubMed] [Google Scholar]
- Hendricks RL, Tao MS, Glorioso JC. Alterations in the antigenic structure of two major HSV-1 glycoproteins, gC and gB, influence immune regulation and susceptibility to murine herpes keratitis. J Immunol. 1989;142:263–269. [PubMed] [Google Scholar]
- Hendricks RL, Tumpey TM. Contribution of virus and immune factors to herpes simplex virus type I-induced corneal pathology. Invest Ophthalmol Vis Sci. 1990;31:1929–1939. [PubMed] [Google Scholar]
- Holland LE, Anderson KP, Shipman C, Jr, Wagner EK. Viral DNA synthesis is required for the efficient expression of specific herpes simplex virus type 1 mRNA species. Virology. 1980;101:10–24. doi: 10.1016/0042-6822(80)90479-1. [DOI] [PubMed] [Google Scholar]
- Honess RW, Roizman B. Regulation of herpesvirus macromolecular synthesis. I. Cascade regulation of the synthesis of three groups ofviral proteins. J Virol. 1974;14:8–19. doi: 10.1128/jvi.14.1.8-19.1974. [DOI] [PMC free article] [PubMed] [Google Scholar]
- Honess RW, Roizman B. Regulation of herpesvirus macromolecular synthesis: sequential transition of polypeptide synthesis requires functional viral polypeptides. Proc Natl Acad Sci U S A. 1975;72:1276–1280. doi: 10.1073/pnas.72.4.1276. [DOI] [PMC free article] [PubMed] [Google Scholar]
- Huggett JF, Foy CA, Benes V, Emslie K, Garson JA, Haynes R, Hellemans J, Kubista M, Mueller RD, Nolan T, Pfaffl MW, Shipley GL, Vandesompele J, Wittwer CT, Bustin SA. The digital MIQE guidelines: minimum information for publication of quantitative digital PCR experiments. Clin Chem. 2013;59:892–902. doi: 10.1373/clinchem.2013.206375. [DOI] [PubMed] [Google Scholar]
- Hukkanen V, Rehn T, Kajander R, Sjoroos M, Waris M. Time-resolved fluorometry PCR assay for rapid detection of herpes simplex virus in cerebrospinal fluid. J Clin Microbiol. 2000;38:3214–3218. doi: 10.1128/jcm.38.9.3214-3218.2000. [DOI] [PMC free article] [PubMed] [Google Scholar]
- Jones PC, Roizman B. Regulation of herpesvirus macromolecular synthesis. VIII. The transcription program consists of three phases during which both extent of transcription and accumulation of RNA in the cytoplasm are regulated. J Virol. 1979;31:299–314. doi: 10.1128/jvi.31.2.299-314.1979. [DOI] [PMC free article] [PubMed] [Google Scholar]
- Kadeppagari RK, Sanchez RL, Foster TP. HSV-2 inhibits type-I interferon signaling via multiple complementary and compensatory STAT2-associated mechanisms. Virus Res. 2012;167:273–284. doi: 10.1016/j.virusres.2012.05.010. [DOI] [PMC free article] [PubMed] [Google Scholar]
- Kamakura M, Nawa A, Ushijima Y, Goshima F, Kawaguchi Y, Kikkawa F, Nishiyama Y. Microarray analysis of transcriptional responses to infection by herpes simplex virus types 1 and 2 and their US3-deficient mutants. Microbes Infect. 2008;10:405–413. doi: 10.1016/j.micinf.2007.12.019. [DOI] [PubMed] [Google Scholar]
- Kennedy PG, Grinfeld E, Craigon M, Vierlinger K, Roy D, Forster T, Ghazal P. Transcriptomal analysis of varicella-zoster virus infection using long oligonucleotide-based microarrays. J Gen Virol. 2005;86:2673–2684. doi: 10.1099/vir.0.80946-0. [DOI] [PubMed] [Google Scholar]
- Kibbe WA. OligoCalc: an online oligonucleotide properties calculator. Nucleic Acids Res. 2007;35:W43–W46. doi: 10.1093/nar/gkm234. [DOI] [PMC free article] [PubMed] [Google Scholar]
- Livak KJ, Schmittgen TD. Analysis of relative gene expression data using real-time quantitative PCR and the 2(-delta delta C(T)) method. Methods. 2001;25:402–408. doi: 10.1006/meth.2001.1262. [DOI] [PubMed] [Google Scholar]
- Mbong EF, Woodley L, Dunkerley E, Schrimpf JE, Morrison LA, Duffy C. Deletion of the herpes simplex virus 1 UL49 gene results in mRNA and protein translation defects that are complemented by secondary mutations in UL41. J Virol. 2012;86:12351–12361. doi: 10.1128/JVI.01975-12. [DOI] [PMC free article] [PubMed] [Google Scholar]
- McGeoch DJ, Dalrymple MA, Davison AJ, Dolan A, Frame MC, McNab D, Perry LJ, Scott JE, Taylor P. The complete DNA sequence of the long unique region in the genome of herpes simplex virus type 1. J Gen Virol. 1988a;69:1531–1574. doi: 10.1099/0022-1317-69-7-1531. [DOI] [PubMed] [Google Scholar]
- McGeoch DJ, Dalrymple MA, Dolan A, McNab D, Perry LJ, Taylor P, Challberg MD. Structures of herpes simplex virus type 1 genes required for replication of virus DNA. J Virol. 1988b;62:444–453. doi: 10.1128/jvi.62.2.444-453.1988. [DOI] [PMC free article] [PubMed] [Google Scholar]
- McGowin CL, Whitlock GC, Pyles RB. High-throughput multistrain polymerase chain reaction quantification of Chlamydia trachomatis from clinical and preclinical urogenital specimens. Diagn Microbiol Infect Dis. 2009;64:117–123. doi: 10.1016/j.diagmicrobio.2009.01.032. [DOI] [PMC free article] [PubMed] [Google Scholar]
- Pellett PE, Roizman B. The family herpesviridae: a brief introduction. In: Knipe DM, Howley PM, editors. Fields Virology. Vol. 2. Lippincott Williams and Wilkins; Philadelphia, PA: 2007. pp. 2479–2499. 2 vols. [Google Scholar]
- Roizman B, Knipe DM, Whitley RJ. Herpes simplex viruses. In: Knipe DM, Howley PM, editors. Fields Virology. Vol. 2. Lippincott Williams and Wilkins; Philadelphia, PA: 2007. pp. 2501–2601. 2 vols. [Google Scholar]
- Roizman B, Kozak M, Honess RW, Hayward G. Regulation of herpesvirus macromolecular synthesis: evidence for multilevel regulation of herpes simplex 1 RNA and protein synthesis. Cold Spring Harb Symp Quant Biol. 1975;39(Pt 2):687–701. doi: 10.1101/sqb.1974.039.01.083. [DOI] [PubMed] [Google Scholar]
- Sanchez RL, Ramsay AJ, Foster TP. Efficient generation and rapid isolation via stoplight recombination of Herpes simplex viruses expressing model antigenic and immunological epitopes. J Virol Methods. 2012;179:116–126. doi: 10.1016/j.jviromet.2011.10.009. [DOI] [PMC free article] [PubMed] [Google Scholar]
- Santhosh SR, Parida MM, Dash PK, Pateriya A, Pattnaik B, Pradhan HK, Tripathi NK, Ambuj S, Gupta N, Saxena P, Lakshmana Rao PV. Development and evaluation of SYBR Green I-based one-step real-time RT-PCR assay for detection and quantitation of Japanese encephalitis virus. J Virol Methods. 2007;143:73–80. doi: 10.1016/j.jviromet.2007.02.011. [DOI] [PubMed] [Google Scholar]
- Stingley SW, Ramirez JJ, Aguilar SA, Simmen K, Sandri-Goldin RM, Ghazal P, Wagner EK. Global analysis of herpes simplex virus type 1 transcription using an oligonucleotide-based DNA microarray. J Virol. 2000;74:9916–9927. doi: 10.1128/jvi.74.21.9916-9927.2000. [DOI] [PMC free article] [PubMed] [Google Scholar]
- Wagner EK, Ramirez JJ, Stingley SW, Aguilar SA, Buehler L, Devi-Rao GB, Ghazal P. Practical approaches to long oligonucleotide-based DNA microarray: lessons from herpesviruses. Prog Nucleic Acid Res Mol Biol. 2002;71:445–491. doi: 10.1016/s0079-6603(02)71048-9. [DOI] [PubMed] [Google Scholar]
- Wang K, Mahalingam G, Hoover SE, Mont EK, Holland SM, Cohen JI, Straus SE. Diverse herpes simplex virus type 1 thymidine kinase mutants in individual human neurons and Ganglia. J Virol. 2007;81:6817–6826. doi: 10.1128/JVI.00166-07. [DOI] [PMC free article] [PubMed] [Google Scholar]
- Wang QY, Zhou C, Johnson KE, Colgrove RC, Coen DM, Knipe DM. Herpesviral latency-associated transcript gene promotes assembly of heterochromatin on viral lytic-gene promoters in latent infection. Proc Natl Acad Sci U S A. 2005;102:16055–16059. doi: 10.1073/pnas.0505850102. [DOI] [PMC free article] [PubMed] [Google Scholar]
- Yang WC, Devi-Rao GV, Ghazal P, Wagner EK, Triezenberg SJ. General and specific alterations in programming of global viral gene expression during infection by VP16 activation-deficient mutants of herpes simplex virus type 1. J Virol. 2002;76:12758–12774. doi: 10.1128/JVI.76.24.12758-12774.2002. [DOI] [PMC free article] [PubMed] [Google Scholar]
Associated Data
This section collects any data citations, data availability statements, or supplementary materials included in this article.