Abstract
Drosophila melanogaster strain Oregon-R* was grown on standard medium supplemented with [U-13C6]glucose. One to two days after hatching, flies were extracted with water. Glucose was isolated chromatographically from the extract and was analyzed by 13C NMR spectroscopy. All 13C signals of the isolated glucose were multiplets arising by 13C13C coupling. Based on a comprehensive analysis of the coupling constants and heavy isotope shifts in glucose, the integrals of individual 13C signal patterns afforded the concentrations of certain groups of 13C isotopologs. These data were deconvoluted by a genetic algorithm affording the abundances of all single-labeled and of 15 multiply labeled isotopologs. Among the latter group, seven isotopologs were found at concentrations >0.1 mol % with [1,2-13C2]glucose as the most prominent species. The multiply 13C-labeled glucose isotopologs are caused by metabolic remodeling of the proffered glucose via a complex network of catabolic and anabolic processes involving glycolysis and/or passage through the pentose phosphate, the Cori cycle and/or the citrate cycle. The perturbation method described can be adapted to a wide variety of experimental systems and isotope-labeled precursors.
Keywords: stable isotope, nuclear magnetic resonance, genetic algorithm, insect, X group
Organic matter is a complex mixture of isotopologs (for the International Union of Pure and Applied Chemistry definition of isotopolog, see ref. 1) containing all naturally occurring isotopes of hydrogen, carbon, nitrogen, and oxygen. Even if the discussion is limited to the stable carbon isotopes (12C and 13C), in a simple six-carbon compound such as glucose, we are already faced with 64 different isotopologs. Naturally occurring glucose consists predominantly of the [U-12C6]-isotopolog accounting for ≈93 mol %. Each of six molecular species carrying a single 13C atom accounts for 1.1%. In natural abundance glucose, multiply 13C-labeled species are rare; for example, the [U-13C6]-isotopolog is expected to be present at a level of ≈10-10 mol %.
The distribution of isotopologs in organic matter is almost, but not entirely, stochastic. Geochemical and biochemical processes are conducive to isotope fractionation, which can be exploited for a wide variety of analytical approaches, e.g., to determine the biological and/or geographic origin of organic material (for recent reviews, see refs. 2-5). For example, the distribution of stable carbon isotopes in “natural abundance” chitin and lipids was shown to be modulated by dietary conditions in experiments with the American cockroach (Periplaneta americana) (6). However, the natural isotope fractionation effects are small and below the sensitivity level of the methods used here.
The utilization of stable isotopes for metabolic flux studies was initiated shortly after the discovery of deuterium (7-10). However, the feasibility and scope of the technology has been dramatically enhanced by technical progress in NMR and mass spectrometry. Nowadays, stable isotope labeling experiments are widely used for pathway delineation, and methods have been developed to analyze fluxes in metabolic networks on a quantitative basis (refs. 11-15, for reviews see refs. 16 and 17).
The quasiequilibrium of isotopologs in a biological system can be perturbed by the introduction of a feed supplement carrying single or multiple isotope substitutions. Such a perturbation will spread through the entire metabolic network of an organism via hundreds to thousands of enzyme-catalyzed reactions operating simultaneously. The spreading of the perturbation is best described as a relaxation process which can be used to study dynamic processes in complex metabolic networks with considerable accuracy (18).
In this paper, we have studied the fate of nutritional glucose in Drosophila melanogaster. The insect is one of the most extensively characterized animal species, and many of its genes have orthologs or paralogs involved in human disease (19-22). By comparison with the depth of genetic and developmental analysis of Drosophila, the metabolic dynamics of the insect is incompletely understood (23). In this paper, reactions involved in carbohydrate metabolism of Drosophila are reconstructed from the abundances of 21 different 13C-isotopologs of glucose from insects cultivated in the presence of [U-13C6]glucose.
Experimental Procedures
Materials. [U-13C6]-, [1,2,3-13C3]-, [1,2-13C2]-, [2,3-13C2]-, [3,4-13C2]-, [5,6-13C2]-, [1-13C]-, [2-13C]-, [3-13C]-, [4-13C]-, [5-13C]-, and [6-13C]Glucose were purchased from Omicron (South Bend, IN). D. melanogaster Oregon-R* strain was obtained from the Max Planck Institute for Developmental Biology (Department of Genetics, Tübingen, Germany).
Drosophila Culture. The culture medium (modified from ref. 24) contained, per liter, 80 g of corn flour, 10 g of soy bean flour, 8 g of dry yeast powder, 4 g of agar, 11 g of beet syrup, 40 g of malt extract, 5.6 g of [U-13C6]glucose, 6.3 ml of propionic acid, and 750 mg of methyl para-hydroxybenzoate. The medium was autoclaved. Glucose, propionic acid, and methyl para-hydroxybenzoate were added as filter-sterilized solutions.
Flies were harvested 1-2 days after hatching and were cooled to -20°C. The frozen flies (18.4 g) were ground with liquid nitrogen. The cell mass was allowed to warm up to room temperature and suspended in 300 ml of water. The suspension was stirred at 37°C for 1 h. The suspension was centrifuged at 6,000 rpm in a GS3 rotor (Kendro Laboratory Products, Langenselbold, Germany). The pellet was again suspended in 300 ml of water, stirred at 37°C for 1 h, and centrifuged. The extracts were combined and lyophilized.
Purification of Glucose. Glucose was isolated from the extract described above by chromatography on a Rezex RPM-Monosaccharide lead-column (300 × 7.8 mm) from Phenomenex (Torrance, CA) that was developed with water at a flow rate of 0.4 ml/min and a temperature of 75°C. The effluent was monitored on a differential refractometer from Gamma Analysen Technik (Bremerhaven, Germany). The retention volume of glucose was 8.2 ml. Fractions were combined and lyophilized (yield, 10 mg).
NMR Spectroscopy. Glucose was dissolved in D2O. [1H]- and 13C NMR spectra were recorded at 500.13 MHz and 125.76 MHz, respectively, using a Bruker DRX500 spectrometer, at 27°C. Water suppression was achieved by presaturation of the residual water signal at the lowest possible power level. For 1H decoupling, a composite pulse sequence (WALTZ) was used in the 13C NMR experiments. The data were processed with standard Bruker software (XWINNMR 3.0). Before Fourier transformation, the free induction decay (FID) was zero-filled to 256,000 and multiplied with a Gaussian function. Before integration, the baseline of the spectra was corrected.
The signal assignments of α and β glucose were taken from ref. 18. Coupling constants and isotope shifts were determined from 13C NMR spectra of commercially available 13C-labeled glucoses (Table 1). The analysis of 13C enrichment and isotopolog composition was performed as described (18, 25). Briefly, absolute 13C abundances for C-1 were obtained from 13C coupling satellites of H-1α (5.26 ppm) in the 1H NMR spectrum. This value was taken as a reference for the 13C abundances of the other carbon atoms.
Table 1. NMR data of glucose.
| Position | Chemical shift, ppm* | 13C−13C coupling, Hz† | 13C Isotope shift, ppb‡ |
|---|---|---|---|
| 1α | 93.28 | 46.3 (2α), 3.0 (6α), 2.0 (5α) | 8 (2α) |
| 2α | 72.79 | 45.6 (1α), 38.2 (3α), 2.7 (4α) | 11 (1α), 29 (3α), 40 (1α, 3α) |
| 3α | 74.05 | 38.2 (2α), 38.7 (4α), 3.5 (6α), 1.4 (5α) | −7 (2α), −3 (2α, 4α) |
| 4α | 70.90 | 40.9 (5α), 39.2 (3α), 3.0 (2α) | 22 (5α), 42 (3α, 5α) |
| 5α | 72.55 | 43.4 (6α), 40.3 (4α), 2.0 (1α), 1.7 (3α) | 6 (6α) |
| 6α | 61.85 | 43.4 (5α), 3.5 (1α), 3.6 (3α) | 11 (6α) |
| 1β | 97.20 | 46.1 (2β), 4.2 (3β), 4.1 (6β) | 8 (2β) |
| 2β | 75.41 | 45.8 (1β), 38.9 (3β), 2.3 (4β) | 12 (1β), 22 (3β), 34 (1β, 3β) |
| 3β | 77.10 | 39.4 (4β), 38.9 (2β), 2.3 (5β), 4.0 (6β), 4.2 (1β) | −8 (2β) |
| 4β | 70.83 | 40.5 (5β), 38.7 (3β), 3.5 (2β) | 13 (5β), 30 (3β, 5β) |
| 5β | 77.19 | 43.2 (6β), 40.8 (4β), 2.3 (3β) | 6 (6β), 5 (4β) |
| 6β | 61.97 | 43.2 (5β), 4.1 (1β), 4.2 (3β) | 12 (5β) |
Referenced to external trimethylsilylpropane sulfonate, sodium salt.
Determined from 13C NMR spectra of commercially available 13C-labeled glucose specimens. Coupling partners of the respective index atom are indicated in parentheses.
Determined from 13C NMR spectra of mixtures of commercially available 13C-labeled glucoses and glucose with natural 13C abundance. Upfield shifrs are given with positive signs. Atoms causing isotope shifts to the signal of the respective index atom are indicated in parentheses.
In the 1H-decoupled 13C NMR spectrum each signal was integrated separately. The relative fractions of each respective satellite pair (corresponding to a certain coupling pattern, see Tables 3 and 4, which are published as supporting information on the PNAS web site) in the total signal integral of a given carbon atom were calculated. These values were then referenced to the global absolute 13C abundance for each carbon atom (mol % in Table 2).
Table 2. X group analysis of glucose after metabolic processing through D. melanogaster.
| Molar abundance, mol %
|
||||
|---|---|---|---|---|
| X group | Sign* | α-glucose | β-glucose | Average |
| 10XXXX | A | 1.54 | 1.50 | 1.52 |
| 11XXXX | B | 0.66 | 0.70 | 0.68 |
| 110XX0 | a | 0.32 | ||
| 111XX1 | b | 0.24 | ||
| 11XX11 | c | 0.15 | ||
| 11XX00 | d | 0.52 | ||
| 111XX0, 110XX1 | e | 0.15 | ||
| 010XXX | C | 1.31 | 1.34 | 1.33 |
| 110XXX | D | 0.42 | 0.32 | 0.37 |
| 011XXX | E | 0.11 | 0.11 | 0.11 |
| 111XXX | F | 0.36 | 0.43 | 0.39 |
| X010XX | G | 1.58 | 1.51 | 1.55 |
| X110XX, X011XX | H | 0.32 | 0.46 | 0.39 |
| X111XX | I | 0.30 | 0.23 | 0.27 |
| XX010X | J | 1.51 | 1.53 | 1.52 |
| XX110X, XX011X | K | 0.43 | 0.47 | 0.45 |
| XX111X | L | 0.26 | 0.19 | 0.23 |
| XXX010 | M | 1.46 | 1.52 | 1.49 |
| XXX110, XXX011 | N | 0.27 | 0.26 | 0.26 |
| XXX111 | P | 0.47 | 0.42 | 0.45 |
| XXXX01 | Q | 1.61 | 1.64 | 1.63 |
| XXXX11 | R | 0.59 | 0.56 | 0.58 |
| 1X1X11 | x | 0.24 | 0.26 | 0.25 |
| 0X0X11 | y | 0.35 | 0.30 | 0.33 |
Data Evaluation. Signal deconvolution used a genetic algorithm (26, 27) implemented by the GeneHunter library (WardSystems, Frederick, MD). The problem was modeled creating a binary occupation matrix D which assigns the isotopologs to the X groups (see Results for the definition of X group). Vector T contains the unknown abundances relating to each isotopolog. A state evaluation matrix is thus defined by Hij = Dij·Ti. By calculating F = Σj|Xj - ΣiHij|, the fitness of the population can be estimated. The evolutional goal is expressed by lim F → 0. For a more detailed description of the deconvolution procedure, see Fig. 7, which is published as supporting information on the PNAS web site.
For the evolution process, an elitist strategy was applied to T. The evolution was processed with the following parameters: population size, 50; crossover rate, 90%; mutation rate for raw search, 1%; mutation rate for refinement, 2%; generation gap, 90%; value range for raw search, 8 bit; value range for refinement, 16 bit. The stability of a minimum was tested by using five random starting points.
Results
Eggs of the Oregon-R* D. melanogaster strain were hatched on culture medium supplemented with 30 mM [U-13C6]glucose (99% 13C abundance). The insects developed normally. One to two days after hatching, they were frozen and pulverized under liquid nitrogen. The powder was warmed to room temperature and extracted with water. A 13C NMR spectrum of the crude extract showed only a relatively small number of signals with significant intensity. Most of these could be assigned to glucose. The spectrum shows separate signal sets for the α and β anomers present at a ratio of 0.7:1. Trehalose, normally present in significant amounts in the hemolymph of insects, was not detected. It remains open to what extent glucose isolated from the aqueous extracts of D. melanogaster was formed by enzymatic or spontaneous degradation of trehalose or glycogen during the extraction procedure.
Glucose was isolated from the crude extract by HPLC. The 1H NMR spectrum documents the purity of the isolated compound (>95%). The signals for H-1α (δ = 5.26 ppm) and H-1β (δ = 4.51 ppm) are well separated from the other overlapping signals (δ = 3.96-3.23 ppm). Both H-1α and H-1β show satellite pairs caused by 1H13C couplings (1JCH = 170 Hz). The absolute 13C abundance of C-1α and C-1β calculated via the intensities of these 13C-coupled satellites is 2.2% (corresponding to a 13C excess of 1.1%). This value was used as the reference for the other carbon atoms in glucose.
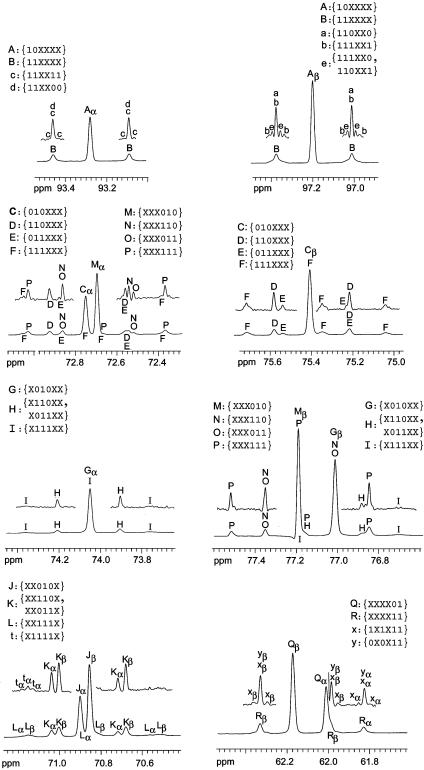
The 13C NMR spectrum shows 12 complex signal sets for the α and β anomers present at a ratio of 0.7:1. All signals appear as complex multiplets due to 13C13C couplings (Fig. 1 and Table 1), reflecting that the glucose reisolated from the flies is a complex mixture of isotopologs. As a consequence of heavy isotope shift effects (Table 1) and of non-first order coupling, the satellite patterns of the multiplets are not strictly symmetrical with respect to the central lines attributed to the respective [13C1] isotopologs.
Fig. 1.
13C NMR signals of glucose isolated from D. melanogaster cultivated on a medium containing [U-13C6]glucose. The upper traces show segments of the spectrum calculated with a “strong” Gaussian function (lb, -2; gb, 0.4 in Bruker terminology). The signals are assigned to corresponding X groups (see Table 2).
To facilitate the following discussion, we propose to designate each isotopolog of glucose by a binary code where the first of six digits indicates C-1 of glucose, the second digit indicates C-2, etc. 12C in any given position is indicated by 0, and 13C is indicated by 1. Hence, [U-13C6]glucose is designated {111111}, [1-13C1]glucose is designated {100000}, [2-13C1]glucose is designated {010000}, etc. X signifies either 13C or 12C (i.e., a wild card denominator). For example, the group of isotopologs where carbon atom 1, 2, and 3 are 13C, whereas the isotope status of carbon atoms 4, 5, and 6 is undetermined, is designated {111XXX} (subsequently designated as an X group).
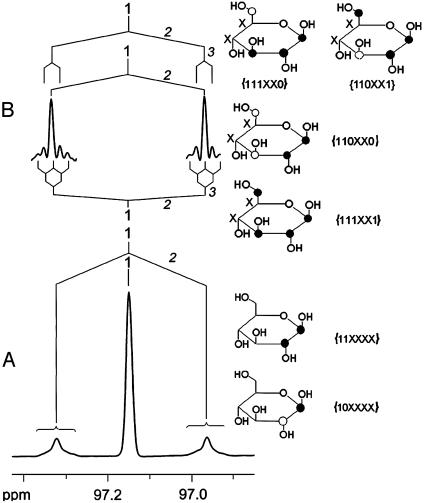
The correlation between the labeling patterns and the NMR signature is illustrated by the multiplet shown in Fig. 2A. The central line of that signal group represents the sum of all isotopologs carrying 13C in position 1 (i.e., the observed carbon atom) and 12C in position 2. Accordingly, the satellite pair in Fig. 2A represents the sum of the molar contributions of all isotopologs with 13C in position 1 and 2. The long-range couplings reflected by the line broadening in the satellite pairs can be resolved by appropriate data processing (i.e., by applying a “strong” Gaussian function to the FID before Fourier transformation) (Fig. 2B). Based on the coupling constants and isotope shifts summarized in Table 1, these satellites are assigned to four different X groups, i.e., {111XX0, 110XX1}, {110XX0}, and {111XX1}.
Fig. 2.
13C NMR signal of C-1β of glucose isolated from D. melanogaster cultivated on a medium containing [U-13C6]glucose. On the basis of 13C13C coupling constants summarized in Table 1, coupling patterns are indicated with the coupled atoms in italic letters. Next to the detected coupling patterns, the corresponding isotopomers are shown. Filled circles indicate 13C,and open circles indicate 12C. Undetermined positions (12Cor 13C) are indicated by X. Next to the structures, the corresponding X groups are given with 1 = 13C, 0 = 12C, and X = 13Cor 12C. (A) Spectrum calculated with a “mild” Gaussian function (lb, -1; gb, 0.1 in Bruker terminology). (B) Spectrum calculated with a “strong” Gaussian function (lb, -2; gb, 0.4; only satellite signals are shown).
The integral over all resonance lines corresponding to a certain X group is proportional to the sum of the molar contributions (in mol %) of all elements of this X group. Based on the data in Tables 3 and 4, each experimentally observed 13C signature can be assigned to the cognate X group. A comprehensive analysis revealed that a maximum of 30 X groups can be unequivocally extracted from the 13C NMR signals. From this total number of experimentally accessible X groups, 25 can be determined independently for the α and β anomer. Because the isotopolog compositions of the α and β anomer in a given isotopolog mixture are identical (thermodynamic isotope effects are too small to be of any significance whatsoever), the partial redundancy of the X groups is a welcome tool to check the accuracy of the analysis. This accuracy check is illustrated in Table 2 by a comparison of the mol % of each of the redundantly observed X groups in the α and β anomer.
By simple combinatorial reasoning, the total number of X groups is 36 = 729, including the 64 possible isotopologs of glucose, but not all X groups provide unique information, because certain X groups are supersets of orthogonal subsets. For example, the {XXXXXX} group is the sum of all isotopologs present in a given glucose sample and has the trivial value of 100 mol %. As another example, {11XXXX} has the subsets {110XX0}, {111XX0}, {110XX1}, and {111XX1} (see Fig. 2).
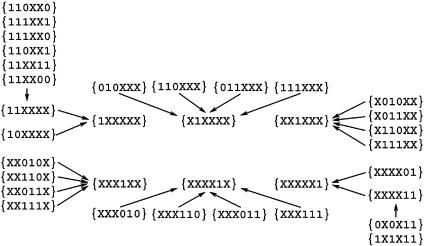
The relationship of all observable X groups is shown in Fig. 3. The integrals of the supersets represent the sums of the integrals of all their subsets; hence, the supersets do not provide independent information on the isotopolog composition of an isotopolog mixture. However, the numerical values of the supersets can serve as an additional filter to check the accuracy and consistency of the collected data.
Fig. 3.
Hierarchical representation of observable X groups. Arrows connect subsets with their corresponding supersets.
Although it is not a priori impossible to use the mol % values of the X groups directly for a biochemical interpretation of metabolic flux in the experimental system, it would be clearly preferable to extract first the concentration of individual isotopologs from the experimental data as a basis for further analysis. In consequence of the data redundancy mentioned above, the quantitative assessment of all 30 X groups that can be experimentally observed affords only 22 linearly noncombinatorial concentration values (i.e., independent constraints). Because glucose has 64 possible isotopologs, the data set is inherently underdetermined (irrespective of the better or worse accuracy of the individual integrals), and the resolution of the concentrations of all 64 isotopologs is impossible to achieve by linear deconvolution.
The problem of underdetermination can be independently addressed by two different approaches. First, the isotopologic glucose mixture could be chemically or enzymatically converted into one or several different derivatives that are amenable to NMR analysis. This approach could provide quantitative information on additional X groups because the coupling patterns would be different in the original glucose and the derivatives.
A second approach uses an approximation that is based on biochemical arguments. If a multiply 13C-labeled compound or a mixture of multiply 13C-labeled compounds is used in a perturbation experiment, catabolic processes will be conducive to the breaking of bonds between adjacent 13C atoms in the proffered precursor. The fragments obtained in that way can subsequently be used as building blocks for anabolic processes that are conducive to the formation of carbon bonds. If we assume that the amount of 13C-labeled material used in a perturbation experiment is small by comparison with the total amount of carbon sources, the assembly of metabolites by metabolic recombination of two or more fragments labeled with 13C is unlikely (because most metabolite molecules present in the metabolom will have been derived from unlabeled precursors). Hence, on the basis of statistical arguments, anabolic processes will be conducive to breaking 13C13C connections, but only rarely to the formation of 13C13C connections. In that case, our analysis can disregard all isotopologs of glucose that might be obtained exclusively by the anabolic recombination of two or more 13C-labeled molecules because the event is rare and the amount of the corresponding reaction product is below the level of detection. As an example, consider the putative formation of the {100100} isotopolog of glucose from [3-13C1]glyceraldehyde 3-phosphate and [1-13C1]dihydroxyacetone 3-phosphate; if both triose isotopologs had abundances of 2 mol %, the abundance of the glucose isotopolog would be ≈0.04 mol %, well below the level of experimental sensitivity.
Simple combinatorial reasoning indicates that a maximum of 21 isotopologs of glucose can be expected to be present in significant amounts in an experimental system where the stochastic 13C distribution is perturbed by the addition of a low amount of [U-13C6]glucose to a large excess of nutrients with natural 13C abundance. That group of isotopologs comprises one molecular species with six consecutive 13C atoms (i.e., the {111111} isotopolog), two isotopologs with five contiguous 13C atoms (i.e., the {011111} and {111110} isotopologs), three isotopologs with contiguous blocks of four 13C atoms, four isotopologs with blocks of three contiguous 13C atoms, five isotopologs with blocks of two consecutive 13C atoms, and six isotopologs with single 13C atoms (Fig. 4). Notably, this purely formal analysis ignores, on purpose, that the formation of some of these isotopologs is not plausible on the basis of known metabolic pathways.
Fig. 4.
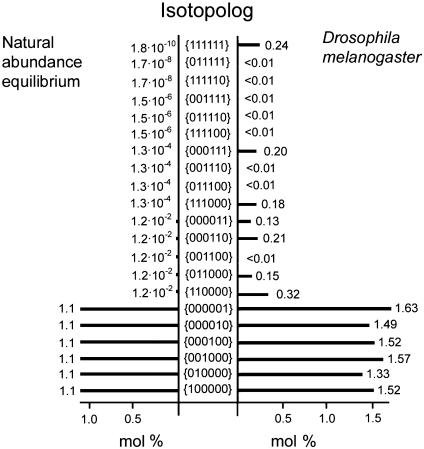
Approximate natural abundance of selected glucose istopologs versus their occurance in the D. melanogaster feeding experiment.
Based on this assumption, the number of unknown isotopolog concentrations in the deconvolution process can be constrained from 64 to 21. The deconvolution algorithm was tested extensively with synthetic data sets and was found to operate with high reliability. It was also found to be quite robust against the introduction of artificial white noise into synthetic data sets.
The deconvolution results of the feeding experiment with D. melanogaster are summarized in Fig. 4. Seven multiply labeled isotopolog species were calculated with significant abundance. First, the universally 13C-labeled {111111} isotopolog that was proffered in the culture medium has a residual abundance of 0.24 mol %. The most abundant multiply labeled species is the double-labeled {110000} isotopolog species (0.32 mol %). The triple-labeled {111000} and {000111} species and the double-labeled species {011000}, {000110}, and {000011} have similar abundance levels in the range of 0.1-0.2 mol %. Other multiply labeled isotopologs are well below a concentration of 0.01 mol %. The averaged error of the computational deconvolution equals 0.04 mol % with a standard deviation of 0.06. The deconvolution remained stable in different runs using random starting points.
It is also important to note that the abundance of most single-labeled isotopologs was well above the natural abundance level of 1.1%. The {100000}, {001000}, {000100}, {000010}, and {000001} species are in the concentration range around 1.5-1.6 mol %. On the other hand, the {010000} isotopolog is only slightly elevated by comparison with the natural abundance level, in the range of 1.3 mol %. These values signify that single 13C atoms are diverted back to glucose from the proffered [U-13C6]glucose after fragmentation of the proffered carbohydrate and recycling in the metabolic network.
Discussion
This study was designed to probe the feasibility of a comprehensive quantitative analysis of complex 13C isotopolog populations as a prerequisite for the description of metabolic flux in terms of the isotopolog perturbation/relaxation concept. The proposed concept of X groups establishes a direct link between specific NMR features in the 13C NMR spectrum with the concentrations of certain groups of 13C isotopologs. As shown above, the X groups can be obtained from a detailed analysis of coupling constants and heavy isotope shift increments. However, it should be noted that the ensemble of X groups depends on experimental parameters, most notably the spectral resolution. At progressively lower resolution, the concentration of fewer X groups can be determined. On the other hand, instrumental improvements could be conducive to improved resolutions where additional fine structure caused by long-range coupling could become accessible.
In the specific case of glucose, the theoretical number of X groups is 729. Notably, certain X groups are the sums of other, mutually exclusive, subsets. Therefore, not all X groups provide unique information. At an experimental line width of ≈1 Hz, 30 unique X groups can be determined. Because the number of carbon isotopologs of glucose is 64, the system is clearly underdetermined, and deconvolution affording the concentration of every individual isotopolog is not possible.
That problem can be addressed by the use of a 13C-labeled tracer compound or compounds at a relatively low concentration. In that case, exclusively anabolic processes derive their starting materials from metabolites with a low overall 13C abundance; hence, the de novo formation of multiply 13C-labeled isotopologs by anabolic processes has a low probability and can be neglected. As mentioned above, for the present experiments, it is sufficient for the analysis to include all isotopologs that carry single carbon atoms or contiguous blocks of two to six 13C atoms. The number of isotopolog concentrations to be determined is thereby limited to 21 of 64. With that approximation, the system is, in fact, overdetermined by the 30 nonredundant X groups that can be unequivocally extracted from the 13C spectrum.
This paper is directed at establishing a method for the quantitative assessment of multiple isotopologs. A detailed description of the carbohydrate metabolism of Drosophila will require numerous additional experiments. However, a few conclusions are already possible:
The experimental setting can be used to transfer 13C label into the carbohydrate pool of Drosophila. More specifically, the isotopolog composition of glucose indicates a complex biosynthetic history of the analyzed glucose involving multiply 13C-labeled central intermediates (e.g., triose phosphate, oxaloacetate, acetyl-CoA) in the recycling process (see below). This, in turn, can be taken as evidence that the 13C label can also be diverted to proteins in case of de novo biosynthesis of amino acids via the labeled precursors mentioned above. Notably, metabolic labeling of D. melanogaster protein has attracted considerable interest for quantitative proteomics (28).
Of the total amount of the 13C excess (3.9 mol %), only about 0.24 mol % is present as the {111111} isotopolog. In other words, 94% of the 13C-labeled glucose molecules present in the extract have been broken into pieces and reassembled at least once.
The {111000} and {000111} isotopologs occur in similar amounts. Both of them can be formed by glucogenesis from [U-13C3]triose phosphate units, which are produced by glycolysis or by the nonoxidative branch of the pentose phosphate cycle.
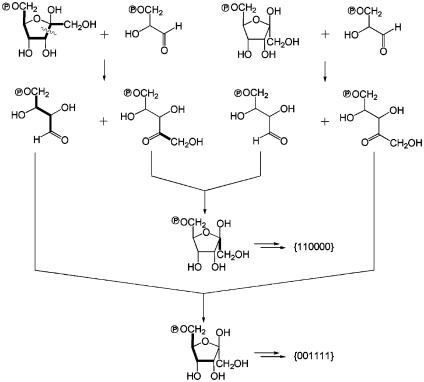
The {110000} isotopolog has the highest abundance among the multiply 13C-substituted glucose forms. The formation of the isotopolog is best explained by the transketolase activity in the nonoxidative branch of the pentose phosphate cycle, namely by graftingofa[13C2] unit derived from a labeled glucose molecule to an erythrose 4-phosphate moiety derived from an unlabeled glucose molecule (notably, unlabeled carbohydrates are present in large excess in the feed mixture) (Fig. 5). Vice versa, combination of an unlabeled C2 unit with [U-13C4]erythrose 4-phosphate derived from [U-13C6]glucose results in a {001111} isotopolog. Notably, this isotopolog was not detected in significant amounts (<001 mol %). Because the transaldolase activity of the pentose phosphate pathway is conducive to breaking the C3/C4 bond of hexoses and, after glucogenesis, lead to an apparent loss of the {001111} isotopolog (but not of the {110000} isotopolog), it can be concluded that both transketolase and transaldolase of the pentose phosphate pathway act cooperatively in the experimental system.
The {000011} isotopolog could be formed from the {110000} isotopolog by a sequence of glycolysis and glucogenesis. The abundance of the {110000} isotopolog is ≈3-fold larger as compared to the {000011} isotopolog. It follows that the bidirectional metabolite flux via the glycolytic and the gluconeogenesis pathway is not large enough to reach equilibration of these two isotopologs.
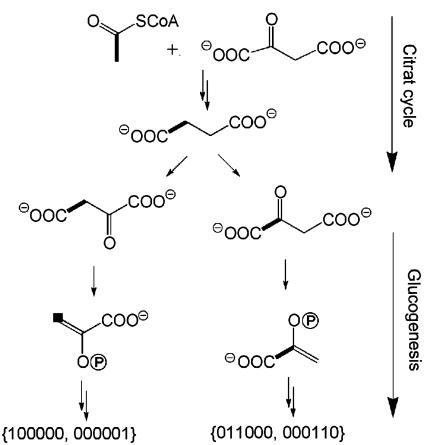
The {011000} and {000110} isotopologs both occur in relatively large abundance. The fact that their absolute abundances are similar to each other suggests that they were both assembled anabolically by gluconeogenesis from [1,2-13C2]glyceraldehyde 3-phosphate, which must be in a state of equilibrium with [1,2-13C2]dihydroxyacetone 3-phosphate. The origin of these labeled triose phosphate species is most likely caused by a complex sequence of reactions implicating the citrate cycle and the Cori cycle. More specifically, [U-13C2]acetyl-CoA obtained by glycolysis from an appropriately labeled glucose (i.e., from {111111}, {111000}, {000111}, {110000}, or {000011} isotopologs that are known to have been present in the glucose pool of the flies) is assumed to afford [1,2-13C2]- and [3,4-13C2]oxaloacetate via the citrate cycle. Catalytic action of phosphoenolpyruvate (PEP) carboxykinase could convert [1,2-13C2]oxalacetate into [1,2-13C2]PEP, which is conducive to the formation of the {011000} and {000110} isotopologs of glucose by glucogenesis (Fig. 6).
Not surprisingly, {111100}, {111110}, {011110}, {011111}, and {001100} isotopologs are not present in significant amounts. In fact, there are no known pathways that could explain their generation.
It should be noted that all metabolic transactions invoked above operate at the level of phosphoric acid esters. Hence, it must be assumed that a glucose phosphatase operates in the insect system, similar to the one present in the mammalian liver.
Drosophila is known to harbor endosymbiotic bacteria that are known to contribute to the metabolism of the host in an incompletely understood manner. Future experiments can be designed to discriminate between the respective contributions of the flies and the endosymbionts.
Fig. 5.
Formation of {110000} and {001111} glucose phosphate by the catalytic action of transketolase in the pentose phosphate cycle. Bonds in bold type connect 13C atoms in multiply 13C-labeled isotopomers derived from [U-13C6]glucose in the feed supplement.
Fig. 6.
Formation of {100000}, {000001}, {011000}, and {000110} glucose through the Cori cycle. Bonds in bold type connect 13C atoms in multiply 13C-labeled isotopomers derived from [U-13C6]glucose in the feed supplement.
Whereas Drosophila is ideally suited for metabolic studies in animals, the methods described can be used, without major modification, for studies in a wide variety of experimental systems including higher animals. Clinical applications in areas such as diabetology, obesity research and genetically based metabolic defects appear possible. It should also be noted that the method outlined in the paper is not in any way limited to the quantitative analysis of glucose catabolism and glucogenesis. On the contrary, it can be applied to the catabolism and biosynthesis of any primary or secondary metabolites.
Supplementary Material
Acknowledgments
We thank Prof. Christiane Nüsslein-Vollhardt for the Drosophila melanogaster Oregon-R* strain, Dr. Ramon Torres for help with the insect culture, Profs. Helmut Simon and Duilio Arigoni for helpful discussions, and Fritz Wendling for expert help with the preparation of the manuscript. This work was supported by grants from the Deutsche Forschungsgemeinschaft and the Fonds der Chemischen Industrie.
This paper was submitted directly (Track II) to the PNAS office.
References
- 1.Minkin, V. I. (1999) Pure Appl. Chem. 71, 1919-1981. [Google Scholar]
- 2.Schmidt, H.-L. (2003) Naturwissenschaften 90, 537-552. [DOI] [PubMed] [Google Scholar]
- 3.Ghashghaie, J., Badeck, F.-W., Lanigan, G., Nogués, S., Tcherkez, G., Deléens, E., Cornic, G. & Griffith, H. (2003) Phytochem. Rev. 2, 145-161. [Google Scholar]
- 4.Schmidt, H.-L., Werner, R. A. & Eisenreich, W. (2003) Phytochem. Rev. 2, 61-85. [Google Scholar]
- 5.Martin, G. J. & Martin, M. L. (2003) Phytochem. Rev. 2, 179-190. [Google Scholar]
- 6.Miller, R. F., Orr, G. L., Fritz, P., Downer, R. G. H. & Morgan, A. V. (1985) Can. J. Zool. 63, 584-589. [Google Scholar]
- 7.Schönheimer, R. & Rittenberg, D. (1935) Science 82, 156-157. [DOI] [PubMed] [Google Scholar]
- 8.du Vigneaud, V., Simmonds, S., Chandler, J. P. & Cohn, M. (1945) J. Biol. Chem. 159, 755-756. [Google Scholar]
- 9.Kamen, M. D. (1947) Annu. Rev. Biochem. 16, 631-654. [DOI] [PubMed] [Google Scholar]
- 10.Calvin, M., Heidelberger, C., Reid, J. C., Tolbert, B. M. & Yankwich, P. F. (1949) Isotopic Carbon (Wiley, New York).
- 11.Eisenreich, W., Strauss, G., Werz, U., Bacher, A. & Fuchs, G. (1993) Eur. J. Biochem. 215, 619-632. [DOI] [PubMed] [Google Scholar]
- 12.Szyperski, T. (1995) Eur. J. Biochem. 232, 433-438. [DOI] [PubMed] [Google Scholar]
- 13.Schmidt, K., Marx, A., deGraaf, A. A., Wiechert, W., Sahm, H., Nielsen, J. & Villadsen, J. (1998) Biotechnol. Bioeng. 58, 254-257. [DOI] [PubMed] [Google Scholar]
- 14.Fiaux, J., Andersson, C. J. Y., Holmberg, N., Bülow, L., Kallio, P. T., Szyperski, T., Bailey, J. E. & Wüthrich, K. (1999) J. Am. Chem. Soc. 121, 1407-1408. [Google Scholar]
- 15.Park, S. M., Klapa, M. I., Sinskey, A. J. & Stephanopoulos, G. (1999) Biotechnol. Bioeng. 62, 392-401. [DOI] [PubMed] [Google Scholar]
- 16.Bacher, A., Rieder, C., Eichinger, D., Fuchs, G., Arigoni, D. & Eisenreich, W. (1999) FEMS Microbiol. Rev. 22, 567-598. [Google Scholar]
- 17.Kruger, N. J., Ratcliffe, R. G. & Roscher, A. (2003) Phytochem. Rev. 2, 17-30. [Google Scholar]
- 18.Glawischnig, E., Gierl, A., Tomas, A., Bacher, A. & Eisenreich, W. (2002) Plant Physiol. 130, 1717-1727. [DOI] [PMC free article] [PubMed] [Google Scholar]
- 19.Myers, E. W., Sutton, G. G., Delcher, A. L., Dew, I. M., Fasulo, D. P., Flanigan, M. J., Kravitz, S. A., Mobarry, C. M., Reinert, K. H., Remington, K. A., et al. (2000) Science 287, 2196-2204. [DOI] [PubMed] [Google Scholar]
- 20.Scherzer, C. R., Jensen, R. V., Gullans, S. R. & Feany, M. B. (2003) Hum. Mol. Genet. 12, 2457-2466. [DOI] [PubMed] [Google Scholar]
- 21.Lau, G. W., Goumnerov, B. C., Walendziewicz, C. L., Hewitson, J, Xiao, W., Mahajan-Miklos, S., Tompkins, R. G., Perkins, L. A. & Rahme, L. G. (2003) Infect. Immun. 71, 4059-4066. [DOI] [PMC free article] [PubMed] [Google Scholar]
- 22.Apostol, B. L., Kazantsev, A., Raffioni, S., Illes, K., Pallos, J., Bodai, L., Slepko, N., Bear, J. E., Gertler, F. B., Hersch, S., et. al. (2003) Proc. Natl. Acad. Sci. USA 100, 5950-5955. [DOI] [PMC free article] [PubMed] [Google Scholar]
- 23.Gvozdev, V. A., Gerasimova, T., Kogan, G. L. & Braslavskaya, O. Y. (1976) Dokl. Akad. Nauk SSSR 227, 1476-1479. [PubMed] [Google Scholar]
- 24.Roberts, D. B. (1998) in Drosophila: A Practical Approach, ed. Roberts, D. B. (IRL, Oxford) pp. 1-38.
- 25.Eisenreich, W. & Bacher, A. (2000) Genet. Eng. 22, 121-153. [DOI] [PubMed] [Google Scholar]
- 26.Holland, J. H. (1975) Ph.D. thesis (University of Michigan, Ann. Arbor).
- 27.Rechenberg, I. (1973) Ph.D. thesis (Frommann-holzboog, Stuttgart).
- 28.Krijgsveld, J., Ketting, R. F., Mahmoudi, T., Johansen, J., Artal-Sanz, M., Verrijzer, C. P., Plasterk, R. H. A. & Heck, A. J. R. (2003) Nat. Biotechnol. 21, 927-931. [DOI] [PubMed] [Google Scholar]
Associated Data
This section collects any data citations, data availability statements, or supplementary materials included in this article.


