Abstract
Consumption of the trichothecene deoxynivalenol (DON) suppresses growth in experimental animals - an adverse effect that was used to establish the tolerable daily intake for this toxin. DON ingestion has been recently found to suppress plasma insulin-like growth factor acid-labile subunit (IGFALS), a protein essential for growth. Studies were conducted to explore the feasibility of using plasma IGFALS as a biomarker of effect for DON. In the first study, weanling mice were fed 0, 1, 2.5, 5 and 10 ppm DON and weight and plasma IGFALS determined at intervals over 9 wk. Reduced body weight gains were detectable beginning at wk 5 in the 10 ppm dose and wk 7 at the 5 ppm dose. Plasma IGFALS was significantly depressed at wk 5 in the 5 and 10 ppm groups at wk 9 in the 10 ppm group. Depressed IGFALS significantly correlated with reduced body weight at wk 5 and 9. Benchmark dose modeling revealed the BMDL and BMD for plasma IGFALS reduction were 1.1 and 3.0 ppm DON and for weight reduction were 2.1 and 4.5 ppm DON. In the second study, it was demonstrated that mice fed 15 ppm DON diet had significantly less plasma IGFALS than mice fed identical amounts of control diet. Thus DON’s influence on IGFALS likely reflects the combined effects of reduced food intake as well as its physiological action involving suppressors of cytokine signaling. Taken together, these findings suggest that plasma IGFALS might be a useful biomarker for DON’s adverse effects on growth.
Keywords: Deoxynivalenol, insulin-like growth factor acid-labile subunit, cytokine, growth, anorexia
1. Introduction
The Type B trichothecene mycotoxin deoxynivalenol (DON) is a frequent contaminant of grain products throughout the world and is an important public health concern because of its reported toxicological effects in humans and animals (Pestka 2010). In experimental mice, DON’s acute effects (hours) include anorexia and robust proinflammatory gene expression and longer-term effects (days) include anorexia and growth suppression (Arnold et al. 1986; Azcona-Olivera et al. 1995; Flannery et al. 2011; Forsell et al. 1986; Rotter et al. 1996).
Children are likely to be exposed to DON to a greater extent than adults due to due to food consumption per body weight. A survey by the United States Department of Agriculture demonstrated that adults on average consume 189 g grains per day while children consume 191 g/day but because they weigh less, they are exposed to a greater amount of grains per kg body weight (Lin and Yet 2007). Given children’s potential susceptibility to growth effects of DON, growth suppression was the primary adverse effect identified by The Joint FAO/WHO Expert Committee on Food Additives (JECFA) as the basis for establishing a tolerable daily intake (TDI) for this toxin (Canady et al. 2001; Iverson et al. 1995). During an exposure study in The Netherlands, it was estimated 80% of children exceeded the TDI for DON (Pieters et al. 2002). These findings raise questions whether DON might affect growth in children or other high consumers of wheat and other grains, and, furthermore, suggest the need for epidemiological studies in linking exposure to this toxin to growth impairment in humans.
To assess human exposure to xenobiotics and their resultant effects, biomarkers are often used. Biomarkers of exposure are typically metabolites that correlate with the amount of substance ingested. Relative to DON, Turner and coworkers have developed and validated the exposure biomarker DON-glucuronide (DG) (Turner et al. 2008a). Using urinary DG and free DON, these investigators determined that 98.7% of the UK adults evaluated had been exposed to DON and furthermore, increased DG and free DON were strongly correlated with high grain consumption (Turner et al. 2008b). While these exposure biomarkers are highly informative for quantifying DON consumption, they are not indicative of adverse effects that might result from exposure to this toxin.
Biomarkers of effect are typically physiological indicators that predict the likelihood of harmful downstream biological consequences of xenobiotic exposure. Desirable characteristics of candidate effect biomarkers for implementation in epidemiological studies include 1) specificity for the xenobiotic of interest, 2) facile measurement, 3) presence after physiologically relevant doses and 4) validation in humans exposed to the toxin. No biomarker of effect has yet been established for DON, making it impossible to measure adverse physiological outcomes.
One candidate effect biomarker for DON-induced growth perturbation is insulin-like growth factor acid-labile subunit (IGFALS) (Amuzie and Pestka 2010; Voss 2010). IGFALS is a plasma protein primarily produced in the liver that is an essential binding partner of the highly critical insulin like growth factor – 1 (IGF1). IGFALS functions to extend IGF1’s half-life and enables it to reach target tissues to modulate growth (Dai and Baxter 1994; Dai et al. 1994; Domene et al. 2011). Mutations in the Igfals gene have been linked to short stature in humans (Domene et al. 2010; Heath et al. 2008). Based on studies in the mouse, our laboratory has recently proposed a mechanistic link between depressed plasma IGFALS and growth suppression that involves suppressor of cytokine signaling 3 (SOCS3)–induced growth hormone receptor signaling impairment (Amuzie and Pestka 2010; Amuzie et al. 2009).
Prior investigations in mice have demonstrated that plasma IGFALS is critical for normal growth. For example, Igfals null mice exhibited significantly depressed growth with weight being of 13% less than controls at 10 wk of age (Ueki et al. 2000). IGFALS has been reported to control postnatal growth by affecting the ability of growth hormone to increase IGF1 and by affecting stabilization of IGF-1 and thus, the longevity of IGF1 in the plasma (Ueki et al. 2009). Evidence of this was shown in null ALS mice, which exhibited decreased IGF1 levels that could not be normalized through exogenous administration of growth hormone (Ueki et al. 2009). Consistent with this premise, our laboratory has previously demonstrated the inability of exogenous growth hormone to rescue DON-induced reductions of hepatic Igfals in mice, suggesting that growth hormone signaling was impaired (Amuzie and Pestka 2010).
There are two key considerations regarding the suitability of IGFALS as an effect biomarker for DON. First, it must be confirmed that decreased plasma levels of IGFALS occur at dietary DON concentrations that affect weight gain in experimental animals. Second, clarification is needed on whether DON-induced decreases in plasma IGFALS are simply the result of reduced food intake or originate from a toxin-mediated pathway such as that proposed involving SOCS3. We addressed these concerns here by testing two hypotheses. The first hypothesis tested was that decreases of plasma IGFALS will correlate with DON-induced depression in weight gain. The second hypothesis tested was that DON-fed mice will exhibit lower plasma IGFALS concentrations than mice consuming identical restricted amounts of control diet. The results presented herein indicate that DON-induced depression of plasma IGFALS was 1) indicative of growth suppression relevant DON doses and 2) a likely result from reduced food intake and aberrant SOCS regulation. Accordingly, IGFALS merits future consideration as a biomarker of effect.
2. Materials and Methods
2.1. Laboratory Animals and diet
B6C3F1 female mice (3 wk) were purchased from Charles River Breeding (Portage, MI) and were housed on ventilated racks in plastic cages with kiln-dried aspen bedding and filter tops to prevent aerosolization of DON contaminated food. The room was maintained at constant humidity (40–55%) and constant temperature (21C) with a 12-h light/dark cycle. Mice were given fresh food daily placed in 2” high glass containers. Animal experiments were conducted according to the National Institutes of Health guidelines and approved by the Michigan State University Committee on Animal Use and Care.
DON (>98% purity by elemental analysis) was obtained from Dr. Tony Durst (University of Ottawa). DON was added to powdered AIN-93G (Research Diets, New Brunswick, NJ) at appropriate concentrations as described previously (Forsell et al. 1986). DON concentration in food was confirmed using Veratox High Sensitivity (HS) enzyme-linked immunosorbent assay (ELISA) (Neogen, Lansing, MI) according to the manufacturer’s instructions.
2.2. Study Design 1: Sub-chronic dietary DON exposure
Mice (n = 12 per group) were fed AIN-93G powder diet amended with DON at concentrations of 0, 1, 2.5, 5, and 10 ppm. These concentrations were chosen to encompass the NOAEL (1 ppm) and LOAEL (5 ppm) for weight suppression reported in a 2-year chronic feeding study (Iverson et al. 1995). Mice were weighed weekly and 100 µl blood removed via the saphenous vein at wk 5. After 9 wk exposure to DON, mice were euthanized by intraperitoneal (ip) injection of 100 µl sodium pentobarbital (56 mg/kg bw). Blood was collected using heparinized syringes (50 IU, BD, Franklin Lakes, NJ) from the inferior vena cava, mixed and immediately put on ice. Livers were removed for RT-PCR analysis of Socs3 and Igfals mRNA. Blood was centrifuged at 3000 × g for 10 min and plasma collected and frozen at - 80°C for later IGFALS determination.
2.3. Study Design 2: Restricted Dietary DON Exposure
The daily consumption of AIN93G diet amended with 15 ppm DON by mice (n = 30) was initially estimated over the period of 1 wk. This dose was chosen based on its ability to both rapidly depress plasma IGFALS and reduce food intake (Amuzie and Pestka 2010). Following the 1 wk trial, the same mice were given a 2 d washout period in which they consumed only unamended control diet. A 2 d washout period was chosen based on data by Pestka and coworkers demonstrating that <2% of the initial DON dose remained in plasma and other tissues of mice after 24 hr indicating rapid metabolism of DON (Pestka et. al. 2008). Mice were then randomized into three groups: 1) control diet ad libitum (ad lib), 2) restricted control diet or 3) restricted control diet containing 15 ppm DON. Food intake and weights were measured daily. Mice were sacrificed at 9 d and blood collected for IGFALS measurement as described above.
2.4. ELISA for IGFALS
IGFALS was assayed by ELISA as previously described (Amuzie and Pestka 2010). Absorbance at 450 nm was measured using a Molecular Devices ELISA Plate Reader (Menlo Park, CA) and IGFALS calculated from a standard curve using Softmax software (Molecular Devices).
2.5. Quantitative Real-Time PCR
RNA was extracted using Tri-Reagent (Molecular Research Center Inc., Cincinnati, OH) according to the manufacturer’s protocol. For RT-PCR mRNA expression determination, Assays-on-Demand primers for Socs3 and Igfals were utilized along with Taq-man One-Step Real-time PCR Master Mix (Applied Biosystems, Foster City, NY). Amplification and relative Ct values were determined using an ABI PRISM 7900HT Sequence Detection System. Gene expression was quantified relative to β2-microglobulin and fold change determined using the 2(−ΔΔCt) method (Livak and Schmittgen 2001).
2.6. Statistics
All statistics were performed using Sigma Plot 11.0 (Jandel Scientific, San Rafael, CA). For Study 1, a One-Way ANOVA with Holm-Sidak multiple comparisons procedure was used to determine statistical significance when comparing multiple dose groups during a given week. When normality failed, a One-Way ANOVA On Ranks was used with Dunn’s or Mann-Whitney U test along with a Bonferroni correction. Linear regression analysis was used to determine statistically if a measurement was dose-dependent, while a Pearson Product Moment Correlation was used to relate weight to plasma IGFALS. Two animals were not included in the plasma IGFALS wk 5 measurement due to lack of plasma. A Two-Way ANOVA on Ranks (normality failed) with Dunn’s Test or Mann-Whitney U test with Bonferroni correction was utilized to determine statistical significance among dose, weight or food intake and time relative to the control group for Study 2.
2.7 Benchmark Dose Modeling
The benchmark dose is a particular amount of substance given that results in a pre-specified effect. This pre-specified effect is known as the benchmark response (BMR). The United States EPA Benchmark Dose (BMD) Software Version 2.3.1 was utilized to compare benchmark doses (BMD). Wk and wk 8 were chosen for plasma IGFALS and weight, respectively, because they were the most sensitive time points for each parameter based on dose dependency and absolute differences between the control and 10 ppm DON dose groups. Since data needed to be monotonically increasing to be modeled, results were converted to percent reduction in plasma IGFALS or weight relative to the respective control group. Both data sets modeled were considered normal as determined by a Shapiro-Wilk Normality Test. Data were considered continuous with the Hill Model applied to raw dose and response data for both percent reductions of weight and plasma IGFALS. The Hill Model was chosen because it fit the data the best based on Global Goodness-of-Fit criteria, Akaike’s Information Criteron, Chi-squared residuals and graphical verification. Goodness-of-Fit measures determined the model exhibited a dose-response relationship (p<0.05), homogenous variance (p>0.1), equal variance (p>0.1) and the model sufficiently described the data (p>0.1). One standard deviation above the control mean was used to determine the benchmark dose response. The adverse direction of ‘up’ was chosen because increased percent reduction in weight and plasma IGFALS would be considered to negatively impact health. The benchmark dose 95% lower confidence limit (BMDL) was also determined. DON concentrations of 0, 1, 2.5, 5 and 10 ppm were utilized for both weight and IGFALS data.
3. Results
DON consumption dose-dependently suppresses weight gain and IGFALS (Study 1)
DON consumption dose-dependently suppressed weight gain of mice over a 9 wk period (R2= 0.254. p < 0.001). Mice fed control and 1 ppm DON diet gained 7.9 g and 8.3 g, respectively, during the course of the experiment while mice fed 2.5, 5 and 10 ppm gained 7.6 g, 7.3 g and 5.8 g, respectively (Fig. 1). Weights of mice fed the 5 ppm DON diet were significantly different than the control at 7 and 8 wk, while at 10 ppm DON, weights were significantly different at 5, 7, 8 and 9 wk.
Fig 1. DON consumption suppresses weight gain.
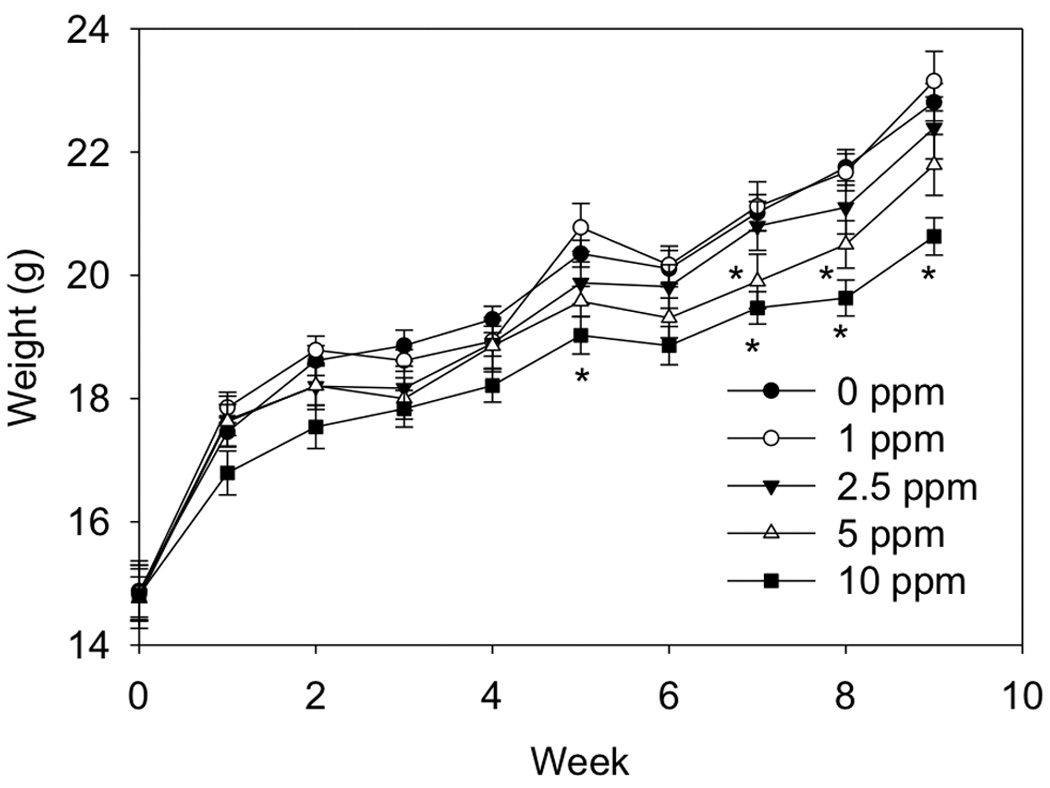
Mice were fed diet containing 0, 1, 2.5, 5 or 10 ppm DON for 9 wk and weights taken weekly. Data (n = 12/gp) are mean ± SEM. * indicates a statistically significant difference relative to the control at that time point (p ≤ 0.05).
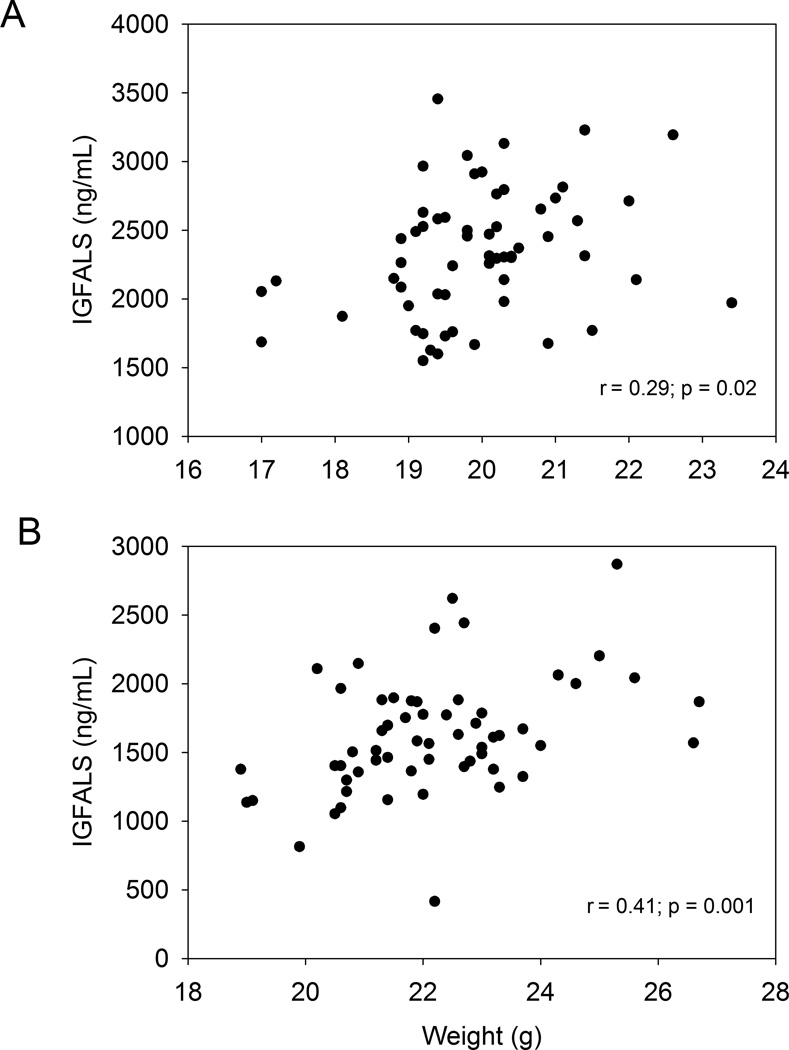
Plasma IGFALS at wk 5 was decreased by 20 percent and 29 percent relative to control values in mice fed 5 and 10 ppm DON, respectively (Fig. 2A). At wk 9, plasma IGFALS was decreased by 24 percent at 10 ppm DON (Fig. 2B). Interestingly, at wk 5, plasma IGFALS was significantly decreased in the 5 ppm but weight was not, suggesting that IGFALS depression preceded weight suppression. For both wk 5 (r = 0.29; p = 0.02) (Fig. 3A) and wk 9 (r = 0.41; p = 0.001) (Fig. 3B), weight was significantly correlated to plasma IGFALS.
Fig 2. DON consumption suppresses plasma IGFALS concentrations.
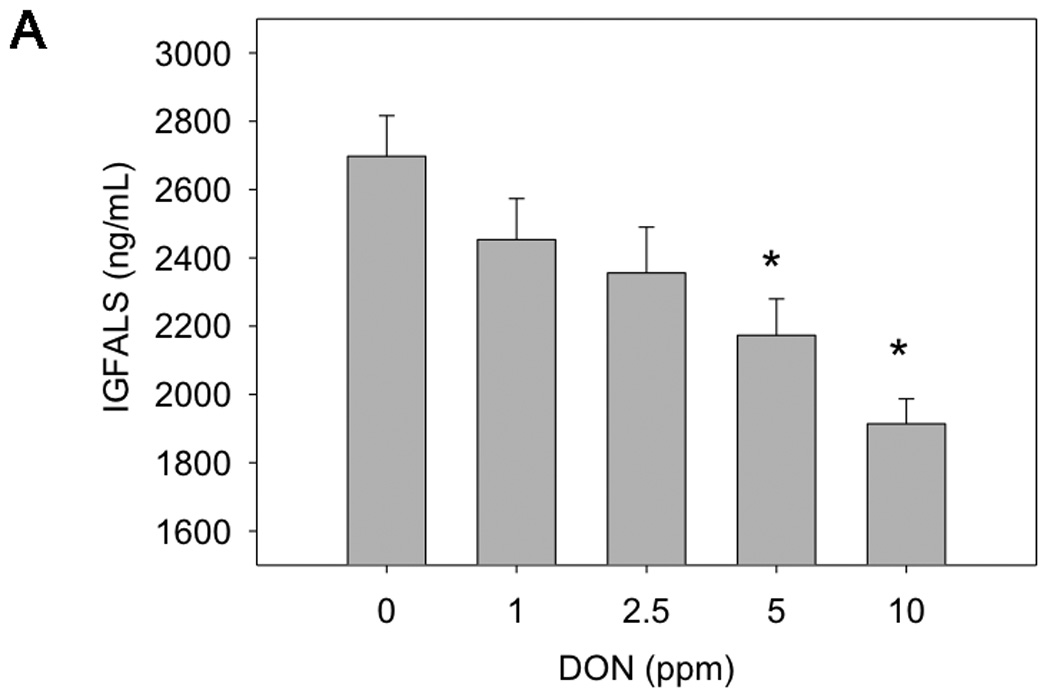
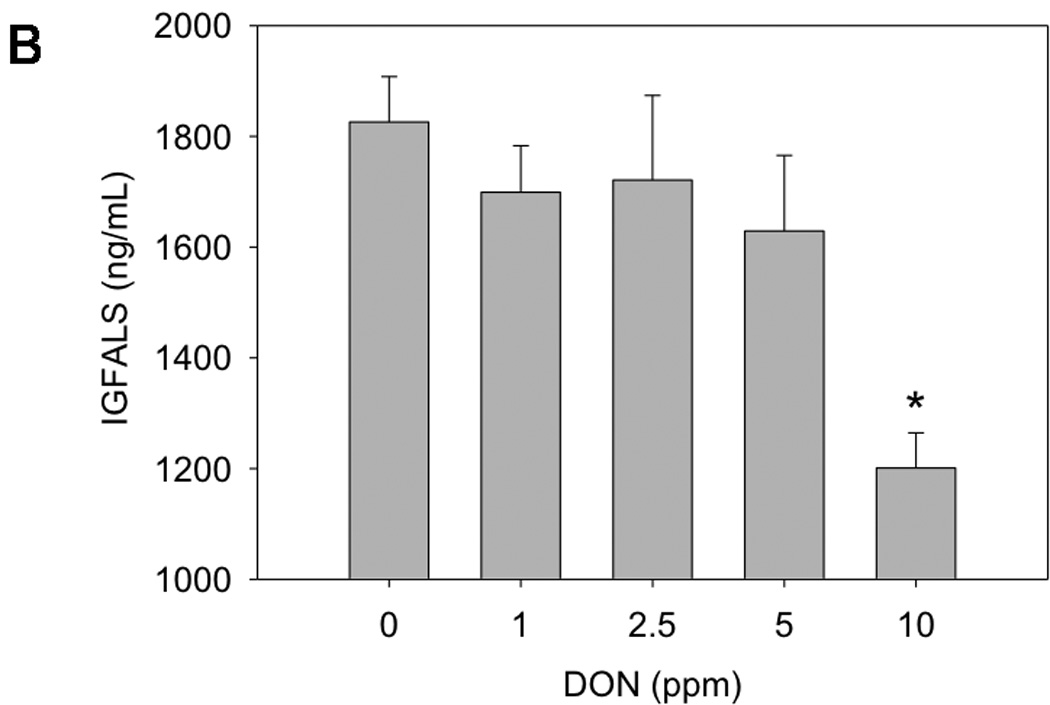
Mice were fed diet containing 0, 1, 2.5, 5 or 10 ppm DON and plasma IGFALS measured at A) 5 wk and B) 9 wk by ELISA. Data (n = 11–12/gp) are mean ± SEM. * indicates a statistically significant difference relative to the control (p ≤ 0.05).
Fig 3. Plasma IGFALS depression correlates with decreased weight gain.
Correlations were performed at A) wk 5 and B) wk 9 (Data n = 59). Correlations were statistically significant when (p ≤ 0.05).
Benchmark dose modeling indicated that the BMD using percent reduction in plasma IGFALS at wk 5 was 3.0 ppm DON, while the BMD for percent weight reduction at 8 wk was 4.5 ppm DON. The BMDLs for plasma IGFALS and weight reduction were 1.1 ppm and 2.1 ppm, respectively
RT-PCR analysis at wk 9 revealed that DON dose-dependently increased hepatic Socs3 mRNA expression (R2 = 0.12, p = 0.007) with 10 ppm DON exhibiting a significant 8-fold difference over control values (Fig. 4). A trend toward decreased Igfals mRNA was also evident at 10 ppm but not significant.
Fig 4. Effect of DON on hepatic mRNA expression of Socs-3 and Igfals.
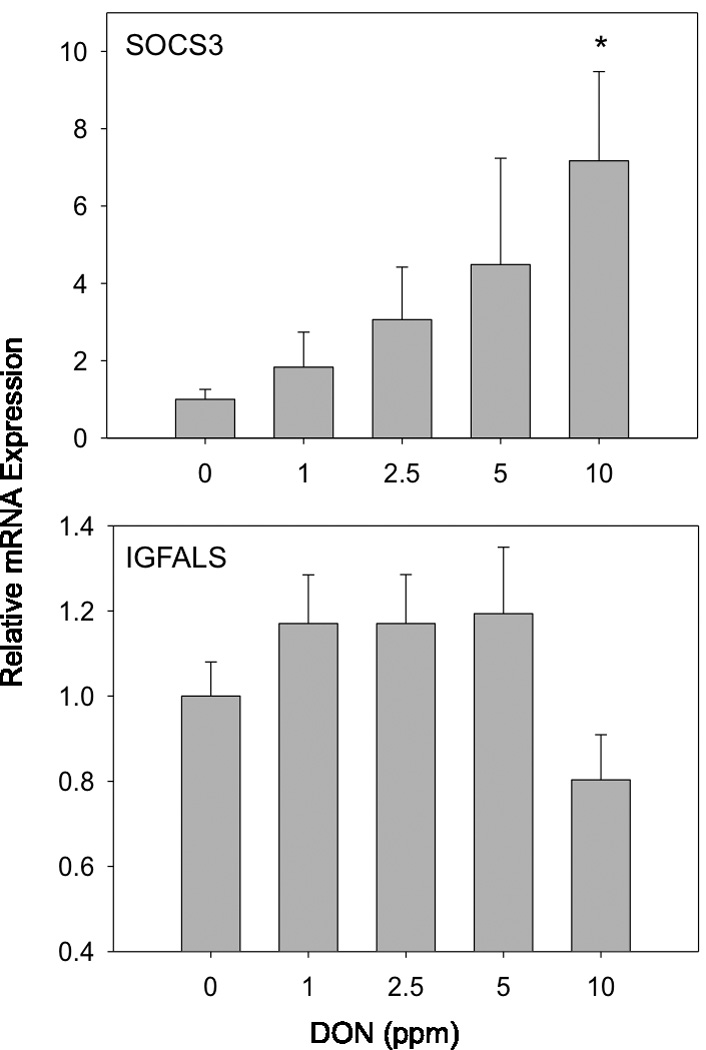
Mice were fed diets containing 0, 1, 2.5, 5 or 10 ppm DON over 9 wk and hepatic mRNA expression measured using real-time PCR. Data (n = 12/gp) are mean ± SEM. * indicates a statistically significant difference relative to the control (p ≤ 0.05).
Plasma IGFALS depression is specific to DON exposure (Study 2)
A food restriction study was employed to compare the extent to which DON-induced plasma IGFALS depression is attributable to reduced food intake versus another toxin-mediated mechanism such as aberrant SOCS3-regulation. To achieve this, mice were fed a control diet ad lib, a control restricted diet and a 15 ppm DON restricted diet. Food consumption in both restricted groups was identical and both were significantly less than the ad lib fed group (Fig. 5). Over the 9 d experimental period, restricted mice ate an average of 37 percent less than control mice with this translating into an average weight suppression of 7 percent for DON restricted mice and 6 percent for control restricted mice, respectively (Fig. 6). Mice fed restricted control and DON diets had significantly less plasma IGFALS than to those fed control diet ad lib (Fig. 7). Food restriction alone significantly decreased plasma IGFALS with control restricted mice exhibiting an 18 percent reduction in plasma IGFALS relative to the ad lib control. Remarkably, mice fed the restricted DON diet exhibited a 33 and 15 percent reduction in plasma IGFALS relative to the ad lib control and control restricted mice, respectively, indicating that part of DON’s capacity to suppress IGFALS was independent of its anorectic effect.
Fig 5. Comparison of food intakes during restricted feeding.
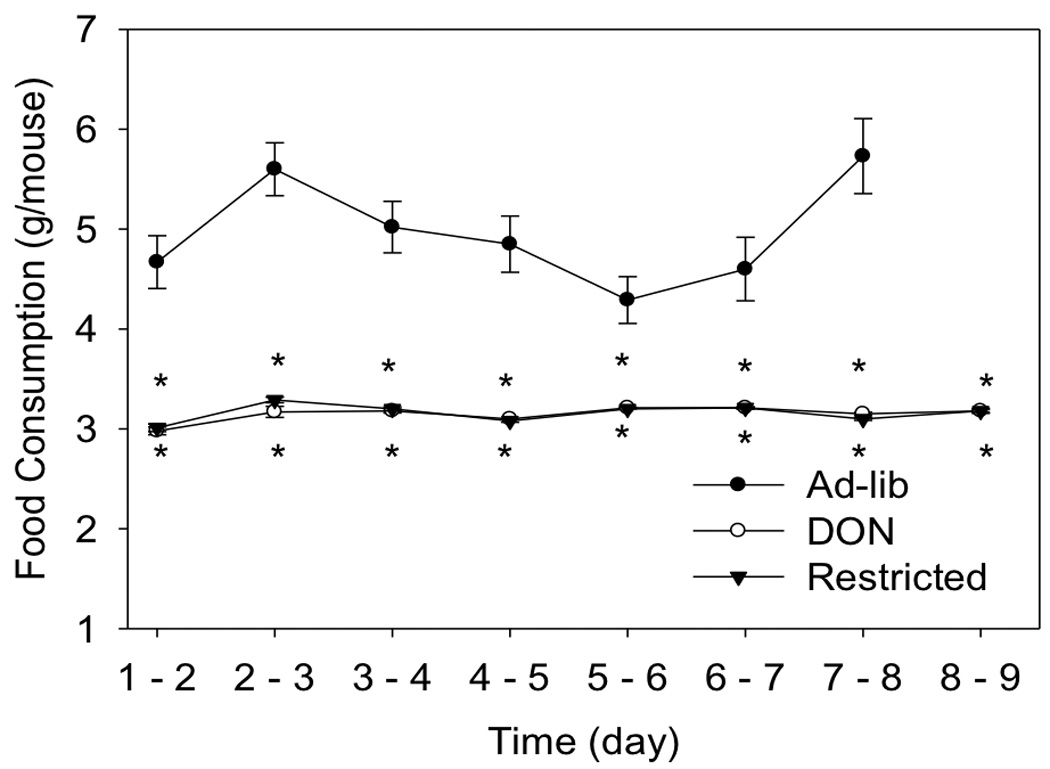
Mice were fed 1) ad-libitum control diet, 2) restricted control diet or 3) restricted diet containing 15 ppm DON for 9 d and food intake measured daily. Data (n = 10/gp) are mean ± SEM. * indicates a statistically significant difference relative to the control at that time point (p ≤ 0.05).
Fig 6. Comparison of body weight changes during restricted feeding.
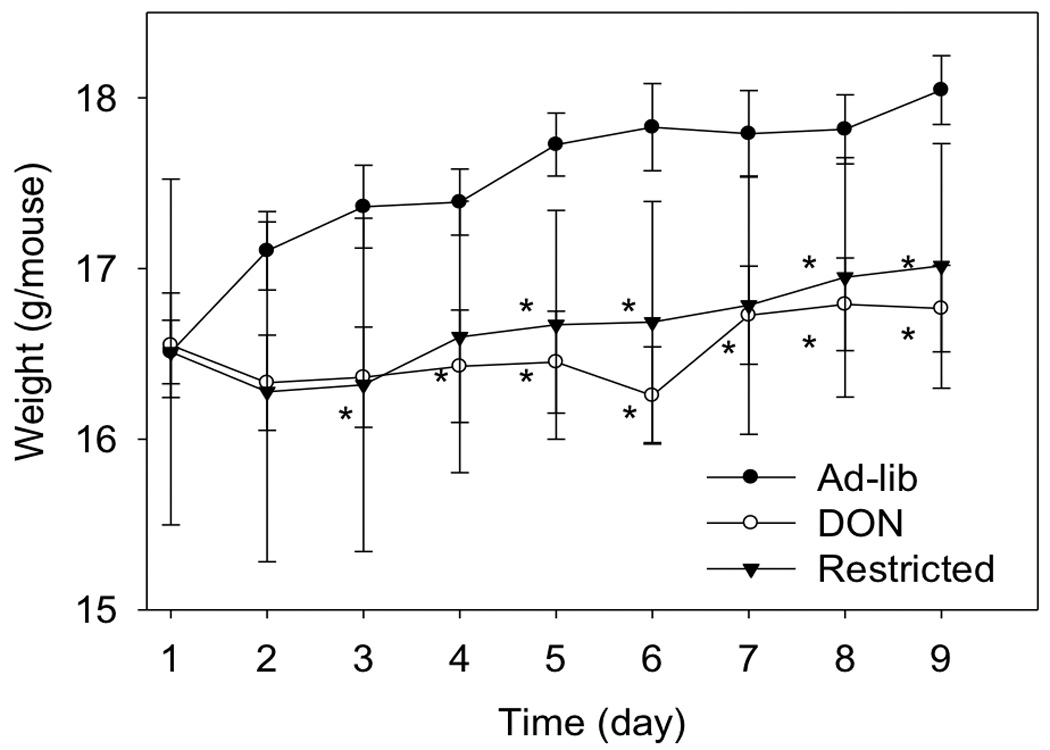
Mice were fed as described in Fig. 5 legend. Data (n = 10/gp) are mean ± SEM. * indicates a statistically significant difference relative to the control at that time point (p ≤ 0.05). No measurement of food intake for day 8 – 9 exists for control fed animals due to equipment failure for that measurement.
Fig 7. Comparison of plasma IGFALS levels in following restricted feeding.
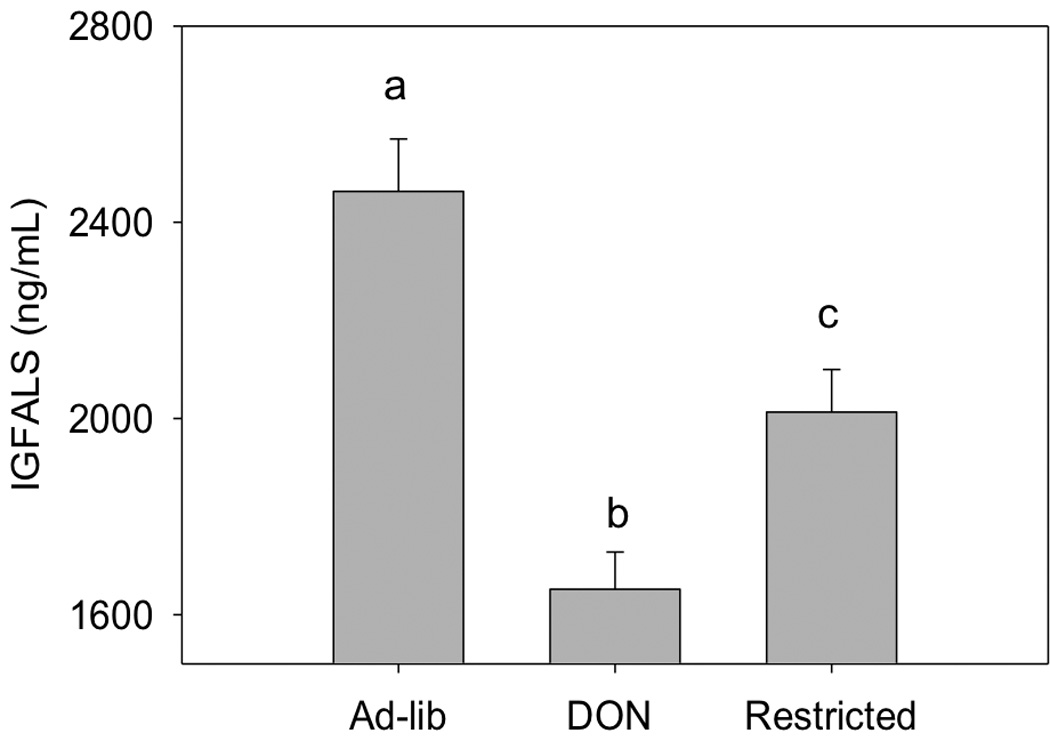
Mice were fed as described in Fig. 5. Terminal plasma IGFALS was measured using ELISA. Data (n = 10/gp) are mean ± SEM. Different letters indicate a statistically significant difference between groups (p ≤ 0.05).
4. Discussion
Growth suppression in mice was identified by JECFA as the primary adverse effect on which to base the human TDI for DON (Canady et al. 2001). The data presented in this study are the first to demonstrate that dietary DON causes plasma reduction of plasma IGFALS in a dose-dependent manner and that depression of IGFALS precedes DON-induced weight suppression. This investigation further suggests that IGFALS suppression was likely to result from both DON-induced anorexia and a second mechanism, possibly involving Socs3 upregulation (Fig. 4).
We have recently demonstrated that DON exposure rapidly induces release of the gut satiety hormones peptide YY and cholecystokinin (CCK) and this is likely to contribute to DON-induced anorexia (Flannery et al. 2012). The finding that dietary restriction per se depressed plasma IGFALS relative to the ad lib control is consistent with data from Oster and colleagues showing that consumption of a 40% calorically restricted diet reduced plasma IGFALS levels in rats by 14% and weight by 34% over a 20 d period (Oster et al. 1996). It is possible that DON-induced anorexia could lead to decreases in growth hormone receptors (Clemmons and Underwood 1991), a reported effect of anorexia in rats and thus, cause growth hormone signaling impairment. Anorexia-induced growth hormone impairment results in decreased plasma IGF1 as reported in mice (Al-Regaiey et al. 2005; Dunn et al. 1997) and could potentially lead to depressed IGFALS as well (Fig. 8). It should be noted that anorexia-mediated growth suppression is not exclusively linked to growth hormone signaling impairment but might involve other mechanisms.
Fig 8. Proposed pathways for DON-induced weight reduction.
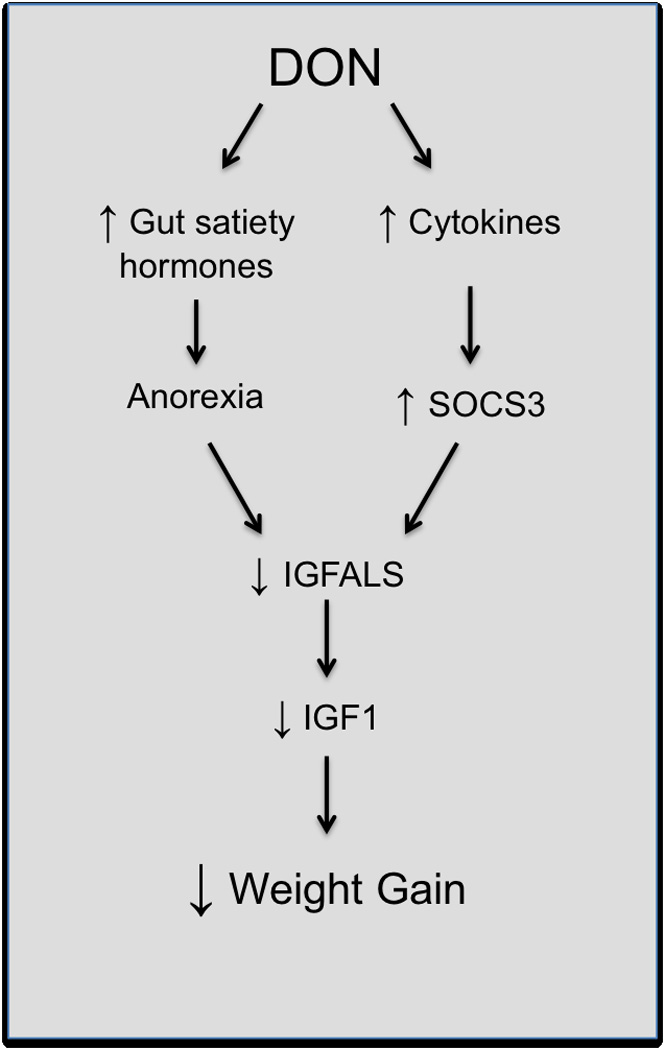
DON-induced growth suppression likely results from two parallel pathways based on this and prior studies (Amuzie et al., 2009; Amuzie and Pestka, 2010). First, anorexia resulting from DON-induced gut satiety hormone release could lead to decreases in growth hormone receptors (Clemmons and Underwood, 1991) and signaling, thus lowering plasma IGFALS. Second, growth hormone impairment caused by increased SOCS response to DON-induced proinflammatory cytokines, leads to depressed hepatic IGFALS mRNA and plasma IGFALS protein. Decreased plasma IGFALS destabilizes and reduces the half-life of binding partner IGF1 (Dai and Baxter, 1994), thus, leading to growth suppression.
In our experiments, mice fed restricted DON diet exhibited even lower plasma IGFALS concentrations than did the restricted control indicating that toxin exposure can directly affect IGFALS by mechanisms other than anorexia. We postulate that DON’s additional effects on IGFALS could be a result of upregulated expression of proinflammatory cytokines and subsequently increased SOCS proteins that serve the purpose to reduce an excessive cytokine response. SOCS are group of 8 proteins containing an Src homology 2 (SH2) domain that can block cytokine signaling via the janus kinase/signal transducer and activator of transcription (JAK/STAT) pathway by restricting JAK phosphorylation, specifically by interfering with STAT dimerization and by tagging important pathway signaling molecules with ubiquitin for proteosomal degradation (Rawlings et al. 2004). Notably, SOCS3 has been shown to affect growth of rat hepatoma cells and primary liver cells in a concentration dependent manner by preventing growth hormone stimulated increases in IGFALS mRNA expression (Boisclair et al. 2000).
Early marked upregulation of proinflammatory cytokines in DON-exposed mice precedes both decreases in plasma IGFALS and growth, both of which correspond to increased Socs3 expression. Mice gavaged with DON exhibit increased plasma levels and hepatic mRNA expression of interleukin – 6 (IL-6) and tumor necrosis factor - α (TNF-α) within 2 h after exposure, levels which rapidly decrease upon hepatic SOCS3 induction (Amuzie et al. 2009). At 5 h, maximum induction of hepatic SOCS3 corresponded to significant decreases in hepatic Igfals expression. Furthermore, a later subchronic mouse feeding study demonstrated DON-induced growth suppression corresponded to increased plasma levels of DON as well as decreased hepatic Igfals expression and plasma IGF1 and IGFALS (Amuzie and Pestka 2010). Taken together, DON-mediated depression of plasma IGFALS likely results, in part, from growth hormone signaling impairment caused by increased SOCS3.
The current TDI for DON, 1 µg/kg bw/d, is based on a 2 year mouse study demonstrating the NOAEL for weight suppression was 1 ppm DON. However, using the NOAEL to establish TDIs and reference doses is limited because it relies only the doses evaluated. Furthermore, the NOAEL does not account for the slope of the dose response curve. The EPA has addressed these issues by applying mathematical models to data to obtain a BMD. In our experiments, the BMD and BMDL were lower for percent reduction in plasma IGFALS than percent reduction in weight suggesting that the former may be an early and sensitive predictor of DON’s effects than weight reduction.
It was notable that the lowest dose for IGFALS decrease was 5 ppm dietary DON at 5 wk, but increased to 10 ppm by wk 9. Although food intake was not measured in the present study, differences in IGFALS levels over time might have been due to compensation of food intake by wk 9. Indeed, Forsell and coworkers (1986) demonstrated during an 8 wk study that mice fed 2 ppm only exhibited decreased food intake up to 6 wk. Furthermore, mice fed high fat diet plus 10 ppm DON only exhibited decreased food intake during the first week out of a 45-day exposure (Kobayashi-Hattori et al. 2011). Another reason for the difference between 5 and 9 wk plasma IGFALS might relate to postnatal growth rate in mice which decreases over time (Lee and Dubos 1968). Since IGFALS levels are in part responsible for growth, differences in plasma concentrations of this protein at 5 and 9 wk might reflect the decreased growth rate of mice.
Critical phases to employing a putative biomarker of effect are: 1) optimizing methods for acquiring and analyzing the biomarker, 2) characterizing the biomarker in human populations, which includes identifying confounding variables and 3) using the biomarker in human epidemiological studies as a predictor of long-term adverse health effects (Bonassi et al. 2001). While the method of acquiring and measuring plasma IGFALS have reliably been demonstrated in the mouse here and previously(Amuzie et al. 2011; Amuzie and Pestka 2010; Amuzie et al. 2009; Kobayashi-Hattori et al. 2011), the correlation between plasma IGFALS and DON’s weight effects in other species has yet to be established. Furthermore, treatment of various cell lines with other trichothecene mycotoxins such as T-2, nivalenol, 3-acetyl deoxynivalenol (ADON), 15-ADON and fusarenon X have resulted in increased proinflammatory cytokines such as IL-6 and TNF-α (Sugita-Konishi and Pestka 2001; Wang et. al. 2012). Therefore, these other toxins could potentially decrease plasma IGFALS via increased SOCS expression resulting from aberrant proinflammatory cytokine release. Addtional experiments are needed to determine the specificity of suppressed plasma IGFALS to DON as compared to other trichothecenes. Finally, it has been recently proposed that another mycotoxin family, the aflatoxins, could also potentially suppress IGF1 and IGFALS thus contributing to human growth stunting (Smith et al., 2012).
To summarize, the data presented suggest that: 1) DON-induced depression of plasma IGFALS correlated with reduced body weight gain, 2) depression of plasma IGFALS preceded significant weight effects occurred and 3) decreased plasma IGFALS might be explainable by at least two mechanisms—anorexia induction and aberrant SOCS3 regulation. Plasma IGFALS might thus be used as a potential biomarker of effect in epidemiological studies, along with biomarkers of exposure, to predict the risk of growth suppression caused by DON in humans. Use of such an approach in the future will require careful consideration of heterogeneity of plasma IGFALS levels within the human population resulting from age, sex, genetic polymorphism, food consumption patterns, socio-economic status, environmental factors, sickness behavior associated by infection and inflammation as well as from exposure to other trichothecenes and mycotoxins.
Acknowledgements
We would like to acknowledge the technical assistance of Melissa Bates, Wenda Wu, Victoria Minton, Haley Dinsmore and Mary Rosner. We thank Felicia Wu for advice on BMD modeling. This study was supported by Public Health Service Grants from the US Department of Agriculture (USDA), under a cooperative project with the US Wheat and Barley Scab Initiative. Any findings, opinions, conclusions, or recommendations expressed in this publication are those of the authors and do not necessarily reflect the views of the USDA.
Abbreviations
- DON
Deoxynivalenol
- DG
DON-glucuronide
- NOAEL
no observed adverse effect level
- SOCS
suppressors of cytokine signaling
- IL-6
interleukin – 6
- TNF-α
tumor necrosis factor - α
- IGFALS
insulin-like growth factor acid-labile subunit
- IGF1
insulin-like growth factor
- SH2
Src homology 2
- JAK/STAT
janus kinase/signal transducer and activator of transcription
- wk
week
- d
day
- ip
intraperitoneal
- RT-PCR
real-time polymerase chain reaction
- ELISA
enzyme-linked immunosorbent assay
- ANOVA
analysis of variance
Footnotes
Publisher's Disclaimer: This is a PDF file of an unedited manuscript that has been accepted for publication. As a service to our customers we are providing this early version of the manuscript. The manuscript will undergo copyediting, typesetting, and review of the resulting proof before it is published in its final citable form. Please note that during the production process errors may be discovered which could affect the content, and all legal disclaimers that apply to the journal pertain.
Conflict of Interest
The authors have declared no conflict of interest.
References
- Al-Regaiey KA, Masternak MM, Bonkowski M, Sun L, Bartke A. Long-lived growth hormone receptor knockout mice: interaction of reduced insulin-like growth factor i/insulin signaling and caloric restriction. Endocrinology. 2005;146:851–860. doi: 10.1210/en.2004-1120. [DOI] [PubMed] [Google Scholar]
- Amuzie CJ, Flannery BM, Ulrich AM, Pestka JJ. Effects of deoxynivalenol consumption on body weight and adiposity in the diet-induced obese mouse. J Toxicol Environ Health A. 2011;74:658–667. doi: 10.1080/15287394.2011.539119. [DOI] [PubMed] [Google Scholar]
- Amuzie CJ, Harkema JR, Pestka JJ. Tissue distribution and proinflammatory cytokine induction by the trichothecene deoxynivalenol in the mouse: comparison of nasal vs. oral exposure. Toxicology. 2008;248:39–44. doi: 10.1016/j.tox.2008.03.005. [DOI] [PubMed] [Google Scholar]
- Amuzie CJ, Pestka JJ. Suppression of insulin-like growth factor acid-labile subunit expression--a novel mechanism for deoxynivalenol-induced growth retardation. Toxicol Sci. 2010;113:412–421. doi: 10.1093/toxsci/kfp225. [DOI] [PMC free article] [PubMed] [Google Scholar]
- Amuzie CJ, Shinozuka J, Pestka JJ. Induction of suppressors of cytokine signaling by the trichothecene deoxynivalenol in the mouse. Toxicol Sci. 2009;111:277–287. doi: 10.1093/toxsci/kfp150. [DOI] [PMC free article] [PubMed] [Google Scholar]
- Arnold DL, McGuire PF, Nera EA, Karpinski KF, Bickis MG, Zawidzka ZZ, Fernie S, Vesonder RF. The toxicity of orally administered deoxynivalenol (vomitoxin) in rats and mice. Food Chem Toxicol. 1986;24:935–941. doi: 10.1016/0278-6915(86)90321-2. [DOI] [PubMed] [Google Scholar]
- Azcona-Olivera JI, Ouyang Y, Murtha J, Chu FS, Pestka JJ. Induction of cytokine mRNAs in mice after oral exposure to the trichothecene vomitoxin (deoxynivalenol): relationship to toxin distribution and protein synthesis inhibition. Toxicol Appl Pharmacol. 1995;133:109–120. doi: 10.1006/taap.1995.1132. [DOI] [PubMed] [Google Scholar]
- Boisclair YR, Wang J, Shi J, Hurst KR, Ooi GT. Role of the suppressor of cytokine signaling-3 in mediating the inhibitory effects of interleukin-1beta on the growth hormone-dependent transcription of the acid-labile subunit gene in liver cells. J Biol Chem. 2000;275:3841–3847. doi: 10.1074/jbc.275.6.3841. [DOI] [PubMed] [Google Scholar]
- Bonassi S, Neri M, Puntoni R. Validation of biomarkers as early predictors of disease. Mutat Res. 2001;480–481:349–358. doi: 10.1016/s0027-5107(01)00194-4. [DOI] [PubMed] [Google Scholar]
- Canady R, Coker R, Egan S, Drska R, Kuiper-Goodman T, Olsen M, Pestka J, Resnick S, Schlatter J. WHO Food Additives Series 47. Geneva: W.H.O.; 2001. Deoxynivalenol. Safety evaluation of certain mycotoxins in food. Fifty-sixth report of the Joint FAO/WHO Expert Committee on Food Additives; pp. 420–555. (Ed.), pp. [Google Scholar]
- Clemmons DR, Underwood LE. Nutritional regulation of IGF-I and IGF binding proteins. Annu Rev Nutr. 1991;11:393–412. doi: 10.1146/annurev.nu.11.070191.002141. [DOI] [PubMed] [Google Scholar]
- Dai J, Baxter RC. Regulation in vivo of the acid-labile subunit of the rat serum insulin-like growth factor-binding protein complex. Endocrinology. 1994;135:2335–2341. doi: 10.1210/endo.135.6.7527331. [DOI] [PubMed] [Google Scholar]
- Dai J, Scott CD, Baxter RC. Regulation of the acid-labile subunit of the insulin-like growth factor complex in cultured rat hepatocytes. Endocrinology. 1994;135:1066–1072. doi: 10.1210/endo.135.3.8070348. [DOI] [PubMed] [Google Scholar]
- Domene HM, Hwa V, Jasper HG, Rosenfeld RG. Acid-labile subunit (ALS) deficiency. Best Pract Res Clin Endocrinol Metab. 2011;25:101–113. doi: 10.1016/j.beem.2010.08.010. [DOI] [PubMed] [Google Scholar]
- Domene HM, Scaglia PA, Jasper HG. Deficiency of the insulin-like growth factor-binding protein acid-labile subunit (ALS) of the circulating ternary complex in children with short stature. Pediatr Endocrinol Rev. 2010;7:339–346. [PubMed] [Google Scholar]
- Dunn SE, Kari FW, French J, Leininger JR, Travlos G, Wilson R, Barrett JC. Dietary restriction reduces insulin-like growth factor I levels, which modulates apoptosis, cell proliferation, and tumor progression in p53-deficient mice. Cancer Res. 1997;57:4667–4672. [PubMed] [Google Scholar]
- Flannery BM, Clark ES, Pestka JJ. Anorexia Induction by the Trichothecene Deoxynivalenol (Vomitoxin) is Mediated by the Release of the Gut Satiety Hormone Peptide YY (PYY) Toxicol Sci. 2012 doi: 10.1093/toxsci/kfs255. 2012 Aug 17. [Epub ahead of print] [DOI] [PMC free article] [PubMed] [Google Scholar]
- Flannery BM, Wu W, Pestka JJ. Characterization of deoxynivalenol-induced anorexia using mouse bioassay. Food Chem Toxicol. 2011;49:1863–1869. doi: 10.1016/j.fct.2011.05.004. [DOI] [PMC free article] [PubMed] [Google Scholar]
- Forsell JH, Witt MF, Tai JH, Jensen R, Pestka JJ. Effects of 8-week exposure of the B6C3F1 mouse to dietary deoxynivalenol (vomitoxin) and zearalenone. Food Chem Toxicol. 1986;24:213–219. doi: 10.1016/0278-6915(86)90231-0. [DOI] [PubMed] [Google Scholar]
- Heath KE, Argente J, Barrios V, Pozo J, Diaz-Gonzalez F, Martos-Moreno GA, Caimari M, Gracia R, Campos-Barros A. Primary acid-labile subunit deficiency due to recessive IGFALS mutations results in postnatal growth deficit associated with low circulating insulin growth factor (IGF)-I, IGF binding protein-3 levels, and hyperinsulinemia. J Clin Endocrinol Metab. 2008;93:1616–1624. doi: 10.1210/jc.2007-2678. [DOI] [PubMed] [Google Scholar]
- Iverson F, Armstrong C, Nera E, Truelove J, Fernie S, Scott P, Stapley R, Hayward S, Gunner S. Chronic feeding study of deoxynivalenol in B6C3F1 male and female mice. Teratog Carcinog Mutagen. 1995;15:283–306. doi: 10.1002/(SICI)1520-6866(1996)15:6<283::AID-TCM5>3.0.CO;2-E. [DOI] [PubMed] [Google Scholar]
- Kobayashi-Hattori K, Amuzie CJ, Flannery BM, Pestka JJ. Body composition and hormonal effects following exposure to mycotoxin deoxynivalenol in the high-fat diet-induced obese mouse. Mol Nutr Food Res. 2011;55:1070–1078. doi: 10.1002/mnfr.201000640. [DOI] [PMC free article] [PubMed] [Google Scholar]
- Lee CJ, Dubos R. Lasting biological effects of early environmental influence. 3. Metabolic responses of mice to neonatal infection with a filterable weight-depressing agent. J Exp Med. 1968;128:753–762. doi: 10.1084/jem.128.4.753. [DOI] [PMC free article] [PubMed] [Google Scholar]
- Lin B, Yen T. The U.S. Grain Consumption Landscape: Who eats grain, in what form, where, and how much? [last accessed 11/29/2012];ERR-50. U.S. Dept. of Agriculture, Econ. Res. Serv. 2007 http://www.ers.usda.gov/media/216648/err50_1_.pdf.
- Livak KJ, Schmittgen TD. Analysis of relative gene expression data using real-time quantitative PCR and the 2(-Delta Delta C(T)) Method. Methods. 2001;25:402–408. doi: 10.1006/meth.2001.1262. [DOI] [PubMed] [Google Scholar]
- Oster MH, Levin N, Fielder PJ, Robinson IC, Baxter RC, Cronin MJ. Developmental differences in the IGF-I system response to severe and chronic calorie malnutrition. Am J Physiol. 1996;270:E646–E653. doi: 10.1152/ajpendo.1996.270.4.E646. [DOI] [PubMed] [Google Scholar]
- Pestka JJ, Islam Z, Amuzie CJ. Immunochemical assessment of deoxynivalenol tissue distribution following oral exposure in the mouse. Toxicol Lett. 2008;178:83–87. doi: 10.1016/j.toxlet.2008.02.005. [DOI] [PMC free article] [PubMed] [Google Scholar]
- Pestka JJ. Deoxynivalenol: mechanisms of action, human exposure, and toxicological relevance. Archives of toxicology. 2010;84:663–679. doi: 10.1007/s00204-010-0579-8. [DOI] [PubMed] [Google Scholar]
- Pieters MN, Freijer J, Baars BJ, Fiolet DC, van Klaveren J, Slob W. Risk assessment of deoxynivalenol in food: concentration limits, exposure and effects. Adv Exp Med Biol. 2002;504:235–248. doi: 10.1007/978-1-4615-0629-4_25. [DOI] [PubMed] [Google Scholar]
- Rawlings JS, Rosler KM, Harrison DA. The JAK/STAT signaling pathway. J Cell Sci. 2004;117:1281–1283. doi: 10.1242/jcs.00963. [DOI] [PubMed] [Google Scholar]
- Rotter BA, Prelusky DB, Pestka JJ. Toxicology of deoxynivalenol (vomitoxin) J Toxicol Environ Health. 1996;48:1–34. doi: 10.1080/009841096161447. [DOI] [PubMed] [Google Scholar]
- Smith LE, Stoltzfus RJ, Prendergast A. Food chain mycotoxin exposure, gut health, and impaired growth: A conceptual framework. Adv Nutr. 2012;3:526–531. doi: 10.3945/an.112.002188. [DOI] [PMC free article] [PubMed] [Google Scholar]
- Sugita-Konishi Y, Pestka JJ. Differential upregulation of TNF-alpha, IL-6, and IL-8 production by deoxynivalenol (vomitoxin) and other 8-ketotrichothecenes in a human macrophage model. J Toxicol Environ Health A. 2001;64:619–636. doi: 10.1080/152873901753246223. [DOI] [PubMed] [Google Scholar]
- Turner PC, Burley VJ, Rothwell JA, White KL, Cade JE, Wild CP. Deoxynivalenol: rationale for development and application of a urinary biomarker. Food Addit Contam Part A Chem Anal Control Expo Risk Assess. 2008a;25:864–871. doi: 10.1080/02652030801895040. [DOI] [PubMed] [Google Scholar]
- Turner PC, Rothwell JA, White KL, Gong Y, Cade JE, Wild CP. Urinary deoxynivalenol is correlated with cereal intake in individuals from the United kingdom. Environ Health Perspect. 2008b;116:21–25. doi: 10.1289/ehp.10663. [DOI] [PMC free article] [PubMed] [Google Scholar]
- Ueki I, Giesy SL, Harvatine KJ, Kim JW, Boisclair YR. The acid-labile subunit is required for full effects of exogenous growth hormone on growth and carbohydrate metabolism. Endocrinology. 2009;150:3145–3152. doi: 10.1210/en.2008-1740. [DOI] [PMC free article] [PubMed] [Google Scholar]
- Ueki I, Ooi GT, Tremblay ML, Hurst KR, Bach LA, Boisclair YR. Inactivation of the acid labile subunit gene in mice results in mild retardation of postnatal growth despite profound disruptions in the circulating insulin-like growth factor system. Proc Natl Acad Sci U S A. 2000;97:6868–6873. doi: 10.1073/pnas.120172697. [DOI] [PMC free article] [PubMed] [Google Scholar]
- Voss KA. A new perspective on deoxynivalenol and growth suppression. Toxicol Sci. 2010;113:281–283. doi: 10.1093/toxsci/kfp287. [DOI] [PubMed] [Google Scholar]
- Wang X, Liu Q, Ihsan A, Huang L, Dai M, Hao H, Cheng G, Liu Z, Wang Y, Yuan Z. JAK/STAT pathway plays a critical role in the proinflammatory gene expression and apoptosis of RAW264.7 cells induced by trichothecenes as DON and T- 2 toxin. Toxicol Sci. 2012;127:412–424. doi: 10.1093/toxsci/kfs106. [DOI] [PubMed] [Google Scholar]


