Abstract
Five isomorphic fluorescent uridine mimics have been subjected to two-photon (2P) excitation analysis to investigate their potential applicability as non-perturbing probes for the single-molecule detection of nucleic acids. We find that small structural differences can cause major changes in the two-photon excitation probability, with the 2P cross sections varying by over one order of magnitude. Two of the probes, both furan-modified uridine analogs, have the highest 2P cross sections (3.8 GM and 7.6 GM) reported for nucleobase analogs, using a conventional Ti:sapphire laser for excitation at 690 nm; they also have the lowest emission quantum yields. In contrast, the analogs with the highest reported quantum yields have the lowest 2P cross sections. The structure-photophysical property relationship presented here is a first step towards the rational design of emissive nucleobase analogs with controlled 2P characteristics. The results demonstrate the potential for major improvements through judicious structural modifications.
Keywords: nucleoside, ribonucleoside, fluorescence, multiphoton, single-molecule
Introduction
Current nucleic acid labeling approaches frequently involve the use of bulky dyes conjugated through long linkers. In contrast, isomorphic emissive nucleobases, which are small non-perturbing yet fluorescent surrogates, minimally impact the overall fold of the native structure, are well localized and can be sensitive to their local environment. As such they have become highly effective in diverse biophysical assays.[1] The ability to detect and analyze fluorescent nucleobase analogs at the single-molecule level would be of enormous benefit for studying the structure, dynamics and interactions of nucleic acids. Unfortunately, the suitability of nucleobases for ultra-sensitive detection is hampered by their low brightness, due to both low molar absorptivity and emission quantum yield, as well as potential photobleaching.[2]
A few studies have investigated the multiphoton excitation of nucleobase analogs as a way to circumvent some of the drawbacks of these molecules as fluorescent labels, although single-molecule detection was not reported.[3] A guanine analog, 6-MI, was found to have a two-photon (2P) cross section of 2.5 GM units (Goeppert-Mayer, 1 GM = 10−50 cm4 s photon−1),[3a] while 6MAP, an adenine analog, had a cross section of 3.4 GM.[3b] We recently reported the 2P excitation of the archetypal 2-aminopurine (2-AP), a highly emissive adenine analog, and the cytosine analog tC.[4] While the 2-AP cross section was only 0.2 GM, the tC cross section was 1.5 GM. Encouragingly, tC appeared to display increased photostability following 2P excitation. However, as with 6MAP,[3b] the brightness of tC was too low to detect single molecules. Single molecule detection following 2P excitation, and with reasonable count rates, has been reported for the dye Coumarin-120.[5] Coumarin-120 has a 2P cross section of 3 GM in aqueous solution, similar to some of the nucleobase analogs mentioned above.[5]
For emissive nucleobase analogs to become viable tools for single-molecule detection, new labels with improved intrinsic photophysics (optimal absorption wavelengths, quantum yield and absorption cross section) must be synthesized. In addition, photobleaching must be minimized (e.g. by using tailored antifade reagents[6]) and the illumination and detection conditions need to be optimized. Herein we address the first of these design parameters, by systematically studying for the first time a series of structurally related isomorphic emissive nucleosides (Fig. 1).
Figure 1.
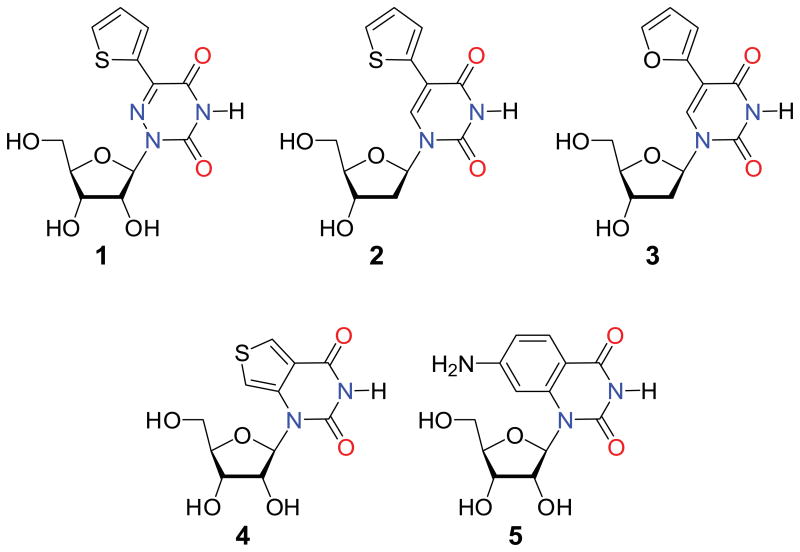
Structures of the modified nucleosides and ribonucleosides studied; 1 - 5-(thiophen-2-yl)-6-aza-uridine, 2 - 5-(thiophen-2-yl)-2′-deoxyuridine, 3 - 5-(furan-2-yl)-2′-deoxyuridine, 4 - thieno[3,4-d]uridine, 5 - 7-amino-1-ribose-quinazoline-2,4(1H,3H)-dione.
Results and Discussion
Retrieving accurate 2P cross sections is a non-trivial task. To avoid systematic errors, the five structures are compared under identical experimental conditions. We find that the five uridine analogs display large variations in 2P cross section, including the highest reported cross sections for nucleobase analogs to date. The cross sections do not appear to be correlated with one-photon (1P) absorption cross sections or emission quantum yield. We find that subtle structural changes can have a profound effect on the photophysics of nucleobases, and indicates their potential as single-molecule labels.
The uridine-based nucleosides and ribonucleosides studied here were chosen as representative examples of isomorphic fluorescent nucleobase analogues (Fig. 1).[1c] The synthesis and ensemble 1P fluorescence spectroscopy of samples 1–4 have all been reported.[1b, 7] Although not described previously, the 2′-deoxy analogue of 5 has been reported.[8] To investigate the potential of the samples to be excited via a multiphoton process, we irradiated them using a Ti:sapphire laser and detected the fluorescence with a fiber-coupled spectrometer. We were also able to measure 1P emission spectra with the same setup by frequency-doubling the laser.
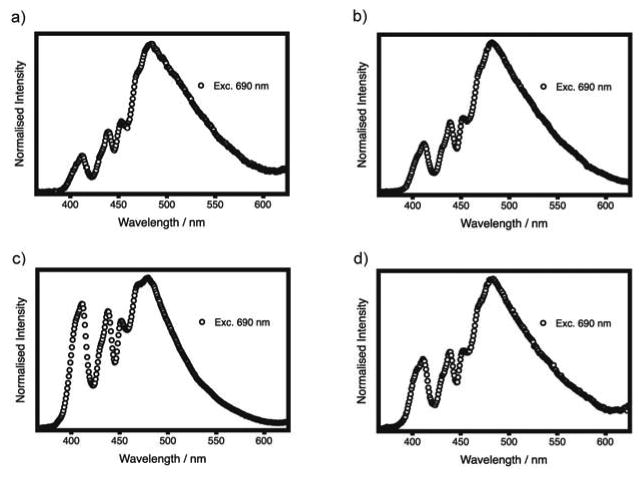
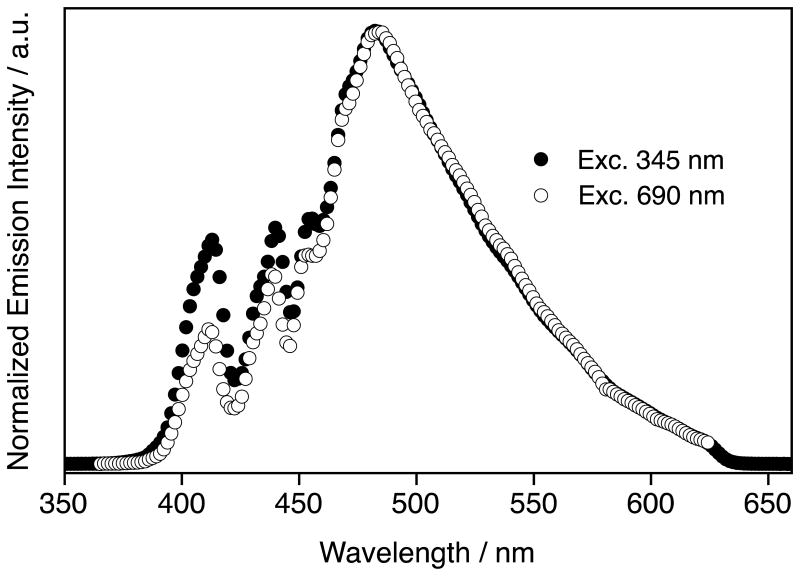
Figure 2 shows the emission spectra of 1 following excitation at either 345 nm or 690 nm. Above an emission wavelength of ca. 460 nm, where the spectral throughput is relatively flat, the emission spectra of 1 for 1P and 2P are identical (Fig. 2). This means the emission is likely originating from the same excited states, which is typical following 2P excitation. The pronounced structure in the emission spectrum at short wavelength is due to the transmission and reflection of the various components in our optical system, particularly the dichroic mirror. The 1P and 2P were recorded with different excitation geometries, which explain the small differences in intensity observed at short wavelength. In contrast, 2P spectra of the samples and the rhodamine B standard were measured under identical conditions with excellent reproducibility. 2P spectra for samples 2–5 are shown in Fig. 3. None of the samples showed any detectable one-photon absorption at 690 or 740 nm.
Figure 2.
Emission spectra of 1 following one-photon (black circles) and two-photon (open circles) excitation at 345 nm and 690 nm, respectively. The distortions at short wavelength are due to the optical setup (see text).
Figure 3.

Emission spectra of sample 2 (a), sample 3 (b), sample 4 (c) and sample 5 (d) following two-photon excitation at 690 nm. The distortions at short wavelength are due to the optical setup (see text).
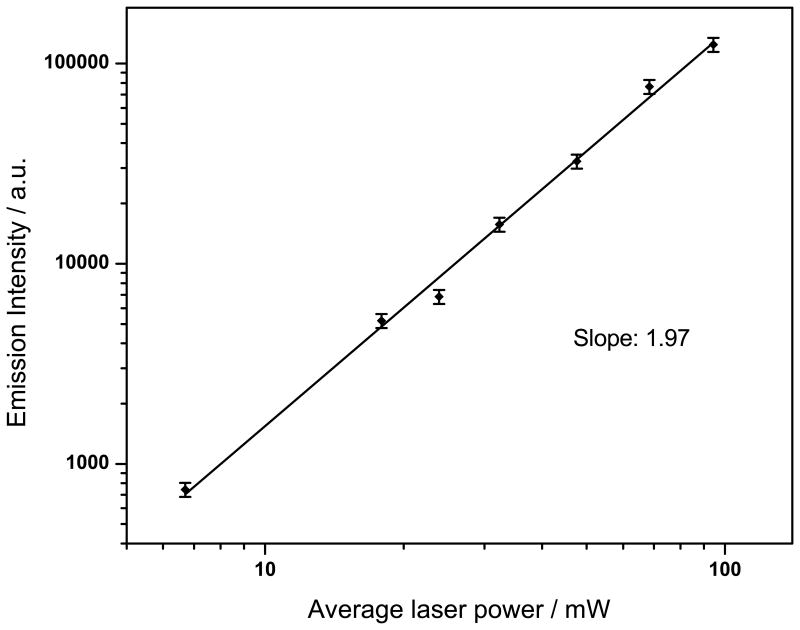
For all samples, we measured the power dependence following non-resonant excitation to confirm the occurrence of a two-photon process. The slope of 1.97 ± 0.01 in the log-log plot for 1, following excitation at 740 nm, confirms a two-photon process (Fig. 4). Log-log plots for all samples had a slope, within experimental error, of 2 at both 690 nm and 740 nm excitation. Table 1 summarizes the photophysical data for 1–5.
Figure 4.
Log-log plot of fluorescence intensity vs. power for 1 following excitation at 740 nm. The solid line shows the best straight line fit to the data (R = 99.5%). Error bars indicate the sample standard deviation.
Table 1.
Selected photophysical properties for nucleosides 1–5.a
| Sample | λmax / nm | ε/104 M−1 cm−1 | λem / nm | σ2 (740 nm) / GM | σ2 (690 nm) / GM | Φ | Φσ2 (690 nm) / GM |
|---|---|---|---|---|---|---|---|
| 1 | 332 | 1.1 | 463 | 0.81 | 3.8 | 0.20 | 0.8 |
| 2 | 314 | 0.9 | 446 | 0.33 | 7.6 | 0.01 | 0.08 |
| 3 | 316 | 1.1 | 434 | 0.18 | 2.1 | 0.03 | 0.06 |
| 4 | 304 | 0.32 | 409 | — | 0.17 | 0.41 | 0.07 |
| 5 | 316 | 1.2 | 363 | 0.34 | 1.8 | 0.039 | 0.07 |
Samples in 0.7% DMSO/water, except sample 2 (690 nm) where 0.2% DMSO/water was used. The extinction coefficients and quantum yields for samples 1-4 have been reported previously;[1b, 7] for 5, the values for the deoxyribose analogue were used.[8] We estimate the accuracy of σ2 to be ± 50%. At least 2 separate measurement of σ2 were made with standard deviation of ca. 10%.
The 2P cross-sections (σ2) following excitation at either 690 nm or 740 nm were corrected for the spectral throughput of the system, which is essential for determining accurate values, particularly due to the differing emission spectra of the five samples. We have also included the peak of the resonant absorption (λmax) and emission wavelengths (λem), the 1P extinction coefficient (ε) and the emission quantum yield (Φ) from previous reports.[1b,7,8] The final column in Table 1 shows the action cross section at 690 nm, which is the product of the 2P cross section (σ2) and the 1P emission quantum yield (Φ). This represents the brightness of the emission, and assumes that the 2P excitation populates the same emissive state (see above). Irradiation times ranged from 5–240 s, and we saw no evidence of photobleaching in our cuvette-based measurement. For example, the photostability of 1 (4 × 10⁻⁵ M) was checked by irradiating a 60 μL solution in a cuvette; after 60 minutes at 740 nm (ca. 100 mW) we observed no change in the spectrum. Photobleaching may still occur under single-molecule excitation conditions, but this was not investigated.
Overall, the results presented in Table 1 show that relatively small changes in the nucleoside structure can cause large changes in the fluorophores' 2P properties, which are not necessarily mirrored in their 1P values. As expected from the 1P absorption maxima, the 2P cross sections are higher following excitation at 690 nm than 740 nm. The cross sections for 690 nm excitation vary 40-fold with values from 0.17 to 7.6 GM. The lowest cross section, for 4, is similar to that measured for the nucleoside analog 2-AP.[4] In contrast, the furan-modified analogs 1 and 2 have the highest 2P cross sections reported to date for nucleobase analogs (3.8 GM and 7.6 GM, respectively). We used a standard Ti:sapphire laser for excitation, which limited us to a short wavelength of 690 nm. Given that the 1P absorbance maxima are from 304–332 nm, it is likely that these cross sections actually represent a lower limit.
In sample 1, a thiophene unit is conjugated to a 6-aza-uridine core; the emission maximum and quantum yield of this nucleoside is sensitive to solvent polarity and acidity.[7a] In samples 2 and 3, a five-membered heterocycle (thiophene or furan, respectively) is conjugated to a 2′-deoxyuridine. These have been shown to be sensitive to their microenvironment and can report on the presence of a DNA abasic site after incorporation into a duplex.[1b] Although the addition of a five-membered heterocycle at the 5-position is structurally benign,[7c] changing the heteroatom from S to O (in samples 2 and 3, respectively) results in a ca. 4-fold increase in 2P cross section for 2 versus 3. This increase is not reflected in the 1P quantum yields, where the value for 3 is 3-fold higher than 2. Differences between S and O analogs have been observed in other nucleobases, and may be due to differences in the ground-state orientation of the electron-rich 5-membered heterocycle with respect to the parent nucleobase, as supported by crystal structure analyses.[7a] In contrast, the effect of replacing uridine with an electron-deficient 1,2,4-triazine core (1 versus 2) on the 2P cross section appears to be small, despite the 20-fold difference in emission quantum yield.[6] Samples, 4 and 5, contain either a 5-membered or 6-membered ring, respectively, fused to a uridine core.
Sample 4 is a highly emissive member of a family of fluorescent ribonucleosides, all derived from the same thieno[3,4-d]uridine core.[7b] Sample 5 has not been previously reported, but the corresponding 2′-deoxyuridine analogue has been shown to detect a G mismatch in duplex DNA.[8] Interestingly, if one looks only at the brightness of the fluorophores, then samples 2–5 have identical values within error. The nucleoside with the highest 2P cross section, 2, has the lowest emission quantum yield of 0.01, whereas the one with the lowest 2P cross section, 4, has the highest emission quantum yield (0.41). Similarly, ribonucleoside 5 has a relatively high cross section (1.8 GM) but low quantum yield (0.039%). Despite the absence of a clear trend, it is apparent that synthesizing a nucleoside that combined the highest values of 2P cross section and emission quantum yield reported here, would give a label with a brightness of 3.1 GM. This would have a 4-fold higher brightness than 1, which has the highest action cross section (0.8 GM) among the samples evaluated in this study. As mentioned, coumarin-120 has a 2P cross section of 3 GM and has been detected at the single-molecule level.[5] The fluorescence quantum yield in water was not reported, but even if we assume a quantum yield of unity, the action cross sections potentially obtainable by the nucleobases described here are similar.
Conclusion
By examining a series of isomorphic fluorescent nucleosides under the same experimental conditions, we have shown that it is possible for nucleobase analogs to be as bright as other dyes that have been detected at the single-molecule level using 2P excitation.[5] More importantly, we have shown that there is a large variability in the 2P cross section values, which does not correlate with other important photophysical properties such as the fluorescence quantum yield. This implies that there is a large parameter space available to optimize and tailor the photophysics of these species via structural modifications.
The photophysical and photochemical properties of fluorescent nucleobases are dependent upon the nature of the lowest excited state (n-π* or π-π*), charge transfer to substituents, conformational flexibility, tautomerization, and access to non-radiative deactivating pathways. Although it is currently very difficult to predict the photophysical properties from the structure alone, we are optimistic that design principles can ultimately emerge. In fact, since we started this work, a number of theoretical studies of the 1P photophysics of fluorescent nucleobases have appeared, including some of the molecules described herein.[9] New probe designs that incorporate structure–photophysics property relationships, and developments in optical instrumentation, such as the use of new ultrafast lasers for multiphoton excitation,[10] could facilitate the realization of fluorescent nucleobase labels that can probe the structure and dynamics of nucleic acids at the single-molecule level.
Experimental Section
General methods
The samples were dissolved in DMSO ((≥99.9%, Sigma) and then diluted in buffer containing 20 mM Tris, 15 mM NaCl, and 1mM MgCl2 at pH 7.2. Final concentrations of DMSO were ca. 0.7% v/v, except where indicated in Table 1. Solutions were filtered through activated charcoal to remove fluorescent impurities. Solvents and buffers were checked for background fluorescence prior to use. All measurements were recorded at 21 ± 1 °C. Ultrapure water was used for buffer preparation (Millipore).
Two-photon measurements
A Mai Tai Ti:sapphire laser (Newport) was used. This produced output pulses of ca. 20 fs at 80 MHz. Reflective neutral density filters attenuated the beam, which passed through a dichroic mirror (650DCLPXR, Chroma) and was focused with a 40× objective (PF, NA = 0.60, Nikon) onto the sample, which was in a 1 cm pathlength cuvette. The incident power was monitored throughout (Uno meter and PH100-Si head, Gentech). The sample fluorescence was collected by the same objective and reflected from the dichroic mirror, passed through a shortpass filter (625SP, Chroma) to remove residual excitation light and detected by a fibre-coupled spectrometer (Ocean Optics QE65000).
The 2P cross sections (σ) were calculated by comparing spectra to those of a standard according to the equation below:
where ϕ is the quantum yield of fluorescence, η is a term that accounts for the wavelength-dependent collection efficiency of the fluorescence, n is the refractive index of the solvent, C is the concentration, F is the integrated fluorescence signal from the recorded spectrum, and P is the excitation power, and S and R refer to sample and reference, respectively. The standard was rhodamine B in methanol (ϕ = 0.7 in methanol;[11] σ =180 GM at 690 nm and σ =68 GM at 740 nm in methanol).[12] To calculate η, we used a NIST-traceable deuterium-halogen calibrated light source (Avalight-DH-BAL-CAL, Avantes) to measure the spectral throughput of the fiber and spectrometer, and we measured the transmission and reflectance of the filter and dichroic, respectively. The 2P cross sections have an estimated accuracy of +/- 50% due to uncertainty in the 2P cross section of the standard and due to errors in the measurement of the spectral throughput, absorption spectra and emission spectra. Acquisition times ranged from 5–240 s.
One-photon measurements
Absorption spectra were measured on a Perkin Elmer Lambda 1050 spectrometer. 1P emission spectra were recorded on the same setup as used above for the power dependence measurements, but using the frequency-doubled output of the Mai Tai laser (Harmonic Generator 9300, Coherent). Prior to doubling, the beam was pulse-picked to 8 MHz (pulseSelect DUAL, APE). Emission spectra were also collected, under magic angle conditions, using a spectrofluorometer (Fluorolog FL3-iHR, HORIBA Jobin Yvon) with a PMT detector (R928P, Hamamatsu) The absorbance of the sample was low (< 0.05) so that inner-filter effects were negligible.
Acknowledgments
We thank Louise Natrajan (Univ. Manchester) for the use of the fibre-coupled spectrometer, and the Photon Science Institute for the loan of the Ti:sapphire laser. We are grateful to the US National Institutes of Health for support (grant GM 069773 to YT).
References
- 1.a) Ward DC, Reich E, Stryer L. J Biol Chem. 1969;244:1228–&. [PubMed] [Google Scholar]; b) Greco NJ, Tor Y. J Am Chem Soc. 2005;127:10784–10785. doi: 10.1021/ja052000a. [DOI] [PubMed] [Google Scholar]; c) Sinkeldam RW, Greco NJ, Tor Y. Chem Rev. 2010;110:2579–2619. doi: 10.1021/cr900301e. [DOI] [PMC free article] [PubMed] [Google Scholar]; d) Wilhelmsson LM. Q Rev Biophys. 2010;43:159–183. doi: 10.1017/S0033583510000090. [DOI] [PubMed] [Google Scholar]
- 2.a) Wennmalm S, Blom H, Wallerman L, Rigler R. Biol Chem. 2001;382:393–397. doi: 10.1515/BC.2001.048. [DOI] [PubMed] [Google Scholar]; b) Sanabia JE, Goldner LS, Lacaze PA, Hawkins ME. J Phys Chem B. 2004;108:15293–15300. [Google Scholar]
- 3.a) Katilius E, Woodbury NW. J Biomed Opt. 2006;11:044004. doi: 10.1117/1.2337521. [DOI] [PubMed] [Google Scholar]; b) Stanley RJ, Hou ZJ, Yang AP, Hawkins ME. J Phys Chem B. 2005;109:3690–3695. doi: 10.1021/jp0455982. [DOI] [PubMed] [Google Scholar]
- 4.Lane RSK, Magennis SW. RSC Adv. 2012;2:11397–11403. [Google Scholar]
- 5.Brand L, Eggeling C, Zander C, Drexhage KH, Seidel CAM. J Phys Chem A. 1997;101:4313–4321. [Google Scholar]
- 6.Cordes T, Maiser A, Steinhauer C, Schermelleh L, Tinnefeld P. PCCP. 2011;13:6699–6709. doi: 10.1039/c0cp01919d. [DOI] [PubMed] [Google Scholar]
- 7.a) Sinkeldam RW, Hopkins PA, Tor Y. ChemPhysChem. 2012;13:3350–3356. doi: 10.1002/cphc.201200375. [DOI] [PMC free article] [PubMed] [Google Scholar]; b) Shin D, Sinkeldam RW, Tor Y. J Am Chem Soc. 2011;133:14912–14915. doi: 10.1021/ja206095a. [DOI] [PMC free article] [PubMed] [Google Scholar]; c) Greco NJ, Tor Y. Tetrahedron. 2007;63:3515–3527. doi: 10.1016/j.tet.2007.01.073. [DOI] [PMC free article] [PubMed] [Google Scholar]
- 8.Xie Y, Maxson T, Tor Y. Org Biomol Chem. 2010;8:5053–5055. doi: 10.1039/c0ob00413h. [DOI] [PMC free article] [PubMed] [Google Scholar]
- 9.a) Gedik M, Brown A. J Photochem Photobiol A. 2013;259:25–32. [Google Scholar]; b) Lee YJ, Jang YH, Kim Y, Hwang S. Bull Korean Chem Soc. 2012;33:4255–4257. [Google Scholar]; c) Pesnot T, Tedaldi LM, Jambrina PG, Rosta E, Wagner GK. Org Biomol Chem. 2013;11:6357–6371. doi: 10.1039/c3ob40485d. [DOI] [PubMed] [Google Scholar]; c) Samanta PK, Manna AK, Pati SK. J Phys Chem B. 2012;116:7618–7626. doi: 10.1021/jp301752k. [DOI] [PubMed] [Google Scholar]
- 10.a) Xi P, Andegeko Y, Weisel LR, Lozovoy VV, Dantus M. Opt Commun. 2008;281:1841–1849. [Google Scholar]; b) Lane RSK, Macpherson AN, Magennis SW. Opt Express. 2012;20:25948–25959. doi: 10.1364/OE.20.025948. [DOI] [PubMed] [Google Scholar]
- 11.Demas JN, Crosby GA. J Phys Chem. 1971;75:991–1024. [Google Scholar]
- 12.Makarov NS, Drobizhev M, Rebane A. Opt Express. 2008;16:4029–4047. doi: 10.1364/oe.16.004029. [DOI] [PubMed] [Google Scholar]


