

Abstract
Background
Substance dependence is associated with impaired decision-making and altered fronto-striatal-limbic activity. Both greater and lesser brain activity have been reported in drug users compared to controls during decision-making. Inconsistent results might be explained by group differences in the temporal profile of the functional magnetic resonance imaging (fMRI) response. While most previous studies model a canonical hemodynamic response, a finite impulse response (FIR) model measures fMRI signal at discrete time points without assuming a temporal profile. We compared brain activity during decision-making and feedback in substance users and controls using two models: a canonical hemodynamic response function (HRF) and a FIR model.
Methods
37 substance-dependent individuals (SDI) and 43 controls performed event-related decision-making during fMRI scanning. Brain activity was compared across group using canonical HRF and FIR models.
Results
Compared to controls, SDI were impaired at decision-making. The canonical HRF model showed that SDI had significantly greater fronto-striatal-limbic activity during decisions and less activity during feedback than controls. The FIR model confirmed greater activity in SDI during decisions. However, lower activity in SDI during feedback corresponded to a lower post-stimulus undershoot of the hemodynamic response.
Conclusions
Greater activity in fronto-striatal-limbic pathways in SDI compared to controls is consistent with prior work, further supporting the hypothesis that abnormalities in these circuits underlie impaired decision-making. We demonstrate for the first time using FIR analysis that lower activity during feedback may simply reflect the tail end of the hemodynamic response to decision, the post-stimulus undershoot, rather than an actual difference in feedback response.
Keywords: Substance dependence, fronto-striatal-limbic system, Iowa Gambling Task, decision-making, finite impulse response (FIR), canonical hemodynamic response function
1. INTRODUCTION
Substance dependent individuals (SDI) display deficits in decision-making. One of the most consistently observed effects is poor performance relative to healthy controls on the Iowa Gambling Task (IGT; Bechara et al., 2001; Grant et al., 2000; Verdejo-Garcia et al., 2006) which was developed to measure decision-making under conditions of uncertainty (Bechara et al., 1994). Drug users preferentially choose options yielding immediate large rewards despite long-term losses over options yielding immediate small rewards that result in long-term gains. In a modified version of the IGT designed to remove potential confounds of search strategy, Thompson et al. (2012) found deficits in avoidance learning in SDI; patients did not learn to avoid losing decks in order to minimize losses. Such results may be clinically relevant because deficits in learning to avoid bad choices may lead to long-term negative outcomes and increase relapse risk.
Poor performance of SDI on the IGT is associated with altered activity in the orbital-frontal cortex (OFC), striatum, and anterior cingulate cortex (ACC), areas important for processing habit learning, reward, and emotional stimuli (Tanabe et al., 2013; Verdejo-Garcia et al., 2006; Wesley et al., 2011). Positron emission tomography (PET) studies have shown that, compared to controls, SDI have greater OFC activity during decision-making (Bolla et al., 2003; Ersche et al., 2005). Given the importance of OFC in reward processing and adaptive learning (Schoenbaum et al., 2009; Tsuchida et al., 2010), the PET studies suggest that portions of the neural systems underlying these processes are altered in SDI.
A drawback of PET imaging is the relatively low temporal resolution as compared to fMRI. It is not possible to separately measure brain activity during the early compared with late phases of decision-making. In contrast, event-related fMRI can model brain activity during different phases of the decision-making process. By inserting a delay between the decision and outcome, investigators have separated neural activity during these phases of the decision-making process (Hyatt et al., 2012; Jia et al., 2011; Nestor et al., 2010; Wesley et al., 2011). One study showed greater striatal activity in drug users compared to controls during the early phase of decision-making, suggesting that drug users had a heightened sensitivity to reward anticipation (Nestor et al., 2010). Others found no group differences in striatal activity during the early phase of decision-making (Bjork et al., 2008; Jia et al., 2011). Results have also been inconsistent for the feedback phase. Compared to controls, drug users showed less activity in striatal-limbic regions during feedback (Hyatt et al., 2012; Nestor et al., 2010; Wesley et al., 2011), suggesting that drug users have less sensitivity to reward outcomes. In contrast, other studies report greater striatal and insula activity in drug (Jia et al., 2011) and alcohol (Bjork et al., 2008) users compared to controls during outcomes, suggesting the opposite possibility, namely that drug users have greater sensitivity to reward outcomes. Clearly, there is a need to reconcile these differences in direction of activity across groups.
One possible source of this inconsistency may be differences in the temporal profile of the fMRI signal between the groups. fMRI models deconvolve the blood-oxygen-level-dependent (BOLD) signal associated with different phases of decision-making. Generally this is accomplished by temporal jitter, in which varying time delays are imposed between the different phases. While jitter improves the ability to resolve the brain response during different phases of the decision-making process, there are some tradeoffs. First, jittering lengthens scan time, which can necessitate reducing the number of trials leading to a decrease in power. Second, since feedback must follow decision there is always an effective correlation between them. Third and perhaps most important, the time allotted to make a decision influences task performance (Cella et al., 2007). For the IGT, longer decision times introduce a bias towards deliberative and explicit cognitive processing when, in fact, implicit emotion-based processes are thought to underlie the sensitivity of the task.
To determine if the temporal profile of neural activity during implicit decision-making differs between SDI and controls, we had both groups perform a modified IGT in the magnet and analyzed the data using a canonical hemodynamic response function (HRF) and a finite impulse response (FIR) model. A FIR model has been used to characterize the onset and shape of the fMRI signal and makes minimal assumptions about the hemodynamic response (Lindquist et al., 2009; Pomares et al., 2013; Reynolds et al., 2006). Here, the two complementary models determine not only whether there are differences in the degree of neural activity (as provided by the HRF approach) but also whether there are differences in the temporal profile of those responses (as provided by the FIR approach). To our knowledge, no study has yet used FIR and HRF models in parallel to examine brain response during implicit decision-making in substance dependence.
2. METHODS
2.1. Subjects
Ninety-nine subjects were recruited for this study. Four substance dependent individuals (SDI) and 15 controls were excluded for head motion exceeding 2 mm. Data are reported on 37 SDI (18M/19F) and 43 controls (23M/20F). SDI with DSM-IV stimulant (cocaine and/or amphetamine) dependence were recruited from a residential treatment program at the University of Colorado Denver Addiction Research and Treatment Service. SDI were abstinent an average of 14 months (mean=14 months, range=2–65, standard deviation=14.33). Control subjects were recruited from the community and excluded for abuse or dependence on any substance other than tobacco. Six controls were dependent on tobacco. Exclusions for all subjects included neurological illness, schizophrenia, bipolar disorder or current major depression (within last 2 months), prior significant head trauma, or IQ ≤ 80. All participants provided written informed consent approved by the Colorado Multiple Institutional Review Board.
2.2. Behavioral measures
2.2.1. Screening Assessment
Drug dependence was assessed in SDI and controls using the computerized Composite International Diagnostic Interview-Substance Abuse Module (CIDI-SAM; Cottler et al., 1989). DSM-IV dependence diagnoses were determined for amphetamine, cocaine, marijuana, alcohol, tobacco, hallucinogens, opioids, inhalants, sedatives, club drugs, and phencyclidine. Controls were excluded if they met criteria for dependence on any substance other than tobacco. The Computerized Diagnostic Interview Schedule – Version IV (C-DIS-IV) was given to exclude schizophrenia, bipolar disorder, and current major depression (<2 months). IQ<80 was exclusionary (Wechsler Abbreviated Scale of Intelligence, 2-subtest version; Psychological Corporation, 1999).
2.2.2. Modified Iowa Gambling Task
Subjects played a modified version of the Iowa Gambling Task during fMRI scanning as described previously (Thompson et al., 2012). Subjects were shown 4 decks of cards and instructed to try to earn as much money as possible. For each trial, the computer selected a deck and subject was asked to “Play” or “Pass” by pressing the appropriate response button. If subject chose “Play” the outcome showed a single positive or negative monetary value, along with the running total. If subject chose “Pass” the running total remained the same. The decks were balanced in their frequency and magnitude of gains and losses. To perform well, subjects had to learn to “play” on the two good decks that resulted in net gain and “pass” on the two bad decks that resulted in net loss over time. Importantly, “Pass” was not the default response if subject failed to respond; rather, a null response was recorded thus enabling us to measure subjects’ decisions to deliberately pass on certain decks. To encourage implicit over explicit decision-making (Cella et al., 2007), the subject was given 2 seconds to make a decision, followed immediately by feedback of 4 seconds duration. Sixty-five 6-second fixation trials were interspersed throughout the task. Each deck was presented 50 times for a total of 200 trials in pseudorandom order. Total task scan time was 26 minutes, divided into 2 runs of 13 minutes each. The task was programmed in E-prime 2.0 (Psychology Software Tools, 2010).
2.3. MRI acquisition
Images were acquired on a 3.0 Tesla scanner (General Electric, Milwaukee, Wisconsin) with an 8-channel head coil. Functional images were acquired with gradient-echo T2* blood-oxygenation-level-dependent (BOLD) contrast, with TR 2000 ms, TE 30 ms, field-of-view 220 mm2, 64 × 64 matrix, 35 slices, 3 mm thick, 1 mm gap. Head motion was minimized using a VacFix head-conforming vacuum cushion (Par Scientific A/S, Odense, Denmark). MR-compatible goggles were used for visual stimuli and responses recorded with a 2 button response device.
2.4. Pre-processing
The first three image volumes from each run were excluded for saturation effects. Data were processed and analyzed using SPM8 (http://www.fil.ion.ucl.ac.uk/spm/software/spm8/). Functional data were realigned to the first volume. Data were excluded for head motion exceeding 2 mm. Realigned images were normalized to Montreal Neurological Institute (MNI) space. Data were smoothed with a 6 mm full-width-half-maximum Gaussian kernel. Final smoothness of the data after pre-processing was 8.2 × 8.4 × 7.9 mm3 and was used in the Monte Carlo simulations to determine cluster-wise corrected threshold levels.
2.5. fMRI data analysis
2.5.1. Canonical hemodynamic response function (HRF)
2.5.1.1. First level model
fMRI data analysis consisted of filtering low frequency noise, correcting for temporal autocorrelation, and convolving the stimulus function with a canonical HRF. Nine conditions were modeled: decision and outcome for each of the four decks plus fixation. We defined the early phase of the decision as the first 2 seconds of the task, when the computer selected a card from a specific deck and subject was required to play or pass. Outcome was defined as the 4 seconds when feedback was given (win, lose, or no change). Two contrast maps were generated for each subject (decision>fixation and outcome>fixation).
2.5.1.2. Second level model
Contrast maps for ‘decision>fixation’ and ‘outcome>fixation’ were brought to the second level and analyzed using region-of-interest and whole brain analyses.
2.5.1.3. Region-of-interest (ROI)
Five anatomically-defined ROIs were evaluated based on literature implicating fronto-striatal-limbic circuits in IGT performance (Li et al., 2010; Tanabe et al., in press; Verdejo-Garcia et al., 2006): ventral striatum (VST), dorsal striatum (DST), orbitofrontal cortex (OFC), insula, and anterior cingulate cortex (ACC). VST and DST were manually drawn (Mawlawi et al., 2001) and separated due to distinct roles of DST in habitual behaviors and VST in reward-related behaviors. We used the automated anatomical labeling atlas (AAL) (Tzourio-Mazoyer et al., 2002) to define OFC, insula, and ACC. ROIs were created using the WFU Pickatlas (Maldjian et al., 2004). Time series data were extracted for each ROI for each subject using Marsbar (Brett et al., 2002 [abstract]) toolbox in SPM8.
2.5.1.4. Whole brain
Whole brain group comparison was conducted using a 2-sample t-test with education as a covariate, as controls were more educated than SDI. Statistical threshold was set at p<0.01 cluster-corrected for multiple comparisons, voxel level p<0.005. Cluster correction corresponded to 35 voxels based on 10,000 Monte Carlo simulations using AlphaSim in AFNI (http://afni.nimh.nih.gov/afni/)
2.5.2. Finite Impulse Response (FIR)
2.5.2.1. First level model
To characterize the temporal profile of the BOLD response, we analyzed the time series data using a FIR model (SPM8 Manual, http://www.fil.ion.ucl.ac.uk/spm/). Unlike the canonical model, FIR does not convolve the stimulus function; rather it uses a linear model to directly estimate the timing and shape of the BOLD response. FIR estimates of the event-related hemodynamic responses were calculated for each subject, with onset being the start of decision. Average signal intensity was estimated at each of 10 time bins with an interval of 2 s (corresponding to the TR) starting with trial onset (time 0). The estimated response was extracted for each time bin in each subject and for each ROI.
2.6. Statistical analyses
2.6.1
Demographic and behavioral data were tested for normality and analyzed with 2-tailed t-tests, ANCOVA with education as the covariant, or chi-square, for continuous and categorical variables, respectively.
2.6.2. ROI
For each ROI, beta-values from the canonical model were compared across group using a 2-sample t-test, adjusting for education. From the FIR model, peak stimulus response (7 second time bin) and post-stimulus undershoot (13 second time bin) were extracted for each subject. The peak and undershoot were correlated using Pearson-R across and within group.
2.6.3. Modified Iowa Gambling Task performance
Based on a prior study showing that avoidance learning (pass on bad decks) distinguished SDI from controls (Thompson et al., 2012), the dependent variable was passes on bad decks. ANCOVA was used to compare passing on bad decks between groups after adjusting for education. To ensure task response times were similar, reaction time was compared across group using 2-sample t-test.
2.6.4. Correlations between fMRI activity and behavior
To determine if brain activity was related to task performance, the fMRI signal from the canonical HRF model was extracted from each ROI and correlated with performance using Pearson’s R.
3. RESULTS
3.1. Demographics
Age was similar for SDI and controls (34.4±8.4 vs. 31.6±9.3 years, p=0.17). SDI had less education than controls (12.8±1.4 vs. 14.7±1.5, p<0.001). Therefore, education was entered as a covariate in all group comparisons.
3.2. Substance dependence
All SDI met DSM-IV dependence criteria for stimulants. Drug characteristics are summarized in Table 1.
Table 1.
Substance dependence diagnoses in SDI (n = 37).
| Number with diagnosis | Percent with diagnosis | |
|---|---|---|
| Stimulants | 37 | 100 |
| Nicotine | 26 | 70 |
| Alcohol | 27 | 73 |
| Opioids | 10 | 27 |
| Cannabis | 15 | 41 |
| Other | 3 | 8 |
3.3. Performance on modified Iowa Gambling Task
3.3.1. Pass on Bad Decks
SDI passed fewer times than controls (SDI=31±14, control=46±21; F[1,78]=6.8, p=0.01) on bad decks (Figure 1).
Figure 1.
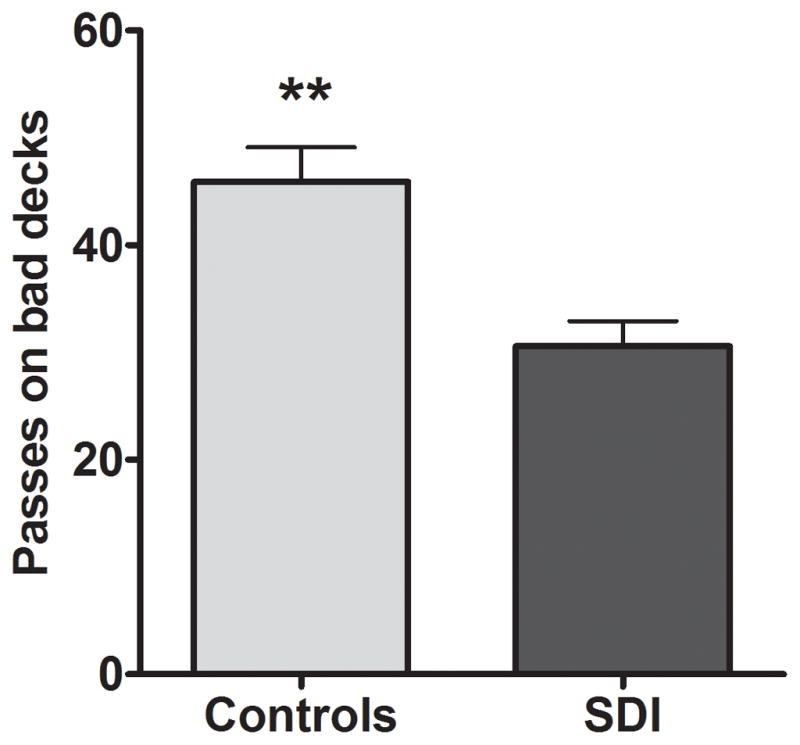
Controls passed more on bad decks than SDI. **Significant at p=0.01.
3.3.2. Reaction times
There was no group difference in reaction time (SDI=891±190 ms, control=830±171 ms; t=1.53, p=0.13).
3.4. Imaging
3.4.1. Canonical hemodynamic response function
3.4.1.1. Decision phase
There was significantly higher activity in SDI compared to controls in all ROIs: DST (t=4.056, p<0.001), VST (t=5.069, p<0.001), insula (t=3.080, p=0.003), ACC (t=3.741, p<0.001), OFC (t=3.978, p<0.001). All five ROIs survived a Bonferroni correction for multiple comparisons.
3.4.1.2. Outcome phase
There was significantly lower activity in SDI compared to controls in all ROIs: DST (t=2.686, p=0.009), VST (t=4.201, p=0.001), insula (t=2.739, p=0.008), ACC (t=2.662, p=0.009), OFC (t=2.969, p=0.004). All five ROIs survived a Bonferroni correction for multiple comparisons.
3.4.1.3. Whole brain analysis
3.4.1.3.1. Decision phase
Figure 2 shows that, compared to controls, SDI had significantly greater activity in several regions including bilateral striatum, right ACC, OFC, insula, thalamus, and midbrain. Table 2 lists significant clusters for the contrast of SDI>control. There were no supra-threshold clusters for the contrast of control>SDI.
Figure 2.
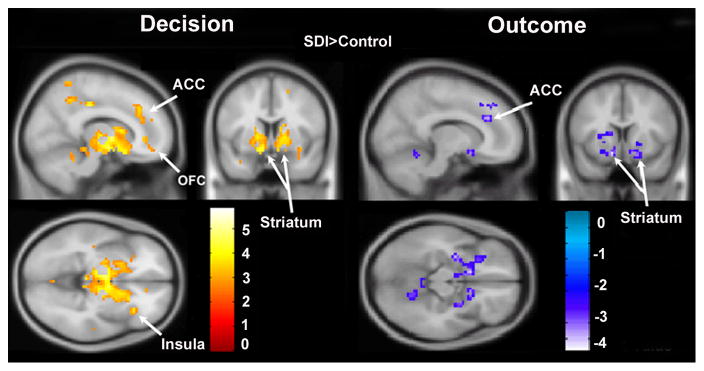
Canonical contrast of SDI>control during decision and outcome. During decisions, SDI show higher activity compared to controls in OFC, striatum, ACC, insula, and thalamus compared to controls. During outcomes, controls show higher activity compared to SDI in striatum and ACC. Maps are thresholded at p<0.01, corrected for multiple comparisons using cluster correction, voxel-level p<0.005.
Table 2.
Significant clusters of group differences using whole brain analyses
| Contrast and Region | Side | MNI coordinates
|
t | Extent | ||
|---|---|---|---|---|---|---|
| x | y | z | ||||
| Decision
|
||||||
| SDI > Controls | ||||||
| Thalamus/striatum | L | −6 | −16 | −2 | 5.84 | 1017 |
| −12 | −10 | −5 | 4.96 | |||
| Pallidum | R | 15 | −1 | 1 | 5.01 | |
| Precuneus | L | −9 | −46 | 49 | 5.42 | 254 |
| −9 | −55 | 52 | 4.88 | |||
| Middle cingulate | R | 6 | −43 | 49 | 4.07 | |
| Anterior cingulate | R | 6 | 35 | 25 | 3.88 | 79 |
| Inferior parietal | R | 60 | −37 | 31 | 4.69 | 78 |
| Cerebellum | 0 | −58 | −23 | 4.28 | 166 | |
| L | −3 | −70 | −35 | 4.14 | ||
| −6 | −43 | −14 | 3.96 | |||
| Superior parietal | R | 24 | −64 | 55 | 4.26 | 37 |
| 30 | −70 | 46 | 3.74 | |||
| Middle frontal gyrus | R | 39 | 38 | 28 | 4.19 | 49 |
| 36 | 41 | 37 | 4.16 | |||
| Superior temporal | R | 51 | −19 | 4 | 4.12 | 46 |
| Postcentral | R | 54 | −22 | 13 | 3.07 | |
| Medial superior frontal | L | 0 | 38 | 37 | 3.16 | 79 |
| Medial frontal | R | 9 | 47 | 22 | 2.98 | |
| Cuneus | L | −18 | −73 | 10 | 3.69 | 44 |
| Inferior orbital frontal | R | 33 | 26 | −8 | 3.69 | 39 |
| Insula | R | 39 | 20 | 7 | 3.18 | |
| Controls >SDI | ||||||
| No regions | ||||||
|
| ||||||
| Outcome
|
||||||
| Controls > SDI | ||||||
| Supramarginal gyrus | R | 57 | −58 | 34 | 4.56 | 37 |
| Angular gyrus | R | 51 | −64 | 43 | 2.86 | |
| Post central gyrus | L | −57 | −16 | 22 | 4.44 | 43 |
| Ventral striatum | L | −30 | −7 | −11 | 4.20 | 151 |
| L | −12 | 8 | −14 | 3.96 | ||
| R | 12 | 11 | −14 | 3.51 | 81 | |
| Putamen | R | 27 | 5 | −8 | 3.10 | |
| Anterior cingulate | R | 6 | 35 | 28 | 3.79 | 80 |
| Middle cingulate | R | 6 | 26 | 40 | 3.52 | |
| Amygdala | R | 27 | −1 | −17 | 3.56 | 81 |
| Brain stem | L | −6 | −4 | −5 | 3.80 | 151 |
| SDI > controls | ||||||
| No regions | ||||||
MNI=Montreal Neurological Institute
3.4.1.3.2. Outcome phase
Figure 2 shows that compared to controls, SDI had significantly less activity in the bilateral striatum, and right ACC. Table 2 lists significant clusters for the contrast of control>SDI. There were no supra-threshold clusters for the contrast of SDI>control.
3.4.2. Finite Impulse Response
Figure 3 illustrates the time course of the hemodynamic response in the five ROIs. As expected, the peak signal occurred ~5–7 seconds after stimulus presentation. The amplitude of the peak was significantly larger in SDI than controls in all ROIs except the OFC, possibly due to FIR having lower statistical power than the canonical model. A post-stimulus undershoot was observed 10–19 seconds after stimulus. The amplitude of the undershoot was lower in SDI compared to controls although this only reached significance in the striatum. There was no temporal shift in the hemodynamic profile across group. There was a strong correlation between the peak height and undershoot across group (r=−0.526, p<0.001) and within group (Controls, r=−0.424, p=0.005; SDI, r=−0.436, p=0.007) in the ventral striatum. Figure 4 shows peak and undershoot fMRI signal within individuals in the ventral striatum.
Figure 3.

Finite impulse response (FIR) time series for decision and outcome in five ROIs. Arrows show onset of decision and outcome stimulus functions. Asterisks indicate significant group differences at the time points indicated: *p<0.05, **p<0.01, ***p<0.001.
Figure 4.

Peak fMRI signal response at 7 seconds negatively correlates with the post-stimulus undershoot at 13 seconds in the ventral striatum for controls and SDI.
3.4.3. Correlation between fMRI signal and decision-making performance
Across group, there was a correlation between passing on bad decks and BOLD activity in the ventral striatum (r=−0.257, p=0.02, uncorrected) and OFC (r=−0.253, p=0.02, uncorrected). There were no correlations in the DST, ACC, or insula.
4. DISCUSSION
Compared to controls, substance dependent individuals (SDI) demonstrated worse decision-making, manifested as an impaired ability to avoid negative outcomes on a modified Iowa Gambling Task. SDI demonstrated greater fronto-striatal-limbic brain activity during the decision phase of the task and lower frontal-striatal activity during the outcome phase of the task. The opposing direction of group differences in brain activity led us to implement a finite impulse response (FIR) analysis which revealed that the lower activity in SDI compared to controls during outcome likely reflected a lower post-stimulus undershoot.
During the early phase of decision-making, greater activity in SDI relative to controls was observed in the OFC, striatum, ACC and insula, consistent with previous studies (Bolla et al., 2003; Ersche et al., 2005; Nestor et al., 2010). We extend these prior fMRI study findings in a larger sample of primarily stimulant-dependent individuals with unusually long (14 months) abstinence. One interpretation of the increased activity is that habitual processes mediated by the striatum and emotional information mediated by the limbic system influence decision-making to a greater extent in SDI than controls. In the modified IGT, when given the choice to play or pass on a deck, the pre-potent response is to play. To perform well, however, individuals must learn to pass on bad decks. SDI perform worse than controls because they persist in playing on bad decks. An overactive striatum that favors habitual over adaptive responses could put SDI at risk of relapse due to persistence of drug-related decisions (Volkow et al., 2006). In support of this, higher BOLD signal in the ventral striatum was associated with persistent playing on bad decks. The greater OFC activity may be related to impaired ability to focus while making a decision. For example, Bolla et al. (2003) suggested that cocaine abusers may over-activate the OFC during decision-making to compensate for inefficient brain function. Given that ventral striatum is involved in reward anticipation, a third explanation is that greater activity in SDI than controls reflects hypersensitivity to reward anticipation (Knutson et al., 2003, 2001). Childress and colleagues found that cocaine users had greater striatal-limbic activity when exposed to cocaine as compared to neutral cues suggesting drug users were hypersensitive to drug cues (Childress et al., 2008).
During the outcome phase of decision-making, SDI had lower activity than controls in all five ROIs, consistent with previous studies (Hyatt et al., 2012; Jia et al., 2011; Nestor et al., 2010; Wesley et al., 2011). It has been suggested that lower activity in these regions reflects lower sensitivity to negative feedback in drug users. This is supported by computational models showing that, compared to controls, SDI have lower loss sensitivity on the IGT or its variants (Stout et al., 2004; Tanabe et al., 2013). Due to the brief fixed period between decision and outcome in our task, it is difficult to interpret our results based solely on a canonical HRF model. Separating the BOLD signal associated with decision from that of outcome has been addressed by inserting temporal delays or jitter (Bjork et al., 2008; Hyatt et al., 2012; Jia et al., 2011; Nestor et al., 2010). One study using jitter found, like us, that controls had greater activity than SDI during outcomes (Hyatt et al., 2012), while others found the opposite or mixed results (Bjork et al., 2008; Jia et al., 2011; Nestor et al., 2010). These conflicting results suggest that jitter may not resolve the temporal issue. Moreover, jitter and longer decision times could change the underlying cognitive processes. For example, when given unlimited time to make a decision on the IGT, subjects performed better than when forced to respond within 2 seconds suggesting that the IGT is “cognitively penetrable” (Cella et al., 2007). Longer decision times allow individuals to use higher order “explicit” cognitive processes, e.g., a conscious knowledge of strategy. To bias our task toward “implicit” decision-making as opposed to conscious strategy, we limited the decision time.
The opposing direction of group differences during decision and outcome led us to complement the canonical HRF with a finite impulse response (FIR) model. The canonical model has greater statistical power (Henson, 2003) than FIR, decreasing the likelihood of Type II errors, but is biased if the assumptions of the hemodynamic response are not met. The canonical model does not take into account possible differences in onset latency and duration of peak between subjects or brain areas.
The FIR model revealed three important findings. First, consistent with the canonical HRF model, it confirmed greater activity in frontal-striatal-limbic pathways in SDI compared to controls during the decision phase of the task. Second, there was no group difference in latency that could explain lower activity in SDI compared to controls during the outcome phase. Third, FIR analysis suggested that the “lower” activity in SDI compared to controls during outcome may reflect differences in the post-stimulus undershoot. The post-stimulus undershoot, a well-documented phenomenon, is a dip in the BOLD signal that occurs after the peak response, before the signal returns back to baseline (van Zijl et al., 2012; Zong and Huang, 2011). The depth of the post-stimulus undershoot correlates strongly with the height of the peak response (Boynton et al., 1996; Zong and Huang, 2011) consistent with our results. The mechanism of the undershoot is debated, but likely a result of a sustained increase in high oxygen consumption after the stimulus has subsided (van Zijl et al., 2012). Vascular compliance also contributes to the undershoot (Hua et al., 2011; Zong and Huang, 2011) and may be important in our study since cocaine and amphetamine have known vasoactive properties (Chen et al., 2011; Gottschalk and Kosten, 2002). Recent work also suggests that the undershoot reflects inhibitory neural activity (Mullinger et al., 2013). Thus, the mechanism for the larger undershoot in drug users requires further investigation. Without the FIR analysis, one might interpret the findings as evidence that controls more strongly engage frontal-striatal brain circuits during outcome processing compared to SDI. Though we cannot exclude that possibility, the most parsimonious explanation is that the lower activity in drug users reflects a larger post-stimulus undershoot which is a correlate of higher peak response in SDI.
There are several strengths of this study. It is the first study to use a FIR approach to examine the hemodynamic brain response profile during decision-making in substance users. The results highlight a role of temporally unbiased fMRI models for cognitive tasks that are temporally constrained. Other strengths include a relatively large sample size and that few previous studies of brain activity during decision-making have been conducted in SDI after protracted abstinence (Ersche et al., 2005). Finding differences after more than a year of abstinence indicates that differences are not related to lingering effects of drugs.
Limitations of the study include an inability to directly compare the current results to the Iowa Gambling Task given differences in the payout structure and schedule. Nonetheless the modified version has been shown to be sensitive to negative reinforcement learning deficits (Thompson et al., 2012) and is replicated in a new cohort of SDI described here. It is not possible to determine whether brain activity differences preceded or resulted from drugs but our results suggest that neural activity differences are long-lasting.
In conclusion, SDI showed impaired decision-making associated with greater fronto-striatal-limbic activity compared to controls, possibly suggesting that drug users expend more mental effort or are less able to modulate habitual responding. A temporally unbiased FIR model confirmed greater activity in SDI during decisions, while demonstrating that lower activity during outcomes corresponded to a lower post-stimulus undershoot. Future studies may benefit from FIR analyses in the interpretation of fMRI results based on the canonical hemodynamic model.
Acknowledgments
Role of funding source
Funding for this study was provided by the National Institute of Drug Abuse (NIDA) grants DA024104 (JT) and DA027748 (JT); NIDA had no further role in study design; in the collection, analysis and interpretation of data; in the writing of the report; or in the decision to submit the paper for publication.
The authors would like to acknowledge the staff at Addiction Research Treatment Services (ARTS) and Debra Singel, RT.
Footnotes
Contributors
Yamamoto: design, analysis, data interpretation, manuscript; Reynolds: design, analysis, data interpretation, manuscript; Krmpotich: design, analysis, data interpretation, manuscript; Banich: data interpretation, manuscript; Thompson: data interpretation, manuscript; Tanabe: design, analysis, data interpretation, manuscript. All authors contributed to and have approved the final manuscript.
Conflict of Interest
The authors report no conflicts of interest.
Publisher's Disclaimer: This is a PDF file of an unedited manuscript that has been accepted for publication. As a service to our customers we are providing this early version of the manuscript. The manuscript will undergo copyediting, typesetting, and review of the resulting proof before it is published in its final citable form. Please note that during the production process errors may be discovered which could affect the content, and all legal disclaimers that apply to the journal pertain.
References
- Bechara A, Damasio AR, Damasio H, Anderson SW. Insensitivity to future consequences following damage to human prefrontal cortex. Cognition. 1994;50:7–15. doi: 10.1016/0010-0277(94)90018-3. [DOI] [PubMed] [Google Scholar]
- Bechara A, Dolan S, Denburg N, Hindes A, Anderson SW, Nathan PE. Decision-making deficits, linked to a dysfunctional ventromedial prefrontal cortex, revealed in alcohol and stimulant abusers. Neuropsychologia. 2001;39:376–389. doi: 10.1016/s0028-3932(00)00136-6. [DOI] [PubMed] [Google Scholar]
- Bjork JM, Momenan R, Smith AR, Hommer DW. Reduced posterior mesofrontal cortex activation by risky rewards in substance-dependent patients. Drug Alcohol Depend. 2008;95:115–128. doi: 10.1016/j.drugalcdep.2007.12.014. [DOI] [PMC free article] [PubMed] [Google Scholar]
- Bolla K, Eldreth D, London E, Kiehl K, Mouratidis M, Contoreggi C, Matochik J, Kurian V, Cadet J, Kimes A, Funderburk F, Ernst M. Orbitofrontal cortex dysfunction in abstinent cocaine abusers performing a decision-making task. NeuroImage. 2003;19:1085–1094. doi: 10.1016/s1053-8119(03)00113-7. [DOI] [PMC free article] [PubMed] [Google Scholar]
- Boynton GM, Engel SA, Glover GH, Heeger DJ. Linear systems analysis of functional magnetic resonance imaging in human V1. J Neurosci. 1996;16:4207–4221. doi: 10.1523/JNEUROSCI.16-13-04207.1996. [DOI] [PMC free article] [PubMed] [Google Scholar]
- Brett M, Anton J-L, Valabregue R, Poline J-B. Region of Interest Analysis Using an SPM Toolbox [abstract]. Presented at the 8th International Conference on Functional Mapping of the Human Brain; June 2–6, 2002. Sendai, Japan; 2002. Available on CD-ROM in NeuroImage. [Google Scholar]
- Cella M, Dymond S, Cooper A, Turnbull O. Effects of decision-phase time constraints on emotion-based learning in the Iowa Gambling Task. Brain Cogn. 2007;64:164–169. doi: 10.1016/j.bandc.2007.02.003. [DOI] [PubMed] [Google Scholar]
- Chen YI, Famous K, Xu H, Choi JK, Mandeville JB, Schmidt HD, Pierce RC, Jenkins BG. Cocaine self-administration leads to alterations in temporal responses to cocaine challenge in limbic and motor circuitry. Eur J Neurosci. 2011;34:800–815. doi: 10.1111/j.1460-9568.2011.07806.x. [DOI] [PMC free article] [PubMed] [Google Scholar]
- Childress AR, Ehrman RN, Wang Z, Li Y, Sciortino N, Hakun J, Jens W, Suh J, Listerud J, Marquez K, Franklin T, Langleben D, Detre J, O’Brien CP. Prelude to passion: limbic activation by “unseen” drug and sexual cues. PLoS ONE. 2008;3:e1506. doi: 10.1371/journal.pone.0001506. [DOI] [PMC free article] [PubMed] [Google Scholar]
- Cottler LB, Robins LN, Helzer JE. The reliability of the CIDI-SAM: a comprehensive substance abuse interview. Br J Addict. 1989;84:801–814. doi: 10.1111/j.1360-0443.1989.tb03060.x. [DOI] [PubMed] [Google Scholar]
- Ersche KD, Fletcher PC, Lewis SJG, Clark L, Stocks-Gee G, London M, Deakin JB, Robbins TW, Sahakian BJ. Abnormal frontal activations related to decision-making in current and former amphetamine and opiate dependent individuals. Psychopharmacology (Berl) 2005;180:612–623. doi: 10.1007/s00213-005-2205-7. [DOI] [PMC free article] [PubMed] [Google Scholar]
- Gottschalk P, Kosten TR. Cerebral perfusion defects in combined cocaine and alcohol dependence. Drug Alcohol Depend. 2002;68:95–104. doi: 10.1016/s0376-8716(02)00109-6. [DOI] [PubMed] [Google Scholar]
- Grant S, Contoreggi C, London ED. Drug abusers show impaired performance in a laboratory test of decision making. Neuropsychologia. 2000;38:1180–1187. doi: 10.1016/s0028-3932(99)00158-x. [DOI] [PubMed] [Google Scholar]
- Henson RN. Analysis of fMRI time series. In: Frackowiak RSJ, Friston KJ, Frith C, Dolan R, Friston KJ, Price CJ, Zeki S, Ashburner J, Penny WD, editors. Human Brain Function. Academic Press; New York: 2003. [Google Scholar]
- Hua J, Stevens RD, Huang AJ, Pekar JJ, van Zijl PC. Physiological origin for the BOLD poststimulus undershoot in human brain: vascular compliance versus oxygen metabolism. J Cereb Blood Flow Metab. 2011;31:1599–1611. doi: 10.1038/jcbfm.2011.35. [DOI] [PMC free article] [PubMed] [Google Scholar]
- Hyatt CJ, Assaf M, Muska CE, Rosen RI, Thomas AD, Johnson MR, Hylton JL, Andrews MM, Reynolds BA, Krystal JH, Potenza MN, Pearlson GD. Reward-related dorsal striatal activity differences between former and current cocaine dependent individuals during an interactive competitive game. PLoS ONE. 2012;7:e34917. doi: 10.1371/journal.pone.0034917. [DOI] [PMC free article] [PubMed] [Google Scholar]
- Jia Z, Worhunsky PD, Carroll KM, Rounsaville BJ, Stevens MC, Pearlson GD, Potenza MN. An initial study of neural responses to monetary incentives as related to treatment outcome in cocaine dependence. Biol Psychiatry. 2011;70:553–560. doi: 10.1016/j.biopsych.2011.05.008. [DOI] [PMC free article] [PubMed] [Google Scholar]
- Knutson B1, Fong G, Adams C, Varner J, Hommer D. Dissociation of reward anticipation and outcome with event-related fMRI. [Miscellaneous Article] Neuroreport. 2001 Dec 4;12:3683–3687. doi: 10.1097/00001756-200112040-00016. 2001. [DOI] [PubMed] [Google Scholar]
- Knutson B, Fong GW, Bennett SM, Adams CM, Hommer D. A region of mesial prefrontal cortex tracks monetarily rewarding outcomes: characterization with rapid event-related fMRI. NeuroImage. 2003;18:263–272. doi: 10.1016/s1053-8119(02)00057-5. [DOI] [PubMed] [Google Scholar]
- Li X, Lu ZL, D’Argembeau A, Ng M, Bechara A. The Iowa Gambling Task in fMRI images. Hum Brain Mapp. 2010;31:410–423. doi: 10.1002/hbm.20875. [DOI] [PMC free article] [PubMed] [Google Scholar]
- Lindquist MA, Meng Loh J, Atlas LY, Wager TD. Modeling the hemodynamic response function in fMRI: efficiency, bias and mis-modeling. NeuroImage. 2009;45:S187–S198. doi: 10.1016/j.neuroimage.2008.10.065. [DOI] [PMC free article] [PubMed] [Google Scholar]
- Maldjian JA, Laurienti PJ, Burdette JH. Precentral gyrus discrepancy in electronic versions of the Talairach atlas. NeuroImage. 2004;21:450–455. doi: 10.1016/j.neuroimage.2003.09.032. [DOI] [PubMed] [Google Scholar]
- Mullinger KJ, Mayhew SD, Bagshaw AP, Bowtell R, Francis ST. Poststimulus undershoots in cerebral blood flow and BOLD fMRI responses are modulated by poststimulus neuronal activity. Proc Natl Acad Sci. 2013 doi: 10.1073/pnas.1221287110. 201221287. [DOI] [PMC free article] [PubMed] [Google Scholar]
- Nestor L, Hester R, Garavan H. Increased ventral striatal BOLD activity during non-drug reward anticipation in cannabis users. NeuroImage. 2010;49:1133–1143. doi: 10.1016/j.neuroimage.2009.07.022. [DOI] [PMC free article] [PubMed] [Google Scholar]
- Pomares FB, Faillenot I, Barral FG, Peyron R. The “where” and the “when” of the BOLD response to pain in the insular cortex. Discussion on amplitudes and latencies. NeuroImage. 2013;64:466–475. doi: 10.1016/j.neuroimage.2012.09.038. [DOI] [PubMed] [Google Scholar]
- Reynolds JR, McDermott KB, Braver TS. A direct comparison of anterior prefrontal cortex involvement in episodic retrieval and integration. Cereb Cortex. 2006;16:519–528. doi: 10.1093/cercor/bhi131. [DOI] [PubMed] [Google Scholar]
- Schoenbaum G, Roesch MR, Stalnaker TA, Takahashi YK. A new perspective on the role of the orbitofrontal cortex in adaptive behaviour. Nat Rev Neurosci. 2009;10:885–892. doi: 10.1038/nrn2753. [DOI] [PMC free article] [PubMed] [Google Scholar]
- Stout JC, Busemeyer JR, Lin A, Grant SJ, Bonson KR. Cognitive modeling analysis of decision-making processes in cocaine abusers. Psychol Bull Rev. 2004;11:742–747. doi: 10.3758/bf03196629. [DOI] [PubMed] [Google Scholar]
- Tanabe J, Reynolds J, Krmpotich T, Claus E, Thompson L, Du YP, Banich M. Reduced neural tracking of prediction error in substance dependent individuals. Am J Psychiatry. doi: 10.1176/appi.ajp.2013.12091257. in press. in press. [DOI] [PMC free article] [PubMed] [Google Scholar]
- Tanabe J, Reynolds J, Krmpotich T, Claus E, Thompson LL, Du YP, Banich MT. Reduced neural tracking of prediction error in substance-dependent individuals. Am J Psychiatry. 2013;170:1356–1363. doi: 10.1176/appi.ajp.2013.12091257. [DOI] [PMC free article] [PubMed] [Google Scholar]
- Thompson LL, Claus ED, Mikulich-Gilbertson SK, Banich MT, Crowley T, Krmpotich T, Miller D, Tanabe J. Negative reinforcement learning is affected in substance dependence. Drug Alcohol Depend. 2012;123:84–90. doi: 10.1016/j.drugalcdep.2011.10.017. [DOI] [PMC free article] [PubMed] [Google Scholar]
- Tsuchida A, Doll BB, Fellows LK. Beyond reversal: a critical role for human orbitofrontal cortex in flexible learning from probabilistic feedback. J Neurosci. 2010;30:16868–16875. doi: 10.1523/JNEUROSCI.1958-10.2010. [DOI] [PMC free article] [PubMed] [Google Scholar]
- Tzourio-Mazoyer N, Landeau B, Papathanassiou D, Crivello F, Etard O, Delcroix N, Mazoyer B, Joliot M. Automated anatomical labeling of activations in SPM using a macroscopic anatomical parcellation of the MNI MRI single-subject brain. NeuroImage. 2002;15:273–289. doi: 10.1006/nimg.2001.0978. [DOI] [PubMed] [Google Scholar]
- Van Zijl PCM, Hua J, Lu H. The BOLD post-stimulus undershoot, one of the most debated issues in fMRI. NeuroImage. 2012;62:1092–1102. doi: 10.1016/j.neuroimage.2012.01.029. [DOI] [PMC free article] [PubMed] [Google Scholar]
- Verdejo-Garcia A, Perez-Garcia M, Bechara A. Emotion, decision-making and substance dependence: a somatic-marker model of addiction. Curr Neuropharmacol. 2006;4:17–31. doi: 10.2174/157015906775203057. [DOI] [PMC free article] [PubMed] [Google Scholar]
- Volkow ND, Wang GJ, Telang F, Fowler JS, Logan J, Childress AR, Jayne M, Ma Y, Wong C. Cocaine cues and dopamine in dorsal striatum: mechanism of craving in cocaine addiction. J Neurosci. 2006;26:6583–6588. doi: 10.1523/JNEUROSCI.1544-06.2006. [DOI] [PMC free article] [PubMed] [Google Scholar]
- Wesley MJ, Hanlon CA, Porrino LJ. Poor decision-making by chronic marijuana users is associated with decreased functional responsiveness to negative consequences. Psychiatry Res Neuroimaging. 2011;191:51–59. doi: 10.1016/j.pscychresns.2010.10.002. [DOI] [PMC free article] [PubMed] [Google Scholar]
- Zong X, Huang J. Linear coupling of undershoot with BOLD response in ER-fMRI and nonlinear BOLD response in rapid-presentation ER-fMRI. NeuroImage. 2011;57:391–402. doi: 10.1016/j.neuroimage.2011.04.067. [DOI] [PMC free article] [PubMed] [Google Scholar]