

Abstract
Purpose
To determine whether presenting distance visual acuity is related to subsequent academic school performance in Singaporean children between 9 to 10 years of age.
Methods
Singapore children (n = 1143 children) were examined during their visits at ages 9 to 10 years (grades 3 to 4) as part of the Singapore Cohort Study of the Risk Factors for Myopia (SCORM) longitudinal study. Each child underwent an annual comprehensive eye examination, including the assessment of presenting logarithm of the minimum angle of resolution (LogMAR) distance visual acuity (VA). The individual marks of a nation-wide standard examination in grade 4 were used as the outcome measure for academic school performance. Children with any known eye disease, (such as media opacities) were excluded from the analysis.
Results
The mean presenting distance VA of the better eye was 0.10 and 0.08 when the children were in grades 3 and 4, respectively. There was a statistically significant difference for mean presenting VA with 9 and 10 year old boys scoring better (0.08 and 0.07) compared to girls (0.12 and 0.09) for the same ages, (p = 0.001 and p = 0.007), respectively. After adjusting for gender, ethnicity, school, reading, intelligence quotient and father’s education, no significant relationships were found between average examination marks at the end of grade 4 and presenting VA obtained (better eye and worst eye) in grade 3 (p = 0.38 and p = 0.98) and 4 (p = 0.27 and p = 0.16).
Conclusion
In our sample of Singaporean children without ocular disease, distance VA did not play a significant role in predicting academic school performance.
Keywords: Visual acuity, Vision, Academic, Refractive error
IntroductIon
The behavioral and medical risk factors associated with academic school performance in children have serious implications in the education sector, public health system and parenthood. On the one hand, behavioral studies have collectively identified demographic risk factors that contribute to a child’s academic school performance, namely socio-economic status, ethnicity and educational background.1–3 On the other hand, a diverse range of medical factors, including visual function parameters also play a leading role in predicting a child’s performance in school. For instance, a study by Maples4 suggested that vision-related risk factors tend to be better predictors of academic performance compared to that of socio-economic status and race.4
Reduced visual acuity (VA) is typically indicative of uncorrected or under-corrected refractive error, particularly myopia in school-aged children.5 Uncorrected refractive error is one of the leading causes of vision impairment.6 For this reason, the World Health Organization (WHO) has grouped refractive error as one of its main priorities.7 Our aim is to determine whether presenting distance VA affects academic school performance in a large, longitudinal study of young Singaporean children.
MATERIALS AND METHODS
Study Population
We report the findings of the eye examinations performed in children at 9 and 10 years of age (grades 3 and 4) (n = 1143) (Table 1). As part of the Singapore Cohort Study of Risk Factors for Myopia (SCORM) in 1999 and 2001, children in grades 1 to 3 were recruited at baseline and annual examinations performed. Eye examinations in grades 3 and 4 were included in this study. The details of the SCORM study methodology have been published elsewhere.8–10 Moreover, children with any known serious medical conditions (eg, heart disease and syndromic myopia), or eye disease (eg, media opacities) were excluded. The SCORM study was approved by the Singapore Eye Research Institute (SERI) Ethics Committee, and the testing protocol adhered to the tenets of the Declaration of Helsinki. Informed written consent was obtained by all parents after the nature of the study was explained.
TABLE 1.
Baseline characteristics for children included in the study versus those excluded
| Variables | Excluded (N = 836) | Included (N = 1143) |
|---|---|---|
| Race (n, %) | ||
| Chinese | 629 (75.24) | 850 (74.37) |
| Malay | 132 (15.79) | 217 (18.99) |
| Other | 75 (8.97) | 76 (6.65) |
| Gender (n, %) | ||
| Male | 423 (50.6) | 578 (50.57) |
| Female | 413 (49.4) | 565 (49.43) |
| School (n, %) | ||
| 1 | 49 (5.86) | 264 (23.1) |
| 2 | 130 (15.55) | 575 (50.3) |
| 3 | 657 (78.59) | 304 (26.6) |
| Parents myopic (n, %) | ||
| 0 (no parent) | 307 (36.85) | 459 (40.16) |
| 1 (one parent) | 332 (39.86) | 446 (39.02) |
| 2 (both parents) | 194 (23.29) | 238 (20.82) |
| Father’s education (n, %) | ||
| 1 | 23 (3.13) | 49 (4.229) |
| 2 | 163 (19.59) | 310 (27.15) |
| 3 | 327 (39.3) | 424 (37.13) |
| 4 | 157 (18.87) | 156 (13.66) |
| 5 | 159 (19.11) | 203 (17.78) |
| Intelligence Quotient (IQ) | ||
| n | 613 | 1023 |
| Mean (std) | 116.87 (11.01) | 112.69 (12.39) |
| Median (range) | 125 (75, 125) | 122 (75, 129) |
| Number of books read per week | ||
| n | 832 | 1143 |
| Mean (SD) | 2.56 (2.56) | 2.64 (2.83) |
| Median (range) | 2 (0, 20) | 2 (0, 50) |
Note: Father’s education level, 1 = no education, 2 = primary education, 3 = secondary education, 4 = tertiary/diploma education, 5 = tertiary/university education, n = sample size, SD = standard deviation, gender 1.
Vision Assessment
Yearly standardized eye examinations were conducted by trained staff in the schools and the VA tested for all children when in grades 3 and 4 (two consecutive visits) were included in this study. Presenting or “walk-in” (with or without usual spectacle correction) distance VA (LogMAR) measurements were obtained for the right and left eyes using the Early Treatment Diabetic Retinopathy Study (ETDRS) testing protocol. In brief, VA was assessed at a distance of 4 meters in normal room lighting. The LogMAR vision chart consists of 5 Snellen letters per line, with a vision scale ranging from 1.00 to −0.30, which corresponds to 6/60 to 6/3 Snellen equivalent.
School Grades
All children in Singapore underwent the standard nationwide end of grade 4 examination which consists of testing for English language and mother tongue competency, and mathematics proficiency. Children’s academic performance was quantified using the average of all three subjects (score range from 0 to 100).
Other Measures
The number of books read per week was determined through a parent-administered standardized questionnaire, which was available in the English, Chinese and Malay languages. Moreover, children from all study demographics underwent an intelligence test (non-verbal Raven Matrix Test), which was administered by trained school child psychologists. Other eye determinations included cycloplegic refraction/ocular biometric measurement. The testing protocol details have been published previously.9
Definitions and Statistical Analysis
VA was recorded using the LogMAR scaling system. For comparison purposes, the LogMAR VA scores were used to define the “better eye” and “worst eye.” Myopia was defined as spherical equivalent (SE) of at least -0.50 diopters (D). We used multiple linear regression model to assess the predictability of VA (grade 3 or 4) on school marks in grade 4, adjusting for other confounders, including age, gender and ethnicity, school, number of books read, intelligent quotient (IQ) and father’s highest level of education and subject. Visual acuity was analyzed as a continuous variable in the multiple linear regression models. We also categorized changes in VA between the grades 3 and 4 measurements (good at both time points, poor at both time points, good at grade 3 and worse at grade 4, and worse at grade 3 and better at grade 4) to assess impact of differing levels of VA stability on academic school performance in grade 4. Statistical significance was assumed at P < 0.05. In addition, we removed IQ only or father’s education only from the initial model, and repeated the analysis in two separate models. Moreover, the multiple linear regression models were repeated using two different definitions: VA defined as worse than or equal to 0.2 (Snellen equivalent = 6/9) and worse than or equal to 0.3 (Snellen equivalent = 6/12). The distribution of average examination marks and VA were skewed (Figure 1 and 2), however the linear regression model was later tested using a scatter plot “studentized residual versus predicted marks.” The SPSS statistical software (version 14.0; SPSS Inc, Chicago) was used for the analysis.
FIGURE 1.
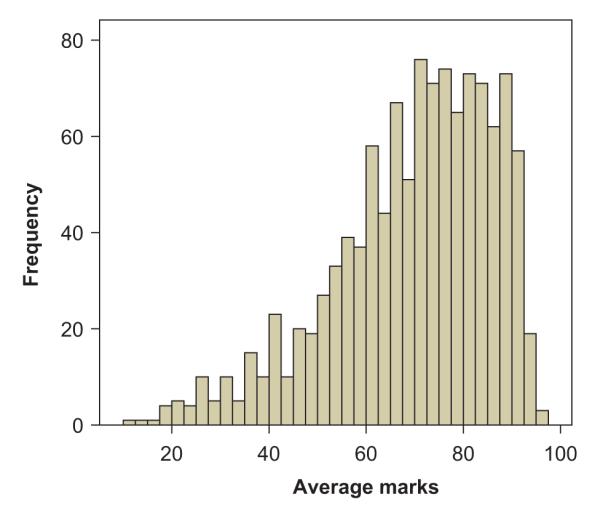
Distribution of average school grades.
FIGURE 2.
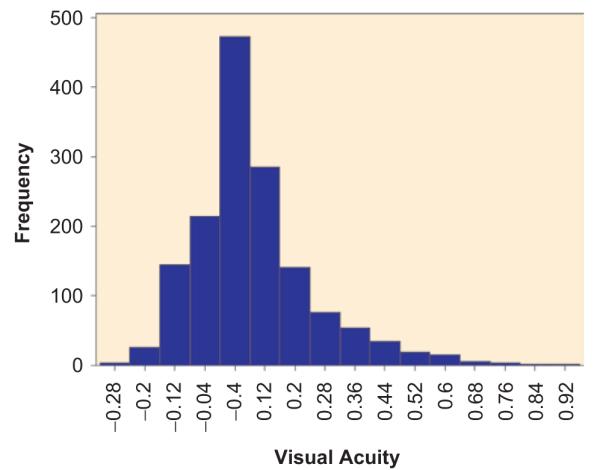
Distribution of visual acuity.
RESULTS
Demographics
At baseline, a total of 1006 children (501 boys and 505 girls) 7 to 9 years of age were ascertained from two schools in 1999. For all children, a higher proportion of Chinese (74.7%), compared to Malay (17.6%) and Indians (6.5%) were recruited in the SCORM study. Children from other ethnic backgrounds represented less than 2% of the cohort, and therefore their statistical contributions were combined with the Indian subgroup.
VA Testing When the Children were in Grades 3 and 4
The mean presenting distance VA for grade 3 children and grade 4 children was 0.10 (Snellen equivalent = 6/7.5) (Standard Deviation (SD): 0.17) and 0.08 (SD: 0.17) in the better eye, respectively. Boys had a significantly higher mean presenting distance VA (0.09, SD = 0.15) compared to that in girls (0.12, SD = 0.17) in grade 3 children, p = 0.0007. Similarly, boys scored significantly better (0.08, SD: 0.16) compared to that in girls (0.11, SD: 0.16) for children in grade 4, p = 0.012. Moreover, mean presenting distance VA was similar among different ethnic groups for children in grade 4, Chinese (0.08, SD = 0.16), Malay (0.07, SD = 0.19) and Indians (0.06, SD = 0.17), (p = 0.51). However, an ethnic effect was observed for grade 3 children, with Chinese children (0.11, SD = 0.17) scoring worse than Malay (0.08, SD = 0.17) and Indian (0.06, SD = 0.16), (p = 0.01) children.
Better eye VA in grade 3 (beta coefficient, β= 1.98, p = 0.38) (Table 2) and in grade 4 (β = 2.44, p = 0.27) (Table 2) was not statistically significantly associated with average examination marks in grade 4, after adjusting for age, gender, ethnicity, school, reading (books read per week), subject IQ, and father’s highest level of education. The analysis was repeated by developing separate models. The first set of models was constructed by the full model minus subject IQ. The second set of models was the full model minus paternal education. Each set was analyzed for better eye VA in grade 3, worse eye VA in grade 3, better eye VA in grade 4, and worse eye VA in grade 4. The association between VA and average examination marks remained statistically insignificant for all 8 models. Worst eye VA (worst eye) was not significantly associated with average examination marks for children in grades 3 (β = −0.03, p = 0.98) and 4 (β= 2.52, p = 0.16) using the full model.
TABLE 2.
Multiple linear regression models of visual acuity (better eye) in grade 4 and school performance assessed by the grade 4 nationwide examination
| Grade 4 |
Grade 3 |
|
|---|---|---|
| Characteristics | Regression coefficient and 95% CI |
Regression coefficient and 95% CI |
| Visual acuity in better eye | 2.44 (−1.90, 6.79) | 1.98 (−2.49, 6.46) |
| Gender, male versus female | −4.09 (−5.59, −.60) | −4.01 (−5.52, −2.51) |
| Ethnicity | ||
| Chinese | 1.38 (−1.77, 4.54) | 0.21 (−3.01, 3.44) |
| Malay | −3.23 (−6.72, 0.25) | −4.28 (−7.81, −0.75) |
| Other | – | – |
| School | ||
| 1 | 1.91 (−0.41, 4.23) | 2.12 (−0.18, 4.43) |
| 2 | 0.27 (−1.65, 2.18) | 0.47 (−1.46, 2.39) |
| 3 | – | – |
| Father’s educational level | ||
| 1 | −19.06 (−23.25, −14.87) | −19.30 (−23.56, −15.04) |
| 2 | −10.41 (−13.13, 27.69) | −10.89 (−13.64, 28.15) |
| 3 | −6.65 (−9.05, −4.24) | −7.19 (−9.62, −4.76) |
| 4 | −1.43 (−4.17, 1.31) | −1.44 (−4.19, 1.32) |
| 5 | – | – |
| Number of books read/week | 0.48 (0.22, 0.74) | 0.48 (0.22, 0.74) |
| Intellegence Quota (IQ) score | 0.61 (0.55, 0.68) | 0.60 (0.53, 0.66) |
Note: Father’s Education Level, 1 = no education, 2 = primary education, 3 = secondary education, 4 = tertiary/diploma education, 5 = tertiary/university education. CI = Confidence interval.
To assess the potential impact of changes in VA and whether those with poor vision in grade 3 but better vision in grade 4 might perform better on the grade 4 exams, we also performed an analysis using categories of VA at each of the vision assessments. Distance VA was delineated into 4 categories; category 1—good VA in grades 3 and 4, category 2—poor VA in grade 3 and good VA in grades 4, category 3—good VA in grade 3 and poor VA in grades 4, category 4—poor VA in grades 3 and 4. Good VA was defined as less than 0.3 and poor VA as greater than equal to 0.3. Using the fourth category (poor vision in both years) as the reference in the multiple regression models, no significant association was found between distance VA and average examination marks using both the better eye (Table 2) and worst eye (Table 3) for all vision categories.
TABLE 3.
Multiple linear regression models of visual acuity (categorical) (for better eye, visual acuity cut-off of 0.2) and school performance assessed by the grade 4 nationwide examination
| VA cut-off of 0.2 |
VA cut-off of 0.3 |
|
|---|---|---|
| Characteristics | Regression coefficient and 95% CI |
Regression coefficient and 95% CI |
| Visual acuity | ||
| 1 | −0.41 (−3.16, 2.34) | −1.55 (−5.62, 2.51) |
| 2 | 1.28 (−2.08, 4.63) | −0.76 (−5.59, 4.07) |
| 3 | 0.37 (−3.20, 3.95) | −0.53 (−5.47, 4.40) |
| Gender, male versus female | −4.03 (−5.55, −2.51) | −4.06 (−5.58, −.54) |
| Ethnicity | ||
| Chinese | 0.69 (−2.54, 3.92) | 0.65 (−2.58, 3.88) |
| Malay | −3.72 (−7.27, −0.17) | −3.77 (−7.32, 0.22) |
| Other | – | – |
| School | ||
| 1 | 1.72 (−0.63, 4.07) | 1.20 (−0.60, 4.11) |
| 2 | 0.42 (−1.51, 2.36) | 0.41 (−1.52, 2.34) |
| 3 | – | 2 |
| Father’s educational level | ||
| 1 | −19.01 (−23.28, −14.74) | −19.01 (−23.28, 14.74) |
| 2 | −10.66 (−13.44, −7.88) | −10.67 (−13.45, −7.89) |
| 3 | −7.06 (−9.53, −4.58) | −6.96 (−9.43, −4.49) |
| 4 | −1.69 (−4.48, 1.11) | −1.69 (−4.48, 1.11) |
| 5 | – | – |
| Number of books read/week | 0.49 (0.23, 0.75) | 0.48 (0.22, 0.74) |
| Intellegence Quota (IQ) score | 0.62 (0.55, 0.68) | 0.61 (0.55, 0.68) |
Note: Father’s Education Level, 1 = no education, 2 = primary education, 3 = secondary education, 4 = tertiary/diploma education, 5 = tertiary/university education. Visual Acuity for the better eye (VA), 1 = good VA in Grades 3 and 4, 2 = poor VA in Grade 3 and good VA in Grades 4, 3 = good VA in Grade 3 and poor VA in Grades 4, 4 = poor VA in Grades 3 and 4, good VA = less than 0.2, poor VA = greater than 0.2.
CI = Confidence interval.
DISCUSSION
Our findings show that presenting VA in Singaporean schoolchildren had no significant effect on current or academic school performance one year later, after adjusting for associated risk factors, which included gender, ethnicity, school, time spent reading, IQ and father’s highest level of education. The lack of association between distance VA and academic school performance was consistent even after separately removing subject IQ and father’s highest level of education from the multiple linear regression models, categorizing distance VA, and assessment of VA in the worst eye. Furthermore, changes in VA from grade 3 to grade 4 did no influence academic performance in grade 4. However, unlike many previous studies, we excluded children with any known eye conditions, such as media opacities and ocular motility disorders, from the main analysis. As such, our results reflect only one measure of vision (visual acuity), which is important from both a policy perspective and in understanding the limitations of the literature.
The findings from our study confirm the findings from a earlier study by Helveston and co-workers11 who assessed visual function (VA, ocular dominance, color vision, refraction and eye muscle balance) in 1,910 school aged children and found no positive association between visual function and academic performance. However, the Helveston study11 only used time spent reading as a surrogate measure for academic performance and did not account for any confounders. Moreover, contrary to our study findings, a previous study by Johnson and co-workers3 found that 35% of at-risk students (aged 8 to 18 years) failed their distance VA test, which is one of the nine tests included in the New York State Optometric Association (NYSOA) vision screening battery. Nonetheless, the latter study assessed individuals in an older age group (8 to 18 years), where more visually demanding tasks would be expected to be undertaken. Further, the means of their assessment would not have excluded those with ocular conditions that might be expected to have a more profound impact on school performance.
Indeed, our study findings also contrast with that of other previous studies4,12–14 that showed a positive relationship between a range of visual factors and academic school performance, with visual deficiencies affecting academic school performance in children. However, no direct comparisons can be made as previous studies were not designed with inclusion of clinical assessments of VA and other ocular conditions and did not include the full range of factors included in our study. Moreover, our negative findings do not include assessment of other components of visual function, such as vision-related symptoms,2 eye movements,12 refractive error,3 near stereoacuity,13 visual motor activities,12 ocular accommodation and color vision14,15 that have been shown to be associated with academic school performance. Thus the latter visual function factors should be assessed to determine if they should be included in vision care strategies to improve a child’s academic school performance.
Furthermore, although previous studies have been important in determining vision-related risk factors in academic performance, they are not free of methodological flaws, namely the use of a small sample size (ranging from only 25 to up to 540 children), lack of clinical visual acuity tests, and the lack of standardized academic grades. We undertook a more rigorous analysis using a large cohort of children, obtained repeated yearly clinical VA measurements at different points in time and accounted for as many potential confounding factors as possible, such as gender, age, ethnicity, near work activity, subject intelligence and father’s highest level of education. In addition, the longitudinal nature of the current study allowed for the analysis of differing levels and the change of VA over time. The availability of exact marks from a standard nationwide examination is a more accurate reflection of school performance. Nonetheless, the weaknesses of the current study need to be considered, namely the lack of near VA measurements, only a proportion of accessible results for average examination marks, selective ethnic grouping and no follow-up data on later school grades. In addition, a proportion of children failed to complete VA assessment, due to testability issues. Moreover, although our data are representative of that of the broader young Singaporean population, we only have a small proportion of participants with decreased VA, which may have restricted the statistical power to detect a significant association of VA and school performance. Unfortunately, addressing these limitations is beyond the scope of the current study, but should be considered in future studies exploring the relationship of visual factors and school grades.
There is an epidemic of myopia in Singapore and less than optimal vision may be partially explained by the under-correction of refractive error.16 Refractive error is one of the most common causes of visual impairment world-wide.5,17–22 In Asian countries, such as Singapore, where the prevalence of myopia is much higher (43% in 9-year-olds) and progresses more rapidly (0.8 D per year) compared to that in Western countries,23 there are important reasons to ensure that comprehensive and appropriate vision assessments are implemented during childhood and adolescence ensure the best possible life-long vision and visual function that extend beyond school grade performance. Even though our study findings show no relationship between VA and academic performance in young Singaporean children, it is important to note that our analyses excluded children with diagnosed ocular conditions and that the level of average VA was quite good in our population as a result. Further, it shows the strong contributions of work habits (reading) and parental influence (father’s highest level of education) in academic achievement. Finally, we are unable to comment upon other forms of visual performance, such as contrast or stereoacuity. Thus, because poor academic performance may affect a child’s psychosocial outlook and development, and career prospects and qualifications, appropriate visual assessment should remain an important element of educational policy.
ACKNOWLEDGMENTS
We extend many thanks to the student subjects and their families for participation in this study. The SCORM study was supported by the National Medical Research Council NMRC/0975/2005. TLY was supported by grants from National Institute of Health (NIH) (RO1 EY014685), and the Research to Prevent Blindness, Inc.
Footnotes
Declaration of Interest: The authors report no conflict of interest. The authors alone are responsible for the content and writing of the article.
REFERENCES
- 1.Zaba J. Social, emotional, and educational consequences of undetected children’s vision problems. J Behav Optom. 2001;12:66–70. [Google Scholar]
- 2.Vaughn W, Maples WC, Hoenes R. The association between vision quality of life and academics as measured by the College of Optometrists in Vision Development Quality of Life questionnaire. Optometry. 2006;77:116–123. doi: 10.1016/j.optm.2006.01.004. [DOI] [PubMed] [Google Scholar]
- 3.Johnson R, Nottingham D, Stratton R, et al. The vision screening of academically and behaviorally at risk pupil. J Behav Optom. 1996;7:39–42. [Google Scholar]
- 4.Maples WC. A comparison of visual abilities, race and socioeconomic factors as predictors of academic achievement. J Behav Optom. 2000;7:39–42. [Google Scholar]
- 5.Taylor HR, Livingston PM, Stanislavsky YL, et al. Visual impairment in Australia: distance visual acuity, near vision, and visual field findings of the Melbourne Visual Impairment Project. Am J Ophthalmol. 1997;123:328–337. doi: 10.1016/s0002-9394(14)70128-x. [DOI] [PubMed] [Google Scholar]
- 6.Wong TY, Saw SM. Issues and challenges for myopic research. Ann Acad Med Singapore. 2004;33(1):1–3. [PubMed] [Google Scholar]
- 7.Taylor HR, Keeffe JE. World blindness: a 21st century perspective. Br J Ophthalmol. 2001;85:261–266. doi: 10.1136/bjo.85.3.261. [DOI] [PMC free article] [PubMed] [Google Scholar]
- 8.Saw SM, Chua WH, Hong CY, et al. Nearwork in early-onset myopia. Invest Ophthalmol Vis Sci. 2002;43(2):332–339. [PubMed] [Google Scholar]
- 9.Saw SM, Hong CY, Chia KS, et al. Nearwork and myopia in young children. Lancet. 2001;357(9253):390. doi: 10.1016/S0140-6736(05)71520-8. [DOI] [PubMed] [Google Scholar]
- 10.Chong YS, Liang Y, Tan D, et al. Association between breastfeeding and likelihood of myopia in children. JAMA. 2005;293:3001–3002. doi: 10.1001/jama.293.24.3001. [DOI] [PubMed] [Google Scholar]
- 11.Helveston EM, Weber JC, Miller K, et al. Visual function and academic performance. Am J Ophthalmol. 1985;15:346–355. doi: 10.1016/0002-9394(85)90368-x. [DOI] [PubMed] [Google Scholar]
- 12.Krumholtz I. Results from a pediatric vision screening and its ability to predict academic performance. Optometry. 2000;71:426–430. [PubMed] [Google Scholar]
- 13.Kulp MT, Schmidt PP. A pilot study. Depth perception and near stereoacuity: is it related to academic performance in young children? Binocul Vis Strabismus Q. 2002;17:129–134. [PubMed] [Google Scholar]
- 14.Kedzia B, Tondel G, Pieczyrak D, et al. Accommodative facility test results and academic success in Polish second graders. J Am Optom Assoc. 1999;70:110–116. [PubMed] [Google Scholar]
- 15.Maples WC. Visual factors that significantly impact academic performance. Optometry. 2003;74:35–49. [PubMed] [Google Scholar]
- 16.Seet B, Wong TY, Tan DT, et al. Myopia in Singapore: taking a public health approach. Br J Ophthalmol. 2001;85(5):521–526. doi: 10.1136/bjo.85.5.521. [DOI] [PMC free article] [PubMed] [Google Scholar]
- 17.Attebo K, Mitchell P, Smith W. Visual acuity and the causes of visual loss in Australia. The Blue Mountains Eye Study. Ophthalmology. 1996;103:357–364. doi: 10.1016/s0161-6420(96)30684-2. [DOI] [PubMed] [Google Scholar]
- 18.Tielsch JM, Sommer A, Katz J. Blindness and visual impairment in an American urban population. The Baltimore Eye Survey. Arch Ophthalmol. 1990;108:286–290. doi: 10.1001/archopht.1990.01070040138048. [DOI] [PubMed] [Google Scholar]
- 19.Dandona L, Dandona R, Naduvilath TJ, et al. Burden of moderate visual impairment in an urban population in southern India. Ophthalmology. 1999;106:497–504. doi: 10.1016/S0161-6420(99)90107-0. [DOI] [PubMed] [Google Scholar]
- 20.Mansour AM, Kassak, Chaya M, et al. National survey of blindness and low vision in Lebanon. Br J Ophthalmol. 1997;81:905–906. doi: 10.1136/bjo.81.10.905. [DOI] [PMC free article] [PubMed] [Google Scholar]
- 21.Zerihun N, Mabey D. Blindness and low vision in Jimma Zone, Ethopia: results of a population-based survey. Ophthalmic Epidemiol. 1997;4:19–26. doi: 10.3109/09286589709058057. [DOI] [PubMed] [Google Scholar]
- 22.Negrel AD, Minassian DC, Sayek F. Blindness and low vision in southeast Turkey. Ophthalmic Epidemiol. 1996;3:127–134. doi: 10.3109/09286589609080118. [DOI] [PubMed] [Google Scholar]
- 23.Saw SM, Tong L, Chua WH, et al. Incidence and progression of myopia in Singaporean school children. Invest Ophthalmol Vis Sci. 2005;46(1):51–57. doi: 10.1167/iovs.04-0565. [DOI] [PubMed] [Google Scholar]