Abstract
There is an increasing interest in bubble-mediated focused ultrasound (FUS) interventions in the brain. However, current technology lacks the ability to spatially monitor the interaction of the microbubbles with the applied acoustic field, something which is critical for safe clinical translation of these treatments. Passive acoustic mapping could offer a means for spatially monitoring microbubble emissions that relate to bubble activity and associated bioeffects. In this study a hemispherical receiver array was integrated within an existing transcranial therapy array to create a device capable of both delivering therapy and monitoring the process via passive imaging of bubble clouds. A 128-element receiver array was constructed and characterized for varying bubble concentrations and source spacings. Initial in vivo feasibility testing was performed. The system was found to be capable of monitoring bubble emissions down to single bubble events through an ex vivo human skull. The lateral resolution of the system was found to be between 1.25-2 mm and the axial resolution between 2-3.5 mm, comparable to the resolution of MRI-based temperature monitoring during thermal FUS treatments in the brain. The results of initial in vivo experiments show that bubble activity can be mapped starting at pressure levels below the threshold for Blood-Brain barrier disruption. This study presents a feasible solution for imaging bubble activity during cavitation-mediated FUS treatments in the brain.
Keywords: Transcranial ultrasound, Blood-Brain Barrier, Passive cavitation mapping, Focused ultrasound
I.Inroduction
Transcranial focused ultrasound has been clinically investigated for the treatment of chronic pain [1], glioblastoma [2] and essential tremor [3]. These treatments are thermal in nature and can be monitored using magnetic resonance imaging (MRI) thermometry. However other focused ultrasound brain treatments, such as disruption of the Blood-Brain barrier (BBB) for targeted drug delivery to the brain [4, 5, 6] and cavitation-enhanced stroke treatments [7, 8] are non-thermal and are more difficult to monitor in real-time by MRI. Further, disruption of the BBB using focused ultrasound has now been tested in non-human primates, with no cognitive deficits reported [9]. This represents a major milestone in translation to clinical testing, but eventual implementation in routine clinical practice will require a robust, real-time monitoring technique.
McDannold et al. [10] first reported an association between successful BBB disruption (BBBD) and an increase in cavitation activity. Recently, the spectral information from microbubble emissions during BBBD has been used to select treatment pressures [11] and to modulate them in real-time [12] to ensure treatment safety and efficacy. However, these treatment control schemes do not provide any information regarding the spatial extent of the cavitation activity.
Passive imaging could provide a means to localize cavitation activity in the brain. Passive cavitation detectors (PCDs) are long established for investigating cavitation phenomena [13, 14, 15], and advancement from single element PCDs [16] to arrays of PCDs has added spatial information to cavitation studies [17, 18]. Passive imaging has long been used to localize sources [19, 20, 21] in a number of different fields, but has been of high interest in recent ultrasound research [22, 23, 24, 25] due to its potential to map bubble activity during cavitation-enhanced therapies and thereby enhance treatment safety and assess outcome. However, passive imaging has had limited investigation for brain treatments due to the challenges associated with ultrasound imaging through the skull. The skull bone is highly attenuating and aberrating to sound, particularly at higher frequencies, and brain imaging is typically limited to targets visible through the temporal or suboccipital windows [26, 27]. Cavitation mapping could be utilized with narrow aperture arrays, as has been demonstrated in soft tissues [24] and in one transcranial study in primates [25], by utilizing the minimally perturbing acoustic windows in the skull. However, passive beamforming is based on the interference of time-delayed waveforms, resulting in a point spread function (PSF) that is highly dependent on array geometry. Thus, passive imaging algorithms achieve the best resolution when large apertures are used [21] and so optimal implementation of these algorithms would use an array that covered the entire skull surface.
In this study we describe a sparse hemispherical receiver array for passive imaging of transcranial sources. We have previously described a method using this array for transcranial vascular imaging [28]. Here we characterize the receiver array and examine its potential for imaging bubble clouds during ultrasound brain therapy. The results and their implication for therapeutic ultrasound use in the brain are discussed.
II. MATERIALS AND METHODS
A. Array Design
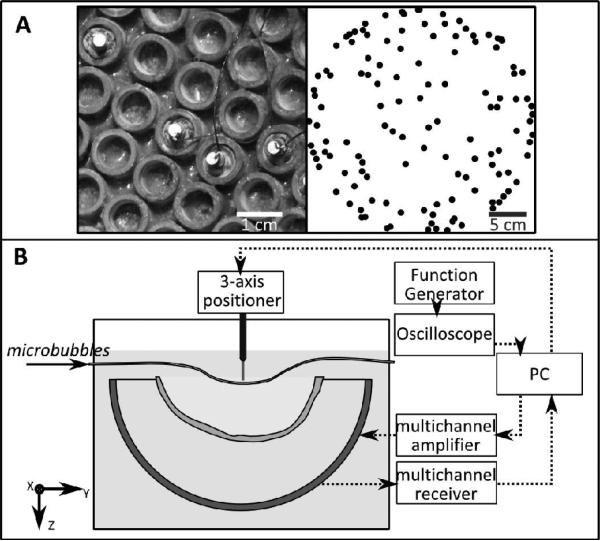
The receiver array consisted of 128 piezo-ceramic disc elements (Del Piezo Specialties, LLC., West Palm Beach, FL, U. S. A.), 2.54 mm in diameter, and with center frequencies of 612 kHz. The elements were integrated into the array described by Song and Hynynen [29] which is a 30 cm diameter hemispherical array consisting of 1372 tube elements with a fundamental frequency of 306 kHz. The receivers were potted in the middle of 128 transmit elements, in a sparse arrangement (Fig. 1A) that was optimized to suppress grating lobes through numerical simulations [30]. Dual-mode (therapy/imaging) ultrasound arrays have been presented which use the same elements for transmit and receive [31, 32]. Here, we have a large available array surface area and so have chosen separate receive elements tuned to the second harmonic of the transmit array in order to minimize interference from the transmit signal, emphasize the harmonic signal content in the captured waveforms and suppress the strong fundamental signals reflected from the skull bone.
Fig. 1.
(A, left) Receive elements sparsely potted within the tube transmit elements. (A, right) Top projection of the receive array element configuration. (B) Experimental setup.
The locations of the receivers were determined by triangulation. A 1.5 mm, 765 kHz narrow-band source was excited using an impulse from a pulser/receiver (Panametrics, Olympus-NDT, Inc., Waltham, MA), and the time of flight to each array element was determined. This time of flight measurement was repeated at various source locations, moving the source around the field using a Parker/Velmax 3-D positioning system (Parker, Hannifin, PA, USA; Velmax Inc, Broomfield, NY, USA).
B. Benchtop Experiments
The experimental setup is shown in Fig. 1B. The transducer was placed in a rubber-lined tank filled with degassed, deionized water, centered below the 3-axis positioning system. An ex vivo human skullcap was degassed for at least 2 hours prior to experimentation. The skullcap was placed in the tank, between the array and thin-walled tubing was placed on the acoustic axis within 2 cm of the geometric focus. The frame holding the skullcap limited the depth in the dome that it could be placed, and so positioning of the tube distal to the geometric focus allowed a central target in the brain to be simulated. During the experiments, measurements were also performed for targets at the geometric focus of the array, and proximal of the geometric focus.
A sub-set of the therapeutic array was driven during the experiments using a 128 channel driving system (Verasonics, Inc., Redmond, WA, USA). Due to the low driving frequency, the aberrations due to the skull were minimal [33], and the transmit array was focused using geometric focusing only. The transducer was excited using a five cycle burst, and focal pressures between approximately 0.15 and 0.35 MPa (Mechanical Index (MI) = 0.25 - 0.59) were achieved through the skull. The pressure at the focus was determined for one focal position in the skull cavity using a calibrated fiber-optic hydrophone (Precision Acoustics, Ltd., Dorset, U.K.). The profile was then measured with the 1.5 mm diameter ceramic source/receiver used in the array triangulation measurements, and the fiber-optic hydrophone measurements were used to calibrate the ceramic receiver. The voltage generated by the ceramic receiver was measured by an oscilloscope (TDS 3014B, Tektronix, Richardson, TX, USA). The focal pressure in subsequent measurements was monitored with the ceramic source/receiver. The pulse repetition frequency (PRF) during the different experiments was between 1 and 100 Hz. The raw RF data from the receiver array was captured using a 128 channel receiver (SonixDAQ, Ultrasonix, Richmond, B.C., Canada).
Performance of the array was assessed by mapping the activity of Definity microbubbles (1-3 μm mean diam., Lantheus Medical Imaging, North Billerica, MA, USA) flowing in tube phantoms. The microbubble solution was gravity fed through the tube phantoms. Estimates of the bubble concentrations used in this study were determined from Coulter counter measurements. Samples were taken from 3 vials of Definity and measured in a Coulter counter (Multisizer 3, Beckman Coulter Inc., Brea, CA, USA) within approximately 30 minutes of activation. A 30 μm aperture tube was used. Each sample was measured three times. The concentrations cited in this study are based on a mean measured concentration of (5.3 ± 1.1) ×109 bubbles/mL for the undiluted agent. The concentration of microbubbles was varied from 5.3×10⁶ microbubbles/mL, or approximately 5 times the expected concentration in the blood stream given a clinical dose, to 320 microbubbles/mL, or approximately 3×10⁻⁴ times the clinical concentration. The polytetrafluoroethylene tubing (Cole-Parmer, Vernon Hills, IL, USA) used in the first three experiments was 0.8 mm in inside diameter (ID) (outside diameter (OD) = 1.4 mm), and the average flow rate in the tubing was approximately 7 mL/min. In the fourth experiment, a smaller tube size (ID = 0.26 mm, OD = 0.75 mm) was used in order to examine the resolution of the system. The flow rate in the smaller tube size was approximately 0.08 ml/min. In the final experiment, three tubing sizes were used: the 0.8 and 0.26 mm ID tubes, and a third tube with ID = 0.51 mm and OD = 1.07 mm. The flow rates in the three tubes were approximately 0.47, 0.32 and 0.16 mL/min, from largest to smallest, respectively.
Experiment 1: A tube was mounted on the three-axis positioner, parallel to the y-axis, and mechanically scanned through a fixed transducer focus in 1 mm increments along the x-axis. At each position a reference sonication with the tube filled with saline or deionized water was taken and compared with a sonication when the tube was filled with a solution of microbubbles.
Experiment 2: The tubing was fixed at the transducer focus and different concentrations of microbubbles were flowed through the tube to determine the minimum bubble concentration that could be detected. Measurements at the highest and lowest bubble concentrations were performed at several locations along the acoustic axis of the dome.
Experiment 3: Two tubes were placed approximately 5 mm apart. A volume scan of the two tubes was performed using electronic steering to scan a 20 × 20 ×10 mm3 volume with a 2 mm step size. Data was captured from the sonications at each transmit focus and used to create a maximum pixel projection of the tubes.
Experiment 4: Five tubes, each with an ID of 0.26 mm and an OD of 0.75 mm, were placed in a row along the x-axis with their walls touching. The tubes were aligned parallel to the y-axis. The tubes were initially filled with deionized water and a reference sonication was performed by scanning the transducer focus through an xz-plane that intersected the tubes. Two tubes at a time were then filled with a solution of microbubbles, while leaving the rest filled with water. The sonications were repeated for different spacings of the bubble-filled tubes (i.e. adjacent, one tube spacing, two tube spacing). The data captured for each transmit focus was used to create a maximum pixel projection of the tubes. The same process was repeated for a seven-tube phantom with the tubes stacked in the z-direction, in order to determine the axial resolution of the array.
Experiment 5: Three tubes with different diameters (IDs = 0.8 mm, 0.51 mm and 0.26 mm) were joined using superglue to form a bifurcation. Microbubble solution was flowed from the large tube into the small tubes, with the flow direction aligned parallel to the system y-axis. A volume scan was performed by scanning through a 14 × 6 × 8 mm3 volume (1 mm step size, x and y; 2 mm step size, z). Data was captured for each transmit focus and used to create a maximum pixel projection image.
C. In Vivo Experiments
Two Wistar rats (Male, 600-700 g) were used to initially assess the system in vivo. The animals were anesthetized via intramuscular injection of ketamine (40-50 mg/kg) and xylazine (10 mg/kg). The animal's heads were shaved with an electric razor and the remaining hair was removed using a depilatory cream. The animals were placed supine on a platform with their heads supported by a membrane touching the water filled array. Ultrasound gel was used to ensure good coupling between the animals head and the membrane. Sonications were performed through the rat skull bone but in the absence of a human skull cap.
Sonications were performed outside the MRI, however the platform with the animal was moved between the array and a 1.5 T MRI (Signa 1.5 T, GE Healthcare, Milwaukee, WI,USA) for treatment planning and assessment of BBB disruption.
All sonications were 130 bursts in length. Burst consisted of 5 cycles of ultrasound at a driving frequency of 306 kHz, repeated at a rate of 1 Hz. The treatment duration was selected to match the available receive buffer size, while keeping close to the 2 minute treatment time used in our previous studies [12, 34]. The transmit bursts were kept at only 5 cycles in length since previous studies have shown short pulses can be effective at disrupting the BBB [34, 35], and by using short pulses interference of skull echos with the microbubble emissions was reduced. The transmit and receive equipment was as described in the bench-top experiments. Waveforms were captured during each burst for later reconstruction. In each animal an initial sonication was performed without microbubbles to acquire baseline acoustic maps. Next a low power sonication was performed (estimated in situ pressure = 0.25 MPa). The sonication was started simultaneously with the injection of a bolus of Definity contrast agent (0.02 mL/kg) delivered via a tail vein catheter. Contrast enhanced (0.2 mL/kg Omniscan, GE Healthcare) T1-weighted MRI images (FSE, TE = 10 ms, TR = 500 ms, ETL = 4, FOV = 6 cm×6 cm, slice thickness = 1 mm, 128 × 128) were obtained to assess the integrity of the BBB. Following the MRI scans a second sonication was performed in the same target location, at higher power (estimated in situ pressure = 0.5 MPa), and the MRI scans were repeated. At least ten minutes passed between sonications in an animal.
D. Data Processing
The data were post-processed in MATLAB (Mathworks, Natick, MA, USA). Reference data taken with the tube phantoms filled with saline or deionized water were subtracted from data captured with microbubbles in the tube. This was done in order to suppress the reflections from the skull, tube and hydrophone mounts, and was performed line by line on the raw RF data prior to further processing. The resulting signals were then digitally filtered with a fourth-order Butterworth band-pass filter. The low frequency cut-off was 400 kHz to suppress the transmit frequency. The high frequency cut-off was experimentally varied between 800 kHz and 1.5 MHz to examine the effect of the filter on the reconstructed images.
Images were reconstructed by beamforming over a reconstruction grid using geometric delays and optional additional delay terms to account for the effects of the skull. Mathematically, this can be expressed as:
where I(r) is the intensity at a point r = (x,y,z) in the reconstruction grid, and Qi(r;t) is the time-delayed waveform for receiver i and point r, which can be expressed as:
where pi(t) is the pressure value recorded by element i at time t, ri is a vector of the coordinates of receiver element i, c is the speed of sound in the medium, si is a delay term to compensate for the effect of the skull on the waveform received by element i, and ∥.∥ represents the Euclidean norm. Multiplication by ∥ri-r∥, the Euclidean norm of the distance between element i and the point r, accounts for spherical spreading [21].
The skull delay terms were determined using a fixed 765 kHz source emitting from a location within the reconstruction grid. The source was excited with an impulse and signals received at each element were recorded. This was repeated with the skull placed between the array and source. The necessary delays to account for the propagation effects of the skull were then determined by cross-correlating the signals with and without the presence of the skull. As an example, in one correction, the mean correlation coefficient across all channels was 0.93 ± 0.11. In this correction, 20 channels recorded very poor signals transcranially for calculating the delays. The mean time delay across the remaining 108 channels, was measured to be 2.4 ± 0.8 μs. The correlation coefficients, number of dropped channels, and mean time delay varied with skull placement in the dome. In general, the skull delay parameters, {si}, vary with source location, receiver element location and frequency [36]. However, the delay parameter will not vary substantially over a small reconstruction grid with a narrow frequency band [37]. This method was used to simplify the experiments while in clinical cases CT-based corrections [37] could be calculated using methods similar to those used for correcting the transmit beams in previous clinical FUS investigations [1, 2, 3].
III. Results
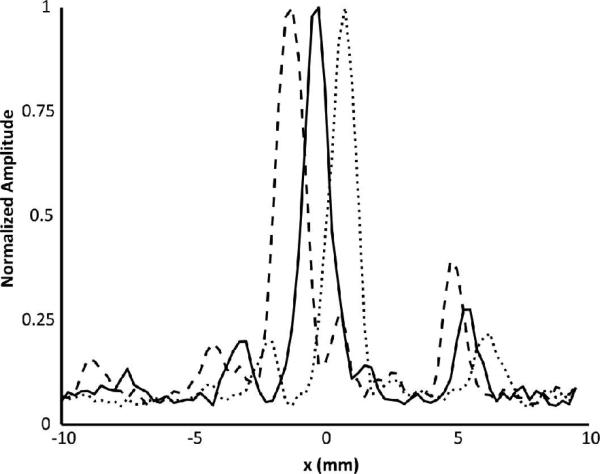
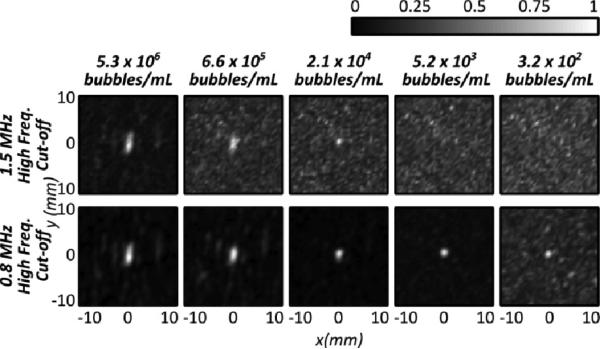
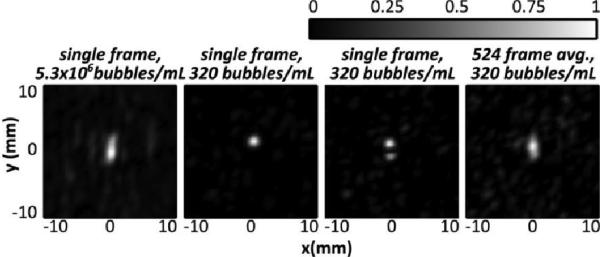
Fig. 2 shows three line profiles across the 0.8 mm tubing at three different locations within a fixed transducer focus. The line profiles were obtained at the highest bubble concentration, 5.3×10⁶ bubbles/mL, and show that cavitation sources can be resolved within different subvolumes of the transmit focus. Fig. 3 shows reconstructed images for a fixed tube position with decreasing bubble concentration, and using two different high frequency cut-offs (0.8 and 1.5 MHz). Using the 1.5 MHz cutoff, it can be seen that the ability to reconstruct the images at low bubble concentrations is hindered by a poor signal to noise ratio. At 2.1×10⁴ bubbles/mL, or 2% of the clinical concentration in the blood stream, a source can still be observed in the reconstruction. However at 5.2×10³ bubbles/mL, or 0.5% of the clinical concentration, the source is not distinguishable in the reconstruction when using a 1.5 MHz high frequency cut-off. This is in part due to coherent noise at discrete frequencies around 1 MHz that can be seen in the frequency domain and can be larger than the frequency component of the bubble activity for low concentrations. The image can be improved by filtering out these noise components. When a narrower passband is used (400-800 kHz) to emphasizes signals around the receive center frequency and the transmit second harmonic, then bubbles can be visualized even at as low a concentration as 320 bubbles/mL. At this concentration, there is approximately 1 bubble per 6 mm of tubing, so the images produced can be assumed to be of a single bubble.
Fig. 2.
Normalized intensity line profiles resulting from shifting a 0.8 mm tube in 1 mm increments through a fixed transducer focus. Each profile has been normalized to its maximum.
Fig. 3.
Normalized intensity maps for varying bubble concentrations reconstructed using (top) a 1.5 MHz high frequency cut-off and (bottom) a 0.8 MHz high frequency cut-off. The maps are normalized to the maximum intensities within each frame. The flow direction is parallel to the y-axis
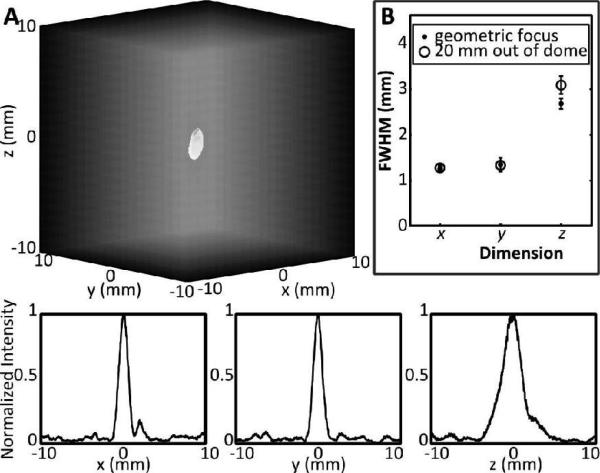
Using the results from a single bubble, the PSF for different locations in the field can be determined. Fig. 4A shows a three-dimensional -3 dB intensity isosurface of the reconstruction of a single bubble located near the geometric focus of the array. Also shown in Fig. 4A are line profiles through the source along the three Cartesian axes. In Fig. 4B, the full-width-at-half-maximum (FWHM) dimensions of the reconstruction are plotted, averaged over 10 bubble measurements at the geometric focus, and at 20 mm out of the array, along the acoustic axis. As expected, the axial FWHM was greater than the lateral FWHM since the array geometry affords tighter focusing in the lateral plane. The lateral FWHM measurements were similar at the two locations, at approximately 1.3 mm, while they varied in the axial direction (2.7 ± 0.1 mm at the geometric focus, versus 3.1 ± 0.2 mm at 20 mm out of the dome). Thus, close to the geometric focus, the ratio between the axial FWHM and lateral FWHM is approximately 2.06, close to the ratio of 2 that is expected for a hemispherical geometry, and greater than 2 when the source is out of the dome and the effective aperture of the array is reduced [23].
Fig. 4.
(A, top) 3-dimensional rendering of the intensity map for a bubble located at approximately the geometric focus, along the transducer axis (out of the dome). (A, bottom) Normalized intensity profiles for a single bubble along the x, y and z directions. The axes are in mm from the source location. (B) Full width half maximum (FWHM) dimensions for single bubbles measured at the geometric focus and at 20 mm out of the dome along the acoustic axis. Measurements shown are the mean value averaged over 10 bubble measurements at each location, and the error bars represent one standard deviation.
Microbubble activity in the tubing was detected and mapped for sources from 20 mm out of the dome to 15 mm proximal to the geometric focus (approximately 2 cm from the skull surface). More extreme locations were not investigated due to the limited electronic steering range afforded by the subset of transmit elements used in this study.
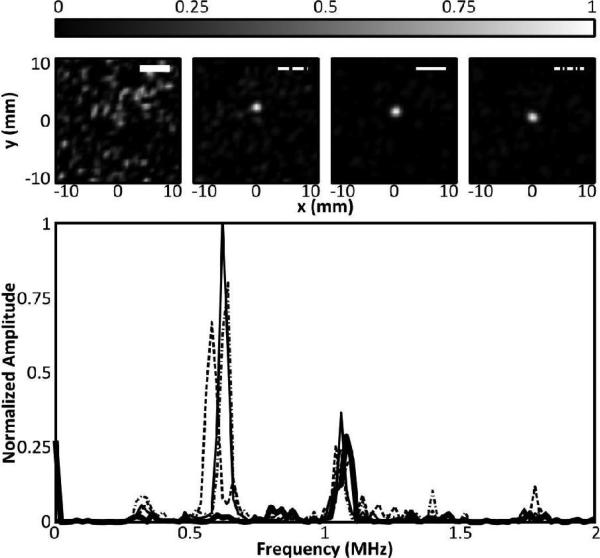
At the lowest bubble concentration, the tube was sonicated and RF data were acquired at a rate of 100 Hz for a total of 5.24 seconds (524 frames). Source displacement between frames is parallel with the tubing, consistent with motion of bubbles as they flow through the tubing, and in Fig. 5, it can be seen that a time average of the 524 frames produces a similar image to the single frame with a concentration of 5.3×10⁶ bubbles/mL. Further analysis of this data set found that a minimum of approximately 100 frames at the low concentration were needed to produce a time-averaged image (not shown) similar to the high concentration image. At the low bubble concentration some frames contained no bubbles (not shown), while others contained the image of one bubble or two separated bubbles (Fig. 5). In the frequency domain, differences in bubble response can be observed. Fig. 6 shows the bubble response at the transmit second harmonic for four of the 524 frames, and the corresponding maps. It can be seen that the spectral content at the second harmonic corresponds to the presence of a bubble on the reconstructed maps. It can also be seen that the center frequency of the response varies slightly between frames, which is expected since the microbubbles used are polydisperse. A strong frequency component is visible around 1 MHz. In some frames this component is stronger than the bubble response (as can be seen later in the in vivo results) and narrow filtering is required to produce an image as seen in Fig. 3. In a separate study we have shown the potential use of single bubbles maps to image beyond the diffraction limit [28].
Fig. 5.
Normalized intensity maps generated with (left) a single frame at 5.3 × 10⁶ bubbles/mL, (centre left) a single frame at 320 bubbles/mL showing one source, (centre right) a single frame at 320 bubbles/ml showing two distinct sources and (right) a time-averaged map of 524 frames captured at 100 Hz PRF, and 320 bubbles/mL. The flow direction is parallel to the y-axis.
Fig. 6.
(Top) Intensity maps corresponding to four spectra shown in (bottom). (Bottom) Normalized power spectra of the beamformed signal at the grid point of maximum intensity from four different frames showing the response at the second harmonic. The thick black line shows the spectrum from a frame in which no bubble response was detected. The remaining three profiles show the frequency response for three frames containing bubbles. The spectra amplitudes are normalized to the frame having the greatest response.
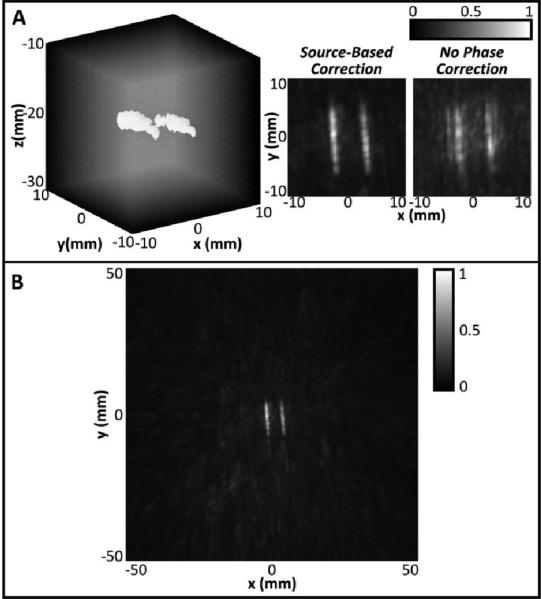
In Fig. 7A, a maximum-pixel projection of two tubes with the highest concentration of microbubbles is shown with the -3 dB isosurfaces illustrated. Z-projection images of the volume are also shown, illustrating the difference between the reconstruction when a skull phase correction technique is used and when no skull correction is used. It is clear that use of a correction technique is needed in order to suppress grating lobes and ensure good image quality. Fig. 7B shows an image of the same two tubes reconstructed over a 10 × 10 × 10 cm3 volume. The signal is well localized to the tubes without any strong grating lobes present in the surrounding field.
Fig. 7.
A: (Left) Maximum pixel projection image of two 0.8 mm diameter tubes with -3dB isosurfaces shown, using source-based skull phase correction. (Center, Right) Z-projection grayscale images of 3D volumes reconstructed using source-based skull phase correction (Center) or no phase correction (Right). B: Maximum pixel z-projection image of the tubes reconstructed over a 10 × 10 × 10 cm3 volume.
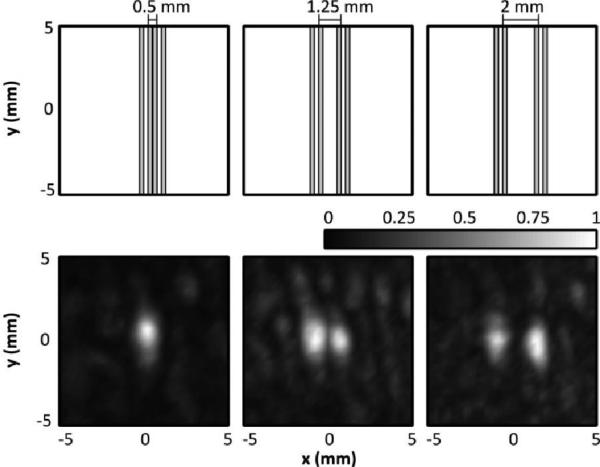
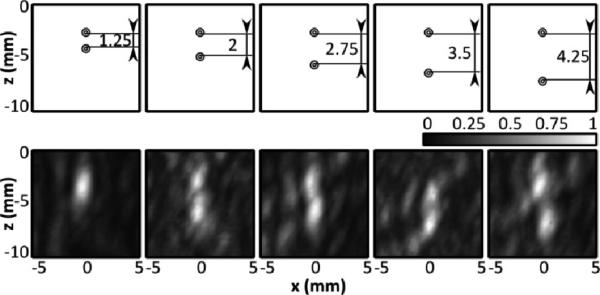
The resolution of the system was experimentally determined for sources close to the geometric focus. In Fig. 8, it can be seen that when the two 0.26 mm internal diameter tubes were in contact with each other they appeared as one source. However, with approximately 1.25 mm spacing the two sources are just resolvable, and at 2 mm spacing they are distinctly separate. Here we define ‘distinctly separate’ as when the intensity between the two peaks is less than 50% (-3dB) of the peak intensity. Thus the lateral resolution of the system likely falls between approximately 1.25 and 2 mm. The axial resolution of the system was inferior to the lateral resolution, which was expected based on the array geometry and the larger simulated [30] and measured PSF in this direction. In Fig. 9 the two sources are spaced axially, and it can be seen that at 1.25 mm spacing they cannot be resolved, while at 4.25 mm spacing they are clearly separate. At 2, 2.75 and 3.5 mm, two sources can be seen, although less distinctly as separate. In fact, at 2.75 mm spacing, the sources are less clearly separated (min. intensity between peaks = 69%) than at 2 or 3.5 mm (min intensities between peaks = 52%, 50%), which could be attributable to the sensitivity of the reconstruction algorithm to source phase offset [30]. Thus there is a transition zone between 2 and 3.5 mm axial spacing, where two sources may be distinguishable as separate depending on their phase offset. In addition, at 3.5 mm spacing, there is an observed displacement in the location of the sources. Repetition of the experiment found that in the 2-3.5 mm transition zone, a deviation in the source locations was observed at some spacings, suggesting that this artifact may occur when two sources are in close proximity and is possibly also dependent on phase offset. The observed deviation (mean ± S.D.) over three repetitions was 1.1 ± 0.5 mm.
Fig. 8.
(Top Row) Scale representation of the tube spacing and orientation for three different tube spacings (inner wall-to-wall = 0.5, 1.25 and 2 mm). (Bottom Row) Normalized maximum pixel projection image of the tubes generated by scanning the transducer focus in the xz-plane, perpendicular to the tube direction.
Fig. 9.
(Top Row) Scale representation of the tube spacing and orientation for five different tube spacings (inner wall-to-wall = 1.25, 2, 2.75, 3.5, 4.25 mm). (Bottom Row) Normalized maximum pixel projection image of the tubes generated by scanning the transducer focus in the xz-plane, perpendicular to the tube direction.
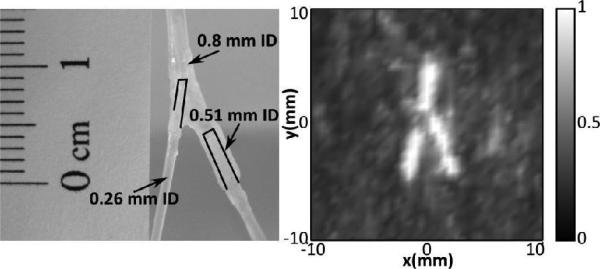
Fig. 10 shows the bifurcated tube phantom constructed with the three different tube sizes and a z-projection image of a flattened volume reconstruction of the tube (2 cm stack). Unlike the two tubes of equal size (Experiment 3, Fig. 7), the signal obtained from the three different tubes produced different maximum intensities, with the signal in the larger tubes being substantially greater (2.1 and 1.7 times larger) than that in the small tube. Therefore, the individual frames were first normalized to themselves, and those where the frame contained only noise were discarded, prior to combining the normalized frames and taking the maximum projection. Included frames had a peak signal intensity greater than 12 times the mean intensity of the entire frame. In the resulting image, the bifurcation can be clearly seen.
Fig. 10.
(Left) Image of bifurcating tube phantom. At the bifurcation point, a tube with an ID of 0.8 mm bifurcates to a tube with an ID of 0.26 mm and a tube with an ID of 0.51 mm. (Right) Z-projection image of a reconstructed volume showing the bifurcation (2 cm stack).
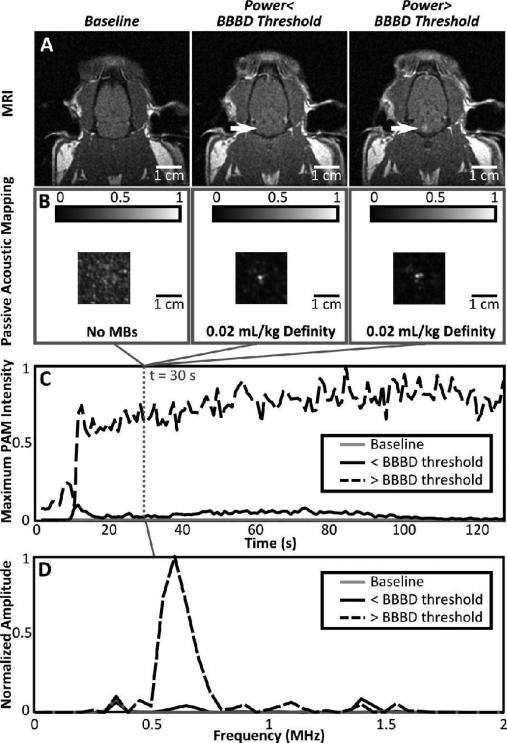
Finally, Fig. 11 shows results from the in vivo testing. T1-weighted MR images are shown at three time points, one baseline image without MRI contrast before FUS, and two contrast-enhanced images taken following each of the two FUS exposures (low power/high power). Correspondingly, passive acoustic maps are shown for a baseline exposure without microbubbles, and for the two FUS exposures with microbubbles. The passive acoustic maps were reconstructed from the captured burst 30 seconds after the start of the sonication. The reconstructed maps represent the lateral plane of peak intensity in the passive map volume. In Fig.11C, the maximum pixel intensity in the passive map corresponding to each frame is plotted for the three sonications (no microbubbles, pressure below BBBD threshold + microbubbles, pressure above BBBD threshold + microbubbles). From Fig. 11 it can be seen that passive maps of cavitation activity can be generated below the threshold for BBB disruption. It is also clear that what is being mapped is microbubble activity and not an artifact, based on the absence of coherent sources in the baseline intensity maps and the presence of bolus wash-in trends in the peak intensity vs. time curves for the FUS sonications with microbubbles. The sonication that produced BBB disruption also had a much greater increase in peak passive map intensity over baseline than the sonication that did not result in disruption. In the frequency domain, we can also see that at baseline, there is no second harmonic content. For the case without BBBD, we observe a small second harmonic content, but still smaller than other frequency content. When the BBB is disrupted, the second harmonic component in the beamformed signal is greatly increased, which is consistent with the literature [10].
Fig. 11.
(A) T1-weighted MR images of the same rat taken without contrast at baseline (left) and with contrast following FUS+MBs at power levels below (middle) and above (right) the threshold for BBBD. (B) Corresponding passive acoustic maps from the burst 30 seconds into the sonication for sonications without MBs (left), with MBs but no BBBD (middle) and with MBs and BBBD (right). The lateral plane of maximum intensity is shown. (C) Plots of the peak passive map intensity as a function of time for each of the three sonications. (D) Frequency spectrum at the point of maximum intensity for a 200 μs time window during the burst 30 seconds into the sonication. Traces are shown at baseline (no bubbles) and for sonications with and without BBBD.
IV. Discussion
The results of this study show that the fabricated array is capable of mapping microbubble activity, down to the single bubble level, at diagnostically safe pressure levels, and would thus be suitable for use in both low and high-intensity therapeutic ultrasound applications. The use of low frequencies both on transmit and receive minimizes the attenuating and aberrating effects of the skull, allowing these single bubble events to be recorded and spatially mapped. Despite the use of low frequencies and a long excitation pulse by diagnostic standards, good imaging resolution can be achieved since resolution in passive imaging is primarily dependent on the array aperture and the source frequency [21], and is not substantially affected by the transmit pulse length [38].
By distributing the receive elements over the entire hemisphere, the imaging resolution is optimized. By comparison, previous studies have utilized narrow aperture linear [23, 24, 38] or planar two-dimensional [39] arrays. For narrow apertures the resolution of passive beamformed images, particularly the axial resolution, is limited even at high frequencies. For example, Gyöngy and Coussios [23] report an axial full width at half maximum of 5 mm for the PSF of a 7.5 MHz source, which is too high of a frequency for trans-skull applications. Here, at submegahertz frequencies, we achieved an axial full width at half maximum of less than 3 mm at the geometric focus through a human skull.
Near the geometric focus the imaging resolution afforded by this system, at the frequency band used in this study, is close to 1.25 mm in the lateral direction, and between 2 and 3.5 mm in the axial direction, in agreement with numerical simulations [30]. This resolution is already on the order of that used in MRI thermometry for monitoring FUS thermal ablation in the brain (voxel size = 1. 1 mm in-plane, 3-5 mm slice thickness [2]). Additionally, the excitation pressures used in this study were maintained within a diagnostically acceptable range. Thus, in its present state, this technology represents a realistic solution for monitoring bubble-mediated FUS interventions, and for bubble-enhanced brain imaging, at least in the mid-brain.
The receiver array could be used with existing monitoring and control schemes for BBB disruption [12, 11], using the spectral information from the received waveforms to control the treatment, and the time-domain data to map the bubble activity. It could also be used monitor other brain treatments, such as cavitation-enhanced stroke treatments [7, 8]. In addition, the passive cavitation mapping could be used to ensure that there is no bubble collapse during thermal ablation of brain tissue since inertial cavitation may increase the risk of hemorrhage [40].
Flow rates in this study ranged between 0.08 mL/min and approximately 7.6 mL/min. Flow rates as high as 127 mL/min have been measured in the middle cerebral artery (MCA) in humans, with a mean vessel diameter of 6.5 mm [41], so the conditions here would model flow in some of the smaller cerebral vessels.
It was observed that with two sources in close proximity, a small displacement artifact might occur. This is hypothesized to be related to the phase-offset between the sources [30] and is thus dependent on the location and separation of the sources in the dome. In future work it might be possible to reduce these artifacts using different excitation pulse schemes.
The image of the bifurcating tube phantom (Fig. 10) required the frames to be normalized to themselves prior to combining them into the final image. The image in Fig. 10 therefore maps the location of the cavitation activity, without regards to the relative strength. Since the intensity values from the larger tubes were substantially larger than the small tube, the small tube was suppressed in the final image if the values were normalized to the maximum intensity in all frames. However, in individual frames where bubbles in the small tube were excited, the signal from the tube was still strong relative to the background.
The in vivo results demonstrated that the bubble activity mapping can be performed without impacting on the Blood-Brain barrier. This is important because it indicates that the method could be used for imaging, as well as confirming sonication targets through a low power sonication before the BBB disrupting sonication is performed. The MR images and passive maps were mis-registered by approximately 5-7 mm in the z-direction. This was thought to have occurred due to the need to move the platform holding the animal between the array and the MRI. In future experiments the experimental fixture will be improved to attempt to minimize this motion error so that the positional agreement between the MRI enhancement and passive maps can be compared. Future experiments will also consider in vivo experiments performed through an ex vivo human skullcap, which was not used here in order to simplify the experiments while establishing feasibility.
This study has several limitations. First, in the bench-top studies a skullcap was used instead of a full cranium. It has not been examined how the reflections from the skull base might affect the images. In this study, short pulses were used to image a target central to the skull cavity. For similar conditions, the reflections from the skull base would likely be separable from the bubble signals. However, challenges might arise when the target is close to the skull or when the transmit pulse is long, and future work should investigate these conditions. It should be noted that several studies have reported the use of very short pulses to disrupt the BBB, and so the work presented here is still highly applicable to therapeutic ultrasound [42, 34, 35]. Reconstruction volumes in this study were generally small, although reconstruction over a more significant volume can be easily be performed (Fig. 7). Additionally, previous numerical analysis suggests that our existing receive array has sufficient field of view to be able to beamform sources anywhere in the skull cavity [30]. However, since the transmit focus is small (FWHM = 2.2 mm laterally, 6.1 mm axially for the full hemispherical transmit array [29]), large reconstruction volumes may not be necessary to apply these beamforming methods for directing ultrasound therapy. Finally, phase correction through the skull was performed using a source based correction method. However, without phase correction some targets were still imageable (Fig. 7), and non-invasive phase correction techniques based on computed tomography (CT) derived bone-density information could be used to correct for the skull aberrations [37, 43] on receive [30] when CT data are available. One of these methods [37] is currently used in clinical treatments for precise focusing of the therapy beam [1, 2, 3].
One notable limitation of this method is that absolute intensities in the resulting activity maps cannot be directly compared. For bubble clouds the resulting signal is influenced by bubbles that are not spatially resolvable and that may be oscillating at different phases. As a result, absolute intensity values may provide less information than the spatial extent of the cavitation activity or the frequency content. For the case of a single bubble, the response of individual bubbles is expected to vary since the bubble population is polydisperse and thus will have different resonant frequencies. Analysis of single bubble responses using this technique could provide a means to investigate bubble properties in the vasculature and should be investigated in the future.
The image formation in this study was performed offline on a standard CPU (Dell Vostro 420, Intel Core2 Quad CPU), and for a voxel size of 0.5 × 0.5 × 0.5 mm3, reconstruction of a 20 × 20 × 20 mm3 volume from a single excitation pulse took approximately 64 seconds. Recently we have implemented this algorithm on a graphics processing unit (NVIDIA Tesla K20, 5 GB Memory) and achieved reconstruction times of under 100 ms for the same volume and voxel dimensions. Thus this technique can be implemented with available technology to image cavitation activity in real-time during ultrasound therapy.
V. Conclusion
A 128-channel sparse hemispherical receiver array has been constructed that is capable of passively imaging microbubble activity transcranially and on the scale of single bubbles. This study shows the feasibility of three-dimensional mapping of microbubble activity for monitoring of therapeutic ultrasound procedures in the brain. Initial in vivo results demonstrate that bubble activity can be mapped below the threshold for BBB disruption. Future work will focus on comprehensive in vivo testing of the array.
Acknowledgments
The authors would like to thank S. Rideout-Gros and A. Garces for their assistance with the in vivo experiments, and E. Ye for his assistance in implementing the reconstruction algorithms on the GPU.
This work was supported by the National Institutes of Health under grant numbers R01-EB009032 and R01-EB003268, as well as the Canada Research Chair Program.
Acknowledgments
This work was supported by the National Institutes of Health under grant numbers R01-EB009032 and R01-EB003268, as well as the Canada Research Chair Program.
Contributor Information
Meaghan A. O'Reilly, Sunnybrook Research Institute, Toronto, Canada..
Ryan M. Jones, Sunnybrook Research Institute, Toronto, Canada and the Department of Medical Biophysics, University of Toronto, Canada.
Kullervo Hynynen, Sunnybrook Research Institute, Toronto, Canada, and the Department of Medical Biophysics and Institute of Biomaterials and Biomedical Engineering, University of Toronto, Canada.
References
- 1.Martin E, Jeanmonod D, Morel A, Zadicario E, Werner B. High-intensity focused ultrasound for noninvasive functional neurosurgery. Ann Neurol. 2009;66(6):858–861. doi: 10.1002/ana.21801. [DOI] [PubMed] [Google Scholar]
- 2.McDannold N, Clement GT, Black P, Jolesz F, Hynynen K. Transcranial magnetic resonance imaging- guided focused ultrasound surgery of brain tumors: initial findings in 3 patients. Neurosurgery. 66(2):323–32. doi: 10.1227/01.NEU.0000360379.95800.2F. discussion 332, 2010. [DOI] [PMC free article] [PubMed] [Google Scholar]
- 3.Lipsman N, Schwartz ML, Huang Y, Lee L, Sankar T, Chapman M, Hynynen K, Lozano AM. Mr-guided focused ultrasound thalamotomy for essential tremor: a proof-of-concept study. Lancet Neurol. 2013;12(5):462–468. doi: 10.1016/S1474-4422(13)70048-6. [DOI] [PubMed] [Google Scholar]
- 4.Hynynen K, McDannold N, Vykhodtseva N, Jolesz F. Noninvasive mr imaging-guided focal opening of the blood-brain barrier in rabbits. Radiology. 2001;220(3):640–646. doi: 10.1148/radiol.2202001804. [DOI] [PubMed] [Google Scholar]
- 5.Choi J, Pernot M, Small S, Konofagou E. Noninvasive, transcranial and localized opening of the blood-brain barrier using focused ultrasound in mice. Ultrasound Med. Biol. 2007;33(1):95–104. doi: 10.1016/j.ultrasmedbio.2006.07.018. [DOI] [PubMed] [Google Scholar]
- 6.Chen P-Y, Liu H-L, Hua M-Y, Yang H-W, Huang C-Y, Chu P-C, Lyu L-A, Tseng I-C, Feng L-Y, Tsai H-C, Chen S-M, Lu Y-J, Wang J-J, Yen T-C, Ma Y-H, Wu T, Chen J-P, Chuang J-I, Shin J-W, Hsueh C, Wei K-C. Novel magnetic ultrasound focusing system enhances nanoparticle drug delivery for glioma treatment. Neuro Oncol. 2010;12(10):1050–1060. doi: 10.1093/neuonc/noq054. [DOI] [PMC free article] [PubMed] [Google Scholar]
- 7.Culp WC, Flores R, Brown AT, Lowery JD, Roberson PK, Hennings LJ, Woods SD, Hatton JH, Culp BC, Skinner RD, Borrelli MJ. Successful microbubble sonothrombolysis without tissue-type plasminogen activator in a rabbit model of acute ischemic stroke. Stroke. 2011;42(8):2280–2285. doi: 10.1161/STROKEAHA.110.607150. [DOI] [PMC free article] [PubMed] [Google Scholar]
- 8.Burgess A, Huang Y, Waspe AC, Ganguly M, Goertz DE, Hynynen K. High-intensity focused ultrasound (hifu) for dissolution of clots in a rabbit model of embolic stroke. PLoS One. 2012;7(8):e42311. doi: 10.1371/journal.pone.0042311. [DOI] [PMC free article] [PubMed] [Google Scholar]
- 9.McDannold N, Arvanitis CD, Vykhodtseva N, Livingstone MS. Temporary disruption of the blood-brain barrier by use of ultrasound and microbubbles: safety and efficacy evaluation in rhesus macaques. Cancer Res. 2012;72(14):3652–3663. doi: 10.1158/0008-5472.CAN-12-0128. [DOI] [PMC free article] [PubMed] [Google Scholar]
- 10.McDannold N, Vykhodtseva N, Hynynen K. Targeted disruption of the blood-brain barrier with focused ultrasound: association with cavitation activity. Phys Med Biol. 2006;51(4):793–807. doi: 10.1088/0031-9155/51/4/003. [DOI] [PubMed] [Google Scholar]
- 11.Arvanitis CD, Livingstone MS, Vykhodtseva N, McDannold N. Controlled ultrasound-induced blood-brain barrier disruption using passive acoustic emissions monitoring. PLoS One. 2012;7(9):e45783. doi: 10.1371/journal.pone.0045783. [DOI] [PMC free article] [PubMed] [Google Scholar]
- 12.O'Reilly MA, Hynynen K. Blood-brain barrier: real-time feedback-controlled focused ultrasound disruption by using an acoustic emissions-based controller. Radiology. 2012;263(1):96–106. doi: 10.1148/radiol.11111417. [DOI] [PMC free article] [PubMed] [Google Scholar]
- 13.Atchley AA, Frizzell LA, Apfel RE, Holland CK, Madanshetty S, Roy RA. Thresholds for cavitation produced in water by pulsed ultrasound. Ultrasonics. 1988;26(5):280–285. doi: 10.1016/0041-624x(88)90018-2. [DOI] [PubMed] [Google Scholar]
- 14.Roy RA, Madanshetty SI, Apfel RE. An acoustic backscattering technique for the detection of transient cavitation produced by microsecond pulses of ultrasound. J Acoust Soc Am. 1990;87(6):2451–2458. doi: 10.1121/1.399091. [DOI] [PubMed] [Google Scholar]
- 15.Madanshetty SI, Roy RA, Apfel RE. Acoustic microcavitation: its active and passive acoustic detection. J Acoust Soc Am. 1991;90(3):1515–1526. doi: 10.1121/1.401891. [DOI] [PubMed] [Google Scholar]
- 16.Rabkin BA, Zderic V, Vaezy S. Hyperecho in ultrasound images of hifu therapy: involvement of cavitation. Ultrasound Med Biol. 2005;31(7):947–956. doi: 10.1016/j.ultrasmedbio.2005.03.015. [DOI] [PubMed] [Google Scholar]
- 17.Farny CH, Holt RG, Roy RA. Temporal and spatial detection of hifu-induced inertial and hot-vapor cavitation with a diagnostic ultrasound system. Ultrasound Med Biol. 2009;35(4):603–615. doi: 10.1016/j.ultrasmedbio.2008.09.025. [DOI] [PubMed] [Google Scholar]
- 18.Gateau J, Aubry J-F, Chauvet D, Boch A-L, Fink M, Tanter M. In vivo bubble nucleation probability in sheep brain tissue. Phys Med Biol. 2011;56(22):7001–7015. doi: 10.1088/0031-9155/56/22/001. [DOI] [PubMed] [Google Scholar]
- 19.Sato T, Uemura K, Sasaki K. Super-resolution acoustical passive imaging system using algebraic reconstruction. Journal of the Acoustical Society of America. 1980;67(5):1802–1808. [Google Scholar]
- 20.Norton SJ, Linzer M. Backprojection reconstruction of random source distributions. Journal of the Acoustical Society of America. 1987;81:977–985. [Google Scholar]
- 21.Norton SJ, Won IJ. Time exposure acoustics. IEEE T Geosci Remote. 2000;38(3):1337–1343. [Google Scholar]
- 22.Salgaonkar VA, Datta S, Holland CK, Mast TD. Passive cavitation imaging with ultrasound arrays. J Acoust Soc Am. 2009;126(6):3071–3083. doi: 10.1121/1.3238260. [DOI] [PMC free article] [PubMed] [Google Scholar]
- 23.Gyöngy M, Coussios C-C. Passive spatial mapping of inertial cavitation during hifu exposure. IEEE Trans Biomed Eng. 2010;57(1):48–56. doi: 10.1109/TBME.2009.2026907. [DOI] [PubMed] [Google Scholar]
- 24.Jensen CR, Ritchie RW, Gyöngy M, Collin JRT, Leslie T, Coussios C-C. Spatiotemporal monitoring of high-intensity focused ultrasound therapy with passive acoustic mapping. Radiology. 2012;262(1):252–261. doi: 10.1148/radiol.11110670. [DOI] [PubMed] [Google Scholar]
- 25.Arvanitis CD, Livingstone MS, McDannold N. Combined ultrasound and mr imaging to guide focused ultrasound therapies in the brain. Physics in Medicine and Biology. 2013;58(14):4749. doi: 10.1088/0031-9155/58/14/4749. [DOI] [PMC free article] [PubMed] [Google Scholar]
- 26.Smith SW, Ivancevich NM, Lindsey BD, Whitman J, Light E, Fronheiser M, Nicoletto HA, Laskowitz DT. The ultrasound brain helmet: feasibility study of multiple simultaneous 3d scans of cerebral vasculature. Ultrasound Med Biol. 2009;35(2):329–338. doi: 10.1016/j.ultrasmedbio.2008.08.016. [DOI] [PubMed] [Google Scholar]
- 27.Lindsey BD, Light ED, Nicoletto HA, Bennett ER, Laskowitz DT, Smith SW. The ultrasound brain helmet: new transducers and volume registration for in vivo simultaneous multi-transducer 3-d transcranial imaging. IEEE Trans Ultrason Ferroelectr Freq Control. 2011;58(6):1189–1202. doi: 10.1109/TUFFC.2011.1929. [DOI] [PMC free article] [PubMed] [Google Scholar]
- 28.O'Reilly MA, Hynynen K. A super-resolution ultrasound method for brain vascular mapping. Medical Physics. 2013;40(11):110701. doi: 10.1118/1.4823762. [DOI] [PMC free article] [PubMed] [Google Scholar]
- 29.Song J, Hynynen K. Feasibility of using lateral mode coupling method for a large scale ultrasound phased array for noninvasive transcranial therapy. IEEE Trans Biomed Eng. 2010;57(1):124–133. doi: 10.1109/TBME.2009.2028739. [DOI] [PMC free article] [PubMed] [Google Scholar]
- 30.Jones RM, O'Reilly MA, Hynynen K. Transcranial passive acoustic mapping with hemispherical sparse arrays using ct-based skull-specific aberration corrections: a simulation study. Phys Med Biol. 2013;58(14):4981–5005. doi: 10.1088/0031-9155/58/14/4981. [DOI] [PMC free article] [PubMed] [Google Scholar]
- 31.Ebbini ES, Yao H, Shrestha A. Dual-mode ultrasound phased arrays for image-guided surgery. Ultrason Imaging. 2006;28(2):65–82. doi: 10.1177/016173460602800201. [DOI] [PubMed] [Google Scholar]
- 32.Casper AJ, Liu D, Ballard JR, Ebbini ES. Real-time implementation of a dual-mode ultrasound array system: in vivo results. IEEE Trans Biomed Eng. 2013;60(10):2751–2759. doi: 10.1109/TBME.2013.2264484. [DOI] [PMC free article] [PubMed] [Google Scholar]
- 33.Hynynen K, Jolesz FA. Demonstration of potential noninvasive ultrasound brain therapy through an intact skull. Ultrasound Med Biol. 1998;24(2):275–283. doi: 10.1016/s0301-5629(97)00269-x. [DOI] [PubMed] [Google Scholar]
- 34.O'Reilly MA, Waspe AC, Ganguly M, Hynynen K. Focused-ultrasound disruption of the blood-brain barrier using closely-timed short pulses: influence of sonication parameters and injection rate. Ultrasound Med Biol. 2011;37(4):587–594. doi: 10.1016/j.ultrasmedbio.2011.01.008. [DOI] [PMC free article] [PubMed] [Google Scholar]
- 35.Choi JJ, Selert K, Vlachos F, Wong A, Konofagou EE. Proc Natl Acad Sci U S A. Vol. 108. 40; 2011. Noninvasive and localized neuronal delivery using short ultrasonic pulses and microbubbles. pp. 16539–16544. [DOI] [PMC free article] [PubMed] [Google Scholar]
- 36.Pichardo S, Sin VW, Hynynen K. Multi-frequency characterization of the speed of sound and attenuation coefficient for longitudinal transmission of freshly excised human skulls. Phys Med Biol. 2011;56(1):219–250. doi: 10.1088/0031-9155/56/1/014. [DOI] [PMC free article] [PubMed] [Google Scholar]
- 37.Clement GT, Hynynen K. A non-invasive method for focusing ultrasound through the human skull. Phys Med Biol. 2002;47(8):1219–1236. doi: 10.1088/0031-9155/47/8/301. [DOI] [PubMed] [Google Scholar]
- 38.Haworth KJ, Mast TD, Radhakrishnan K, Burgess MT, Kopechek JA, Huang S-L, McPherson DD, Holland CK. Passive imaging with pulsed ultrasound insonations. J Acoust Soc Am. 2012;132(1):544–553. doi: 10.1121/1.4728230. [DOI] [PMC free article] [PubMed] [Google Scholar]
- 39.Coviello CM, Kozick RJ, Hurrell A, Smith PP, Coussios C-C. Thin-film sparse boundary array design for passive acoustic mapping during ultrasound therapy. IEEE Trans Ultrason Ferroelectr Freq Control. 2012;59(10):2322–2330. doi: 10.1109/TUFFC.2012.2457. [DOI] [PubMed] [Google Scholar]
- 40.Hynynen K, Chung AH, Colucci V, Jolesz FA. Potential adverse effects of high-intensity focused ultrasound exposure on blood vessels in vivo. Ultrasound Med Biol. 1996;22(2):193–201. doi: 10.1016/0301-5629(95)02044-6. [DOI] [PubMed] [Google Scholar]
- 41.Stock KW, Wetzel SG, Lyrer PA, Radü EW. Quantification of blood flow in the middle cerebral artery with phase-contrast mr imaging. Eur Radiol. 2000;10(11):1795–1800. doi: 10.1007/s003300000378. [DOI] [PubMed] [Google Scholar]
- 42.Bing KF, Howles GP, Qi Y, Palmeri ML, Nightingale KR. Blood-brain barrier (bbb) disruption using a diagnostic ultrasound scanner and definity in mice. Ultrasound Med Biol. 2009;35(8):1298–1308. doi: 10.1016/j.ultrasmedbio.2009.03.012. [DOI] [PMC free article] [PubMed] [Google Scholar]
- 43.Aubry JF, Tanter M, Pernot M, Thomas JL, Fink M. Experimental demonstration of noninvasive transskull adaptive focusing based on prior computed tomography scans. J Acoust Soc Am. 2003;113(1):84–93. doi: 10.1121/1.1529663. [DOI] [PubMed] [Google Scholar]


