


Abstract
The Staphylococcus aureus genome contains three toxin–antitoxin modules, including one mazEF module, SamazEF. Using an on-column separation protocol we are able to obtain large amounts of wild-type SaMazF toxin. The protein is well-folded and highly resistant against thermal unfolding but aggregates at elevated temperatures. Crystallographic and nuclear magnetic resonance (NMR) solution studies show a well-defined dimer. Differences in structure and dynamics between the X-ray and NMR structural ensembles are found in three loop regions, two of which undergo motions that are of functional relevance. The same segments also show functionally relevant dynamics in the distantly related CcdB family despite divergence of function. NMR chemical shift mapping and analysis of residue conservation in the MazF family suggests a conserved mode for the inhibition of MazF by MazE.
INTRODUCTION
Pathogenic bacteria are adept at responding to environmental changes. Chromosomal toxin–antitoxin (TA) modules are thought to facilitate these responses by altering gene transcription and translation. TA modules are small operons encoding two proteins: a ‘toxin’ that interferes with basic cellular metabolism, usually translation or transcription, and an ‘antitoxin’ that neutralizes the toxin and protects the cell from its potentially destructive activity (for reviews see 1–4).
TA modules are activated upon environmental stress (e.g. antibiotics or nutritional stress) through proteolytic degradation of the antitoxin (5–10). Under normal growth conditions, the antitoxin and toxin genes are transcribed and translated together, thus leading to the formation of an inert TA complex. This complex also acts as an auto-repressor, limiting the number of TA proteins present in the cytoplasm via a mechanism termed ‘conditional cooperativity’ (11–14). Several unrelated families of TA modules exist that differ in terms of amino acid sequence and biochemical activities of the toxin. The latter include ribosome-dependent and ribosome-independent degradation of mRNA (15–19), phosphorylation of elongation factor Tu and glutamyl-tRNA synthetase (19,20), or poisoning of gyrase (21–26).
The mazEF module was initially discovered on plasmids R1 and R100 where it was termed kis/kid and pemIK, respectively, and contributes to plasmid stability (27,28). It was the first so-called plasmid addiction system for which homologues were discovered in bacterial chromosomes (29,30). Subsequent bioinformatics analyses have shown that the mazEF family is widely distributed in the genomes of both Gram-negative and Gram-positive bacteria, but seems to be absent in Archeae (31–34). The toxin MazF is activated under a number of stressful conditions via proteolytic degradation of its neutralizing antitoxin MazE by the ClpPA or Lon proteases, (18,30,35) and was proposed to be under control of quorum sensing (36). Prolonged over-expression of MazF leads to cell death (37).
Escherichia coli MazF (EcMazF) was shown to degrade mRNA in a sequence-specific manner without the requirement of the mRNA being bound to the ribosome or actively being translated (17,35,38). This activity was later confirmed for a number of family members from different organisms or plasmids and it was shown that the exact RNA cleavage specificity may vary, although most (but not all) identified cutting sequences contain an ACA motif (39–44). The RNase activity of MazF proteins was proposed to result in selective degradation of the cellular pool of mRNAs, leading to a shift in the expression profile toward a subset of proteins (45–47). Later on, it was demonstrated that EcMazF also cuts ribosomal RNA, and that the resulting modified ribosomes specifically translate leader-less mRNA that also results from MazF-specific mRNA cleavage (48,49). Recently, evidence was presented that a MazF homolog from Mycobacterium halts translation through cleavage of the 23S rRNA (50).
TA modules including mazEF modules have been well studied in Gram-negative bacteria, in particular E. coli and Mycobacterium tuberculosis. Next to ‘classic’ mazEF modules where both toxin and antitoxin can be clearly identified as MazF and MazE family members (e.g. Bacillus subtilis; (43)), Gram-positive bacteria also contain variants type of mazEF modules where the antitoxin is unusually short and possibly unrelated to the classic MazE proteins. This is the case of the sole mazEF module found in the chromosomes of several Staphylococcus species including MRSA strains (51). Transcription regulation and activation of Staphylococcus aureus mazEF (SamazEF) differs from what is observed in Gram-negative bacteria (52). Rather than being autoregulated as is usually observed in TA modules, SamazEF is linked to the sigB operon that is located immediately downstream and with which it is co-transcribed. In addition, the transcription regulator SarA binds and activates the SamazEF promoter.
In this paper, we present a method to obtain large quantities of active SaMazF and provide the structure of this protein as determined by nuclear magnetic resonance (NMR) and X-ray crystallography. The structural and dynamic properties of SaMazF are compared to its E. coli and B. subtilis counterparts as well as to CcdB family members, which adopt the same fold but function as gyrase poisons rather than ribonucleases.
MATERIALS AND METHODS
Cloning, expression and purification of SaMazF
The cloning and expression of the samazE and samazF genes was described previously (53,54). Cells were grown in unlabeled LB medium or in 13C15N-enriched minimal medium (SPECTRA 9 from Cambridge Isotope Laboratories). The cells were harvested by centrifugation for 25 min at 5500 rpm with Beckman JLA 81000 rotor and the pellet was resuspended in 50 ml of lysis buffer (100 mM Tris-HCl pH 8.0, 1 M NaCl, 20 mM imidazole, 0.1 mg/ml AESBF and 1 μg/ml leupeptin, DNase I 50 μg/ml, MgCl2 20 mM). The cell suspension was lysed by passing it twice through a cell cracker (10 000–15 000 psi) and subsequently centrifuged for 30 min at 18 000 rpm (Beckman JA-20 rotor).
The supernatant was filtered through a 45 μm filter and loaded on a pre-packed column of 1 ml Ni-NTA resin (Qiagen) pre-equilibrated with 10 column volumes of washing buffer (20 mM Tris-HCl pH 7.0, 300 mM NaCl, 20 mM imidazole). The column was further washed with the same buffer until the OD280 nm stabilizes. Subsequently, a linear (0–3 M over 15 column volumes) guanidinium hydrochloride (GdHCl) gradient is applied in 50 mM Tris-HCl pH 7.0, 500 mM NaCl, which elutes SaMazE. The column is further washed with 5 column volumes of the same GdHCl-containing buffer, after which the GdHCl concentration is linearly decreased while at the same time adding a 0–1 M imidazole gradient in the same buffer.
SaMazF elutes in 2.75 M GdHCl. The SaMazF-containing fractions were diluted using refolding buffer (50 mM Tris-HCl pH 7.0, 500 mM NaCl, 500 mM L-Arg) to obtain a final concentration of 0.2 M GdHCl. The protein solution was subsequently dialyzed against this refolding buffer for two times 4 h at 277 K. The protein solution was then dialyzed overnight in 20 mM Tris-HCl pH 7.0, 250 mM NaCl.
In a last polishing step, SaMazF is loaded on a Superdex 75PG 16/90 column equilibrated with 20 mM Tris-HCl pH 7.0, 250 mM NaCl to remove any remaining contaminants. The purity of the sample was determined by SDS-PAGE analysis in presence of β-mercaptoethanol. SaMazF concentrations were determined spectrophotometrically by measuring the absorbance at 280 nm using a theoretical extinction coefficient of 5960 M−1 cm−1 calculated from the amino acid sequence according to (55).
In vitro ribonuclease assay
Bacteriophage MS2 genomic RNA (10 mM Tris-HCl pH 7.0, 1.0 mM EDTA) was obtained from Roche Applied Science. Mixtures of 0.25 μl of RNA (0.8 μg/μl), 2.5 μl or 5 μl of SaMazF, 5 μl of SaMazE or 2.5 μl SaMazF + 5 μl of SaMazE (final concentration of 1 μM or 2 μM SaMazF, 1 μM SaMazE or 1 μM SaMazF + 5 μM SaMazE) in a 10 μl final reaction volume (buffer: 20 mM Tris-HCl pH 7.0, 75 mM NaCl) were incubated at 37°C for 1 h. Samples were loaded on a 6% polyacrylamide gel containing 7 M urea. The gel was stained in water and ethidium bromide. The low range ssRNA ladder of 50, 80, 150, 300, 500, 1000 bases was bought from New England Biolabs Inc.
In vivo activity assay
Non-tagged, N-terminal and C-terminal his-tagged SamazF sequences were cloned under control of the Plac promoter in a pTrc99a expression plasmid. These constructs were transformed in E. coli strain DH5α and plated on LB medium supplemented with 0.2% glucose. Transformants were tested for in vivo activity by streaking the same colonies on LB medium with glucose and LB medium with isopropyl β-D-thiogalactopyranoside (1 μM) to induce the Plac promoter. Non-growing colonies after IPTG induction were considered producing active SaMazF.
Mass spectrometry
Purified SaMazF was extensively dialyzed against water and subsequently further desalted and concentrated using C18 spin columns (Thermo Scientific) according to the manufacturer's instructions except that proteins were eluted with 60 μl of 70% acetonitrile in water containing 0.1% formic acid (v/v). Hundred microliters of this SaMazF sample was further diluted using a 50:50 acetonitrile/water mixture containing 0.1% (v/v) formic acid to an approximate final concentration of 5 μM.
The sample was introduced by off-line infusion using a capillary electrospray at 1.5 μl/min into an LTQ XL mass spectrometer (LTQ XL, Thermo Fisher Scientific). Mass spectra with m/z from 400 to 2000 were acquired in centroid mode. Electrospray source conditions such as ‘source fragmentation’ voltage and the tube lens voltage were optimized to help desolvation but without fragmenting the intact protein. Default values were used for most other data acquisition parameters. The resulting spectra were averaged up to 200 scans and were de-convoluted using ProMass software (Thermo Fisher Scientific).
Analytical gel filtration
A SuperdexHR75 10/30 column (GE Health-care) equilibrated with 20 mM Tris-HCl, pH 8.0, 250 mM NaCl was calibrated with standard proteins: γ-globulin bovine (158.0 kDa), ovalbumin (44.0 kDa), CcdB (25.0 kDa), myoglobin (17.0 kDa) and vitamin B12 (1.35 kDa). Purified SaMazF was run at 3.3 mg/ml in the above buffer solution. The flow rate was maintained at 0.5 ml/min, and the elution volumes and absorbance at 280 nm were recorded.
Multi-angle light scattering
Size exclusion chromatography (SEC) coupled with multi-angle light scattering (MALS) was performed at room temperature using a Shodex packed HPLC column (Showa Denko Europe GmbH, Germany) connected to a Wyatt Technology MALS instrument. A 50 μl aliquot of protein (spinned for 30 min at 20 000 rpm in a microcentrifuge) was loaded onto the column and eluted at a flow rate of 0.2 ml/min in 20 mM Tris-HCl pH 7.0, 300 mM NaCl. The molar mass of the pure protein was calculated from the observed light scattering intensity using a refractive index (dn/dc) of 0.185 ml/g. The instrument was previously calibrated with bovine serum albumin (BSA) as standard (BSA dimer = 134 kDa and BSA monomer = 66 kDa). The results were analyzed using the ASTRA software (Wyatt Technologies, Inc.).
Dynamic light scattering
Dynamic light scattering (DLS) data of SaMazF were collected in 10 mm diameter cylindrical cuvettes at an angle of 90º employing an ALV-CGS-3 static and DLS device using a 22 mW He–Ne laser with a wavelength λ = 632.8 nm. The protein concentration of the 200 nm filtered SaMazF samples was 1 mg/ml in 20 mM Tris-HCl pH 7.0, 75 mM NaCl and the range of temperature selected was from 293 K to 343 K. Measurements on SaMazF were also done in the same buffer at 293 K, but with 3 M GdHCl added. Measurements on 70 nm diameter colloidal gold nano-particles (0.01 mg/ml) were used as a control to compensate for the difference in viscosity caused by the presence of GdHCl. Correlograms were recorded continuously at a fixed temperature. Data were collected in a pseudo cross-correlation setup to minimize the contribution of dead time effects and photomultiplier tube-generated artifacts after-pulsing to the recorded signal. The digital correlator outputs, from the recorded temporal dependence of the scattered intensity, the intensity autocorrelation function g2(τ)−1 with τ the delay time (56). This function g2(τ) is connected to the electric field correlation function g1(τ) through the Siegert relation
 |
(1) |
where B is the baseline of the correlation function at infinite delay and β the function value at zero delay. For a mono-disperse solution, g1(τ) is a single exponential decay g1(τ) = exp (−Γτ) with the decay rate Γ = Dq2 defined by the diffusion coefficient D of the particles and the magnitude of the scattering vector q = 4πn0/λ sin (θ/2) at the scattering angle θ.
DLS data were captured at fixed concentrations of SaMazF at 308 K and 318 K for the total time of ∼ 4 days, at 328 K for ∼ 3 days and at 343 K for 32 h. All intensity correlation curves were fit with two exponentials.
CD spectroscopy
Far-UV CD spectra were recorded on a J-715 spectropolarimeter (Jasco). Scans were taken using a 1 mm cuvette. Spectra of SaMazF (0.2 mg/ml) were measured using different buffers in order to find the suitable buffer conditions for further experiments: 20 mM Na-phosphate pH 7.0 with 0, 75 or 300 mM NaCl, 20 mM Tris-HCl pH 7.0 with 0, 75 or 300 mM NaCl, 20 mM Na-acetate pH 5.0 and 75 mM NaCl, 20 mM Na-cacodylate pH 6.0 and 75 mM NaCl, 20 mM Na-borate pH 8.0 and 75 mM NaCl. To assess the effect of GdHCl on the structure of SaMazF during the on-column separation procedure, an additional CD spectrum was recorded in 20 mM Na-phosphate pH 7.0, 75 mM NaCl, 3 M GdHCl. To minimize GdHCl absorption, a 0.2 mm cuvette was used and the SaMazF concentration was 1 mg/ml. The mean residue ellipticities ([θ], degrees cm2 mol−1) were obtained from the raw data after correcting for absorption of the buffer solution according to [θ] = θ.Mw/(N.c.l), where Mw is the molecular weight, c is the mass concentration, l is the optical path length, and N is the number of amino acid residues. The temperature of the cuvette was monitored using a thermoelectric Peltier device connected with a water bath. Secondary structure predictions from CD data were performed using the CDSSTR method developed by Johnson (57,58).
Small-angle X-ray scattering
Small-angle X-ray scattering (SAXS) data were collected in batch mode at beamline ID14-2 of the ESRF synchrotron (Grenoble, France) using a concentration series (0.5, 1.0, 3.0, 5.0 and 7.0 mg/ml) of SaMazF in 20 mM Tris-HCl pH 7.0, 300 mM NaCl. The data were averaged, background-subtracted and merged to generate the scattering curve with PRIMUS (59). The radius of gyration (Rg) was calculated from the Guinier analysis as implemented in PRIMUS and also from the entire scattering curve with the indirect Fourier Transform package GNOM (59,60). CRYSOL (61) was used to compare experimental and theoretical scattering curves. We used MODELLER (62) to model the missing residues and atoms of the ensemble consisting of all the crystal structures. The experimentally determined X-ray structures of SaMazF suffice to explain to a large extent the experimental SAXS data. Therefore, the final model obtained with MODELLER (63) introduces the missing flexible C-terminus and N-terminal His-tag as well as a few missing residues in loop regions of certain monomers. The latter only results in minor structural variations in their immediate neighborhoods within the general variation seen among the different X-ray models. To define the minimal set of X-ray or NMR models that can explain the SAXS data, the minimal ensemble algorithm (Minimal Ensemble Search, MES) was used (64). This algorithm searches for the minimal ensemble set of conformations from the pool of all given conformations, systematically evaluating combinations of five models or less.
X-ray crystallography
Crystallization conditions from Crystal Screen I and II (Hampton Research) were screened manually using the hanging drop method in 48-well plate (Hampton Research). The final successful crystallization conditions are given in Table 1. All data were collected at the PROXIMA-1 beamline of the SOLEIL synchrotron (St-Aubin, France). Data were scaled and merged using the HKL-2000 program package (65). Data collection statistics are given in Table 1. All structures were solved by molecular replacement using PHASER as implemented in the CCP4 package. For crystal form I, the coordinates of YdcE from B. subtilis (PDB entry 1NE8) were used as search model, while for the other crystal forms the refined coordinates of the dimer consisting of chains A and B of crystal form I were used.
Table 1.
Crystallization, data collection and refinement
| Form I | Form II | Form III | |
|---|---|---|---|
| Crystallization | |||
| Protein solution | 20 mg/ml in 20 mM Tris-HCl pH 7.5, 150 mM NaCl | 10 mg/ml in 20 mM Na2HPO4/ NaH2PO4 pH 6.6 | 5.5 mg/ml in 20 mM Na2HPO4/ NaH2PO4 pH 6.6 |
| Well solution | 0.2 M NH4Ac, 0.1 M NaAc pH 4.6, 30% (w/v) PEG 4000 | 0.1 M Na-HEPES pH 7.5, 2.0 M NH4HCO2 | 2.0 M (NH4)2SO4, |
| 0.1 M NaAc pH 4.6 | |||
| Drop contents | 1 μl protein + 1 μl precipitant | 1 μl protein + 1 μl precipitant | 1 μl protein + 1 μl precipitant |
| Cryoprotection | No additional cryoprotectant added | 0.075 M Na-HEPES pH 7.5, 1.4 M NH4HCO2, 30% (v/v) glycerol | 1.6 M (NH4)2SO4, |
| 0.08 M NaAc pH 4.6, 20% (v/v) glycerol | |||
| Data collection | |||
| Resolution range (Å) | 56.34–2.10 (2.16−2.10) | 46.0–2.3 (2.53–2.30) | 39.2–2.7 (2.78–2.70) |
| Space group | P212121 | C2221 | C2221 |
| Unit cell (Å) | a = 60.72 | a = 72.58 | a = 90.88 |
| b = 65.36 | b = 92.00 | b = 92.63 | |
| c = 112.01 | c = 71.52 | c = 222.37 | |
| Mosaicity (°) | 0.21–0.61 | 0.36–0.58 | 0.69–0.88 |
| Total no. of measured intensities | 144 316 | 210 742 | 87 263 |
| Unique reflections | 26 598 (2150) | 10 915 (1930) | 25 526 (2057) |
| Multiplicity | 5.4 (4.2) | 5.7 (5.8) | 3.4 (3.4) |
| Mean I/σ(I) | 14.0 (3.4) | 11.2 (3.5) | 13.3 (2.9) |
| Completeness (%) | 99.8 (98.8) | 99.8 (99.9) | 98.0 (97.7) |
| Rsym | 0.104 (0.341) | 0.137 (0.734) | 0.093 (0.406) |
| Wilson B factor (Å2) | 30.3 | 26.4 | 53.2 |
| Solvent content (%) | 34 | 38 | 36 |
| Refinement | |||
| Rcryst | 0.175 (0.163) | 0.195 (0.220) | 0.208 (0.274) |
| Rfree | 0.228 (0.237) | 0.248 (0.319) | 0.242 (0.326) |
| Most favored regions (%) | 98.1 | 98.2 | 94.7 |
| Allowed regions (%) | 1.9 | 1.8 | 4.6 |
| Disallowed regions (%) | 0.0 | 0.0 | 0.7 |
| RMSD bond lengths (Å) | 0.013 | 0.009 | 0.014 |
| RMSD bond angles (º) | 1.18 | 1.29 | 1.33 |
| Content of the asymmetric unit | Two dimers | One dimer | Four dimers |
| Average B-factor of all atoms (Å2) | 36.6 | 35 | 46.2 |
| Average B-factor of solvent atom (Å2) | 39.9 | 38.4 | - |
| No. of protein atoms | 3615 | 1743 | 6712 |
| Total no. of missing residues | 86 | 39 | 146 |
| No. of missing residues/chain (N-term, loop, C-term) | |||
| Monomer A | 12, 0, 6 | 12, 0, 7 | 13, 0, 6 |
| Monomer B | 12, 5, 7 | 13, 0, 7 | 12, 0, 7 |
| Monomer C | 12, 6, 7 | - | 13, 0, 7 |
| Monomer D | 12, 0, 7 | - | 13, 0, 7 |
| Monomer E | - | - | 13, 2, 7 |
| Monomer F | - | - | 13, 0, 6 |
| Monomer G | - | - | 13, 0, 7 |
| Monomer H | - | - | 13, 0, 6 |
| No. of water molecules | 218 | 69 | 0 |
| PDB entry | 4MZM | 4MZT | 4MZP |
All structures were refined against a maximum likelihood target using Phenix (66). After initial rigid body refinement, a Cartesian simulated annealing protocol (starting at a Boltzmann temperature of 5000 K) was performed to uncouple R-work and R-free. This was followed by rounds of positional and isotropic B-factor refinements interspersed by manual rebuilding using Coot (67). At the end of the refinement, waters were included in the model where relevant, and translation-libration-screw (TLS) parameters (one TLS group per chain) were included in the refinement. For crystal forms I and II, non-crystallographic symmetry (NCS) restraints were applied at the start of the refinement and released based on monitoring R-free. For crystal form III, NCS restraints were maintained throughout the refinement except for loops Gly48-Lys54 and Ile61-Lys70. The final refinement statistics are given in Table 1.
In all structures, most of the residues constituting the N-terminal His-tag are disordered and the model starts at Pro1, except for all chains in form I and chain A in form II where it starts at Asp0, and chain B of form III, which starts at Gln-1. At the C-terminus, most chains end at Asn113 except for chain A of form I and chains A, F and H of form III that end at Ala114. In addition, electron density is missing for residues Ile50-Lys52 (form II chain B), Arg49-Lys52 (form II chain C) and Lys63-Lys65 (form II chain E).
Analysis of crystal packing contacts
For each space group, all MazF-MazF contact interfaces within the unit cell were generated and evaluated using the PDBePISA webserver (68). The database of crystal packing contacts generated therefrom was grouped per chain, screened for redundancy and truncated to unique contacts only. The per residue buried surface area was used as a metric to gauge the involvement of individual residues in the symmetry mates interface. For each chain, values of buried surface area were summed per residue for all the interfaces and plotted as a function of primary sequence.
NMR structure determination
13C- and 15N-labeled SaMazF was prepared at 1 mM in 20 mM Na phosphate pH 6.6, 10% D2O. All NMR spectra were recorded at 308 K using a Varian NMR Direct-Drive Systems 800 MHz spectrometer equipped with a salt tolerant triple-resonance PFG-Z cold probe. Two-dimensional NOESY and three-dimensional 15N and 13C NOESY-HSQC spectra with 100 ms mixing times were recorded on the same sample. All NMR data were processed using NMRPipe (69) and analyzed by CCPNMR (70) or NMRView (71). The assignment of backbone and side-chain 1H, 15N and 13C resonances were described previously (54).
Twenty inter-monomeric nuclear Overhauser effects (NOEs) were identified based on a preliminary model of the SaMazF calculated from chemical shifts using the CS-Rosetta software (72) and the dimeric structure of YdcE (PDB entry 1NE8), the closest homolog of SaMazF present in the Protein Data Bank. These manually assigned NOEs were used together with non-assigned NOEs and dihedral restraints from Talos+ (73) as input for the structure calculations using CYANA version 2.1. Non-assigned NOEs were assigned using the automated NOE assignment procedure of CYANA (74,75). A standard protocol was used with seven cycles of combined automated NOE assignment and structure calculation of 100 conformers in each cycle. From the three NOESY data sets, 3262 NOEs were unambiguously assigned, including 66 inter-monomeric NOEs (Table 2). These unambiguously assigned restraints were used for a final structure refinement in explicit solvent using the RECOORD protocol (76), which runs under CNS (77). The twenty lowest-energy structures were used for final analysis.
Table 2.
NMR structure determination
| NMR structural statistic | |
| Distance restraints | |
| Short range (i − j = 0) | 826 |
| Medium range (1 ≤ |i − j| ≤ 4) | 1358 |
| Long range (|i − j| ≥ 5) | 1012 |
| Inter monomer (A to B) | 66 |
| Total | 3262 |
| Dihedral restraints | |
| Phi angles | 77 |
| Psi angles | 74 |
| Restraint statistics | |
| NOE violations > 0.5 Å | 2.25 ± 1.74 |
| Dihedral violations > 5º | 2.4 ± 2.4 |
| RMSD (a.a. 1–47, 56–112) from average (Å)a | |
| Backbone N, CA, C', O | 0.65 ± 0.09 |
| Heavy atoms | 1.03 ± 0.15 |
| Ramachandran plot | |
| Most favored regions (%) | 85.7 |
| Additional allowed regions (%) | 13.6 |
| Generously allowed regions (%) | 0.6 |
| Disallowed regions (%) | 0.0 |
| PDB entry | 2MF2 |
aFlexible N- and C-terminal residues and residues of loops 48–55 and 63–70 were omitted from the RMSD analysis and Ramachandran statistics obtained from PROCHECK analysis.
Backbone dynamics from 15N relaxation data
The relaxation parameters 15N R1, R2, and 1H–15N steady-state NOEs were measured at 599.78 MHz and 308 K. Relaxation values were obtained from series of 2D experiments with coherence selection achieved by pulse field gradients using the experiments described previously (78) on 13C15N-labeled SaMazF. The 1H–15N heteronuclear NOEs were determined from the ratio of peak intensities (Ion/Ioff) with and without the saturation of the amide protons for 3 s. Average heteronuclear NOE values and their errors were obtained from a duplicate set of experiments. 15N R1 and 15N R2 relaxation rates were measured from spectra with different relaxation delays: 100, 200, 300, 400, 500, 600, 700, 900, 1200 and 1500 ms for R1 and 10, 30, 50, 70, 90, 110, 130, 150, 170 and 210 ms for R2. Relaxation parameters and their corresponding errors were extracted with the program NMRView (71). Estimation of the rotational correlation time of SaMazF from the 15N R2/R1 ratio was done using TENSOR2 (79).
Chemical shift mapping
NMR titrations were recorded at 308 K on a Varian NMR Direct-Drive Systems 800 MHz spectrometer equipped with a salt tolerant triple-resonance PFG-Z cold probe. A SaMazE-derived C-terminal peptide (residues 23–56 obtained as lyophilized powder from Bio-Synthesis, Lewisville, TX, USA; SaMazE23–56) was re-suspended in 20 mM phosphate pH 6.6 at a concentration of 3.5 mM and titrated into a solution of 0.5 mM 13C15N-labeled SaMazF in the same buffer in eight steps to a final molar ratio of SaMazF2:SaMazE23–56 of 1:2. A 15N-HSQC of the SaMazF in absence of the SaMazE-derived peptide was recorded as reference. 15N-HSQC spectra were further recorded after each addition of SaMazE23–56. The magnitude of the chemical shift perturbation (Δδ) was calculated by
 |
(2) |
where Δδ is the difference between the bound and free form combined chemical shifts.
Residue conservation
Residue conservation scores were calculated using ConSurf (80) based either on the 12 pre-aligned sequences in Supplementary Figure S1 or based upon a Clustal W (81) multiple sequence alignment of 19 randomly selected MazF sequences with sequence identities with SaMazF exceeding 35% (uniprot entries MAZF_STAHJ, ENDOA_BACSU, R9KFQ5_9FIRM, B2GA66_LACF, R5L321_9CLOT, E7G757_9FIRM, F0SUX5_SYNGF, E6UK99_RUMA7, E3EKA9_PAEPS, F7V2M0_CLOSS, F8HY64_WEIKK, K9W9N9_9CYAN, K2B658_9BACT, B1BUR9_CLOPF, D8FFQ1_9DELT, N9YMI4_9CLOT, I0XX63_9LEPT, R5NJH8_9FIRM and F3AL12_9FIRM) next to the SaMazF sequence itself.
Modeling of the SaMazF-RNA complex
We used the structure of the Bacillus subtilis MazF (YdcE) in complex with RNA (PDB entry 4MDX) as template for building a model of the SaMazF-RNA complex. The conformation of the loop comprised of residues 48–58 of SaMazF (crystal form I) was rebuilt using the program MODELLER (62) to generate the RNA-bound conformation observed in YdcE. The RNA from PDB entry 4MDX was transferred to this model of SaMazF in its RNA-binding conformation by superposition with PDB entry 4MDX. The resulting SaMazF-RNA complex was then relaxed in two minimization steps, using the program NAMD (82), first in vacuum and subsequently in an explicit water environment (4605 TIP3 water molecules in a sphere with radius 35 Å around the centre of mass of the SaMazF dimer).
RESULTS
Purification of SaMazF
SaMazF is lethal to E. coli when over-expressed and can only be obtained if co-expressed with its antitoxin SaMazE. Therefore, the samazE and samazF genes were introduced in the pETDuet1 (Novagen) expression vector, which attaches a histidine-tag to the N-terminus of SaMazF. Upon induction with 1 mM IPTG, this leads to considerable production of SaMazF without compromising cell viability. To obtain pure and well-folded SaMazF, a purification method was devised that allows removal of non-covalently bound SaMazE without disrupting the correct folding of SaMazF (Figure 1A and B). First, a Ni-NTA column is used to trap SaMazE–SaMazF complexes and the column is extensively washed to remove all contaminants. To remove SaMazE, a gradient of guanidinium hydrochloride (GdHCl) is used, which disrupts the SaMazE–SaMazF interaction. Here it is crucial to reduce the time of the GdHCl treatment as well as the maximal concentration used as the resulting SaMazF otherwise irreversibly aggregates. Likely, under the conditions used, SaMazF retains its dimeric state on the column (see below) and we assume that this is key for obtaining a sample of well-folded SaMazF. While the concentration of GdHCl on the column is reduced, the protein is eluted using a gradient of imidazole. The protein elutes at about 125 mM imidazole and 2.75 M GdHCl, after which it is dialyzed to remove both these components. A final gel filtration step on a Superdex 75PG column removes any further contaminants. This method allowed producing significant amounts of pure SaMazF (25–35 mg from 1 l of culture).
Figure 1.
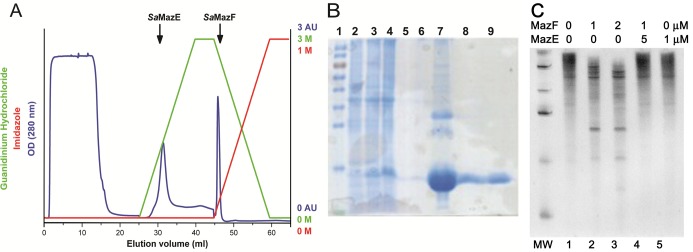
Purification of SaMazF. (A) Ni-NTA purification of SaMazE and SaMazF. After loading, SaMazE is eluted using a gradient of guanidinium hydrochloride while SaMazF remains bound to the column. SaMazF is eluted using an immidazole gradient and subsequently dialyzed to remove the guanidinium. (B) SDS-PAGE showing the progress of expression and purification. Lane 1: molecular weight marker (Fermentas PageRuler). Lane 2: E. coli extract prior to induction. Lane 3: E. coli 2 h post induction. Lane 4: E. coli extract after overnight induction. Lane 5: SaMazE eluted from the Ni-NTA column. Lane 6: fractions in between the SaMazE and SaMazF peaks. Lane 7: SaMazF eluted from the Ni-NTA column. Lanes 8 and 9: SaMazF after further purification on SEC. (C) RNase activity of SaMazF. The figure shows the ribonuclease activity of SaMazF against bacteriophage MS2 genomic RNA. Lane 1: New England Biolabs Inc. low range ssRNA ladder (50, 80, 150, 300, 500 and 1000 bases). Lane 2: intact RNA control, excluding any nonspecific RNase contamination. Lanes 3 and 4: cleaved RNA by an active SaMazF at 1 μM and 2 μM, respectively. Lane 5: RNA degradation inhibition of SaMazF by the presence of SaMazE. Lane 6: SaMazE sample incubated with RNA.
To exclude the possibility that either the GdHCl treatment or the presence of the N-terminal His-tag might hamper the functionality of SaMazF, we evaluated its in vivo and in vitro activities. Non-tagged as well as N-terminal and C-terminal His-tagged SamazF constructs prevent colony formation upon induction of the Plac promoter with IPTG, but not when repressed by glucose (data not shown). The ribonuclease activity of the purified protein was assayed using the 3569 nucleotide genomic RNA of bacteriophage MS2 (83). As shown in Figure 1C, we find SaMazF to be able to cleave MS2 RNA. Furthermore, this activity is inhibited by the presence of the antitoxin SaMazE. The latter indicates that the RNase activity results from SaMazF and not from any other contaminating ribonuclease.
Biophysical and biochemical properties of SaMazF
The resulting protein shows a single band on SDS-PAGE, and its identity was confirmed by electrospray mass spectrometry (Figure 2A). The derived mass of 14 794 ± 2.4 Da is in close agreement with the theoretical mass of 14 791.9 Da for the SaMazF monomer lacking its N-terminal methionine but including the N-terminal His-tag (GSSHHHHHHSQDP). The protein elutes with an apparent molecular weight of about 31 500 Da in an analytical gel filtration experiment indicating a homodimer (Figure 2B). SaMazF shows CD spectra reminiscent of a folded protein in different buffer and salt conditions (Figure 2C and Supplementary Figure S2A and B). CD spectra of SaMazF at 293 K under a range of conditions show a pronounced minimum at 208 nm and a weaker minimum at 222 nm. Analysis of the CD spectra using CDSSTR indicates the presence of 10% α-helix and 25% β-sheet, which compares reasonably well with the values of 15% and 28%, respectively, calculated from the crystal and NMR structures (see below). In addition, the quality of the protein is such that crystals can be obtained and good-quality NMR spectra can be collected from 13C15N-labeled material (53,54).
Figure 2.
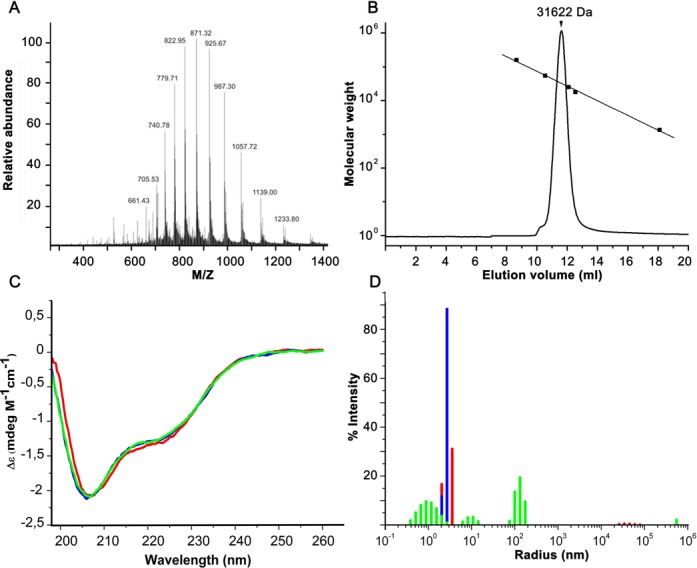
Biophysical characterization. (A) Electrospray mass spectrum of SaMazF. The m/z values for the major peaks are indicated. (B) Analytical gel filtration. Shown is the elution profile of SaMazF on a superdex HR75 10/30 column together with the elution volumes of four molecular weight standards (bovine gamma-globulin, 158.0 kDa; ovalbumin, 44.0 kDa; myoglobin–F-plasmid CcdB, 25.4 kDa and 17.0 kDa; vitamin B12, 1.35 kDa) plotted versus their molecular weights. (C) CD spectra of SaMazF in 20 mM Na-phosphate pH 7.0 and at different concentrations of NaCl (0 mM green, 75 mM blue and 300 mM red). (D) DLS-derived intensity versus radius histogram of SaMazF under the same conditions as in panel (B). The same color scheme is used.
The oligomeric state of SaMazF was further investigated using MALS (determined MW: 30.7 kDa) and DLS. DLS experiments show that SaMazF aggregates at very low ionic strengths in absence of salt, but that an essentially mono-disperse sample is obtained at low (75 mM NaCl, 20 mM Tris-HCl pH 7.0) and high (300 mM NaCl, 20 mM Tris-HCl pH 7.0) salt concentrations (Figure 2D). The derived hydrodynamic radius and corresponding calculated molecular weight are 2.6 nm and 32 kDa for the low salt condition and 2.5 nm and 29 kDa for the high salt condition, respectively, in agreement with a well-structured SaMazF dimer.
Thermal unfolding of SaMazF
When attempting to obtain data on the thermal stability of SaMazF, we observed that the CD spectrum of SaMazF measured within minutes of heating the protein to 371 K only shows minor differences with the corresponding CD spectrum at 293 K (Supplementary Figure S2C). To distinguish between a very high thermal stability with a melting temperature above 371 K and a high kinetic barrier for thermal unfolding, we followed the CD signal at different temperatures as a function of time (Figure 3A and B). These experiments show a temperature-dependent lag phase followed by two apparent structural transitions for temperatures of 328 K and above. At lower temperatures (318 K and below), the CD spectra remain constant for at least one week. The first structural transition is characterized by a deepening of the CD minimum around 207 nm (Figure 3A). Analysis of these spectra indicates that the β-sheet content is reduced and that helix content (most likely polyproline II) increases. This is followed by a second structural transition toward a species with a high (45%) β-sheet and lacking α-helix.
Figure 3.
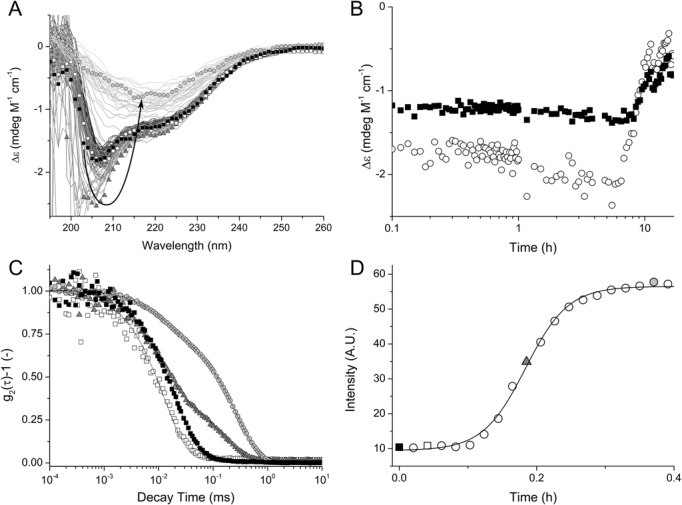
Thermal stability of SaMazF. (A) CD spectra of SaMazF at 293 K (white squares) and at different time intervals at 343 K (thin lines). Spectra corresponding to key structural states are indicated by symbols (t = 0 min, open circles; t = 270 min, gray triangles; t = 960 min, gray circles). The initial CD signals at 293 K and 343 K are essentially identical. After a lag phase, the minimum at 207 nm deepens, followed by a slow transition to a mainly β-structure containing state. (B) CD signal at 207 nm (white circles) and 220 nm (black squares) at 343 K followed in function of time. The duration of the lag phase is strongly dependent on temperature and protein concentration, indicating a nucleation event. (C) Normalized intensity correlation functions of a 0.2 μm filtered buffered SaMazF solution (20 mM Tris-HCl pH 7.0, 75 mM NaCl) after 0 min of incubation at 343 K (black squares), 2.5 min (open squares), 11 min (gray triangles) and 22 min (gray circles), respectively. Full lines represent fits with Equation (1). At t = 0, the correlation function is well characterized by a single exponential decay with a characteristic time of 2.5 ± 0.1 × 10⁻² ms, indicative of the monodisperse nature of the sample. After 7 min of incubation at 343 K, a second decay appears in the correlation function, which is correlated with an intensity increase of the scattered light. This corresponds to the formation of a second, ‘slower’ species in solution, considerably larger than a native MazF dimer. Both the relative amplitude and the decay time of the second population increase as a function of incubation time, corresponding to an increase in characteristic size and number density, e.g. 36 ± 5 nm for t = 11 min and 49 ± 5 nm for t = 22 min. Conversely, the characteristic size of the ‘faster’ species (presumed native SaMazF dimer) is constant as a function of time suggesting that the overall fold is unperturbed, i.e. 2.7 ± 0.2 nm, 2.8 ± 0.3 nm, 2.6 ± 0.3 nm and 2.7 ± 0.2 nm for t = 0, 2.5, 11 and 22 min, respectively. (D) Scattered intensity at 343 K as a function of time: full line represents a Boltzmann sigmoidal curve fit. The data points indicated as grey triangle or black and open square correspond to the equivalent curves in panel C.
The previous observations suggest a nucleation process preceding aggregation. This was examined by DLS measurements (Figure 3C and D) that show a starting state of particles with a hydrodynamic radius of 2.6 nm, in agreement with the size of the SaMazF dimer determined by X-ray crystallography and NMR spectroscopy. In time, a considerably larger second species develops, again after a temperature-dependent lag time. This aggregation process masks any unfolding event, and the discrimination between thermodynamic and kinetic stability of SaMazF cannot be based on these data alone. Nevertheless, as the aggregation involves a significant structural transition, it seems likely that kinetically determined unfolding creates the starting point from which aggregation nuclei can grow.
Crystal structures of SaMazF
Three different crystal forms of SaMazF are available (Table 1), which lead to the structures of 14 crystallographically independent SaMazF monomers forming 7 independent dimers (Table 1). Each of these monomers was independently refined except for the eight monomers present in crystal form III, which were restrained by NCS because of the lower resolution (excluding two more variable loops that clearly adopt distinct conformations). Figure 4 shows the overall structure of SaMazF. SaMazF adopts the typical MazF/CcdB fold consisting of a 5-stranded anti-parallel β-sheet (strands S1–S3 and S6–S7) followed by a 4-turn α-helix (H3 and further decorated with a small 3-stranded anti-parallel β-sheet (strands S3–S5 with S3 taking part in both sheets), a short 2-turn α-helix (H1) and a 1-turn helix H2 (see Figure 4 for definitions). Overall, the structures of the SaMazF monomers are very similar (Figure 5A and Supplementary Figure S4) with pair-wise backbone root-mean-square deviations (RMSDs) of 0.18–0.58 Å for all 99 residues defined in each molecule (the 8 NCS restrained monomers from crystal form III are represented in this comparison by chain A only). Structural variation is seen at the N- and C-termini and in two loop regions: Gly48-Lys54 (between strands S3-S4) and Ile61-Lys70 (between strands S4-S5). In some monomers, parts of these loops lack electron density and are, together with differences in N- and C-termini, responsible for the different number of residues found in the different X-ray structures. The conformations observed for loop S3-S4 can be considered to belong to a single family, but in loop S4-S5 highly distinct conformations are observed that are related to crystal packing (see below).
Figure 4.

Overall structure of SaMazF. (A) Amino acid sequence of SaMazF. Secondary structure elements derived from the X-ray structures of SaMazF are indicated by yellow arrows (β-strands) and red bars (α-helices) and are labeled. (B) Overall structure of the SaMazF dimer. Shown is a cartoon figure of the dimer formed by chains A and B of crystal form I. Chain A is colored according to secondary structure as in (A). Loop regions Leu12-Gly22, Gly48-Lys54 and Lys64-Lys70 are colored green and labeled as S1-S2, S3-S4 and S4-S5, respectively. Chain B is shown in gray. N- and C-termini are indicated. Dotted lines show the connection between the extremities of loops that lack electron density. Panel (B) was prepared using PyMol (84).
Figure 5.
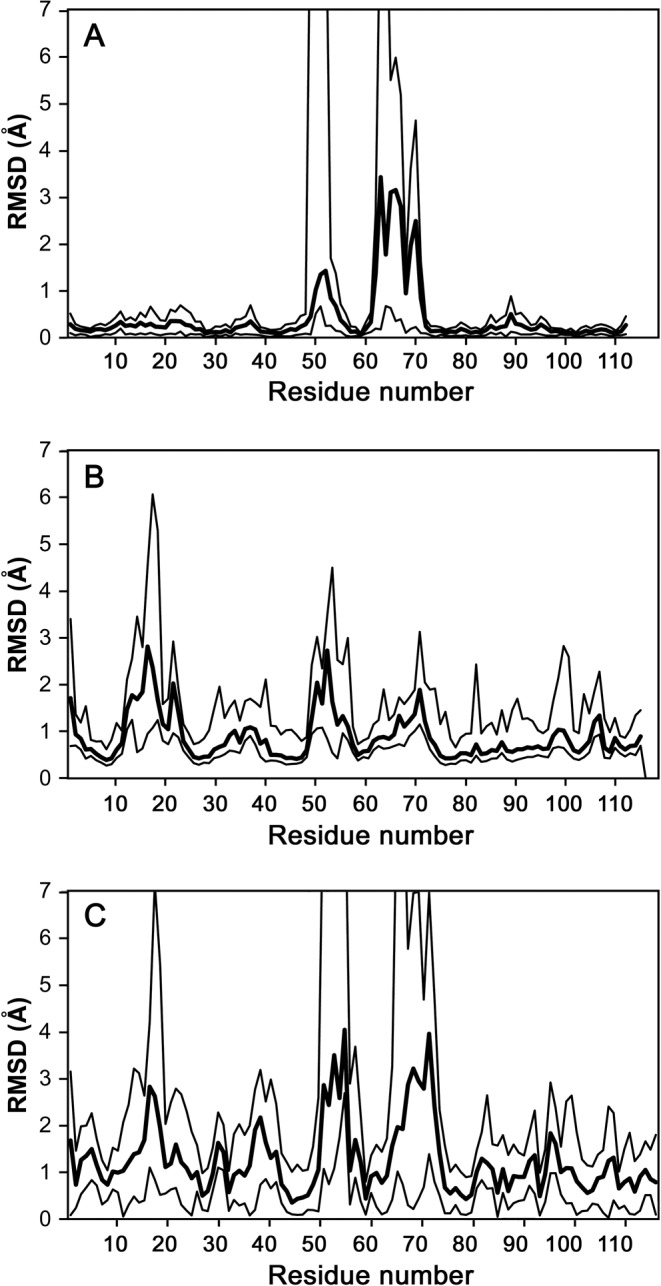
Structural variability of SaMazF. (A) Per residue RMSDs within the X-ray ensemble. The mean RMSDs for all pair-wise comparisons of SaMazF monomers within the X-ray ensemble (seven independent monomers—form III is represented by a single monomer only because of the imposed NCS restraints) are shown as a bold line. The minimum and maximum values for each residue are represented by the thin lines. When no coordinates were available (due to lack of electron density), an arbitrary RMSD of 10 Å was used. The largest variability is seen for amino acids Lys64-Lys70 and to a lesser extent for Gly48-Lys54. (B) Per residue RMSDs within the NMR ensemble. Similar plot as in (A), but now using the 20 lowest energy NMR structures that were deposited in the Protein Data Bank. The largest variability is seen for amino acids Leu12-Ser18, Gly48-Lys54 and Lys64-Lys70. (C) Comparison of the X-ray and NMR ensemble. Plotted are the mean RMSDs for all pair-wise comparisons of SaMazF monomers in the X-ray ensemble with those in the NMR ensemble.
The SaMazF dimer is formed by pairing strand S6 from two monomers to form a dimer-wide 10-strand anti-parallel β-sheet. Further contacts include the anti-parallel alignment of the last turn of helix H3 and an extensive series of hydrophobic side-chain to side-chain contacts involving residues Ile29, Ile42, Ile79, Leu106 and Ile110 that create an extended hydrophobic core crossing the dimer interface. Superposition of all seven SaMazF dimers show that the dimer is highly rigid (Supplementary Figure S4), with no significant inter-monomer rotation being detected.
Crystal packing
As the solvent content of all three crystal forms is very low, it is not unlikely that lattice contacts influence the conformation of the protein. Supplementary Figure S3 plots the amount of surface area buried in crystal lattice contacts for each chain in function of residue number. From these plots, it can be seen that lattice contacts are not randomly distributed on the protein surface. In particular, among the two loops that show higher RMSD values in the X-ray ensemble, loop S3-S4 (Gly48-Lys54) is involved in lattice contacts in all structures (Figure 6A). It is unlikely, however, that crystal lattice interactions have a major influence on the conformation of this rather extended loop given that all conformations observed seem to belong to a single family, with only two individual conformations (form I chain D and form II chain A) deviating somewhat from the canonical conformation. In the absence of a chain where this loop is not involved in lattice interactions, it nevertheless remains difficult to draw hard conclusions.
Figure 6.

Crystal packing. (A) Stick representation of the backbone conformations of loop Gly48-Lys54 in the X-ray ensemble (above) and in the NMR ensemble (below) and colored according to atom type (carbon, orange; nitrogen, blue; oxygen, red). Within the X-ray ensemble, this loop is involved in crystal packing in each chain. (B) Stick representation of the backbone conformations of loop Ile61-Lys70. The ‘canonical’ conformation observed in the crystal structures in 10 out of 14 chains is shown in the upper left of the panel. Colored as in (A) except for the two chains that are not in packing contacts where carbons are drawn in green. The equivalent NMR ensemble is shown in the upper right of the panel while the three packing-driven conformations are shown at the bottom of the panel. (C) Stick representation of the backbone conformations of loop Leu12-Ser18 in the X-ray ensemble (above) and in the NMR ensemble (below). Coloring as in (A). This figure was prepared using PyMol (84).
Loop S4-S5 (Ile61-Lys70) is involved in lattice contacts in most but not all SaMazF monomers. Four classes of conformations are observed (Figure 6B). The most common conformation is observed in ten chains, two cases of which do not involve lattice contacts. In the remaining four chains, this conformation is prohibited as it would lead to steric clashes with a neighboring monomer. Of these remaining chains, form II chains A and B adopt the same conformation while form III chains D and E each adopt a unique conformation. Loops S4-S5 of the latter four chains are all involved in lattice contacts. Thus, it seems like loop S4-S5 will adopt a default conformation when the crystal environment allows for it, but will adapt its conformation otherwise.
Finally, loop S1-S2 (Leu12-Ser18) adopts the same conformation in all monomers independent of its involvement in the crystal environment (Figure 6C). This loop does, however, show a high RMSD in the NMR ensemble (see below).
NMR solution structure
The solution structure of SaMazF was obtained using a combination of unambiguous automatically assigned NOEs in CYANA, additional manually assigned NOEs and dihedral angle restraints obtained from Talos+ analysis in a water-refinement protocol using RECOORD. The resulting ensemble of the 20 lowest energy structures (Supplementary Figure S4) shows very good Ramachandran statistics while fulfilling the experimental data (Table 2). Pair-wise backbone RMSDs of these 20 monomers range from 0.59 Å to 1.20 Å (Figure 5B). The NMR-derived secondary structure elements correspond to those identified in the X-ray structures, and structural variability is limited to loop regions Leu12-Ser18 (S1-S2), Gly48-Lys54 (S3-S4) and Lys64-Lys70 (S4-S5), as well as the N- and C-termini.
Although the NMR ensemble agrees well with the ensemble of X-ray-derived structures, they cannot be considered identical (Figure 5C and Supplementary Figure S4). The pair-wise RMSDs between NMR and X-ray structures vary between 1.02 Å and 1.58 Å, higher than the internal variation within the NMR and X-ray ensembles. This suggests that the X-ray ensemble, while less divergent than the NMR ensemble, is not a simple subset of the NMR ensemble and that the larger structural diversity of the NMR ensemble compared to the X-ray ensemble cannot be attributed solely to the lower accuracy of NMR structures (due to the smaller data-to-parameter ratio). Thus, lattice interactions seem to affect the X-ray structures even if averaged out over several crystal environments.
Analysis of the pair-wise RMSD plots of both the NMR and the X-ray ensemble shows that differences between the NMR and X-ray ensembles are spread out over the whole sequence, but are maximal in those regions where the NMR and X-ray ensembles also differ most within each ensemble. In those regions, the NMR models vary much more than the X-ray models. Most noticeable is the loop region Leu12-Ser18 (S1-S2), which adopts essentially one single conformation within the X-ray ensemble but is highly variable within the NMR ensemble. Also, region Thr33-Thr40 including helix H1 seems to contribute to the systematic differences between both ensembles and shows a smaller peak in structural variability within the NMR ensemble.
Both the NMR and X-ray ensembles were further validated by comparing how well they are able to predict the experimentally measured SAXS data (Figure 7). Table 3 shows all the structural parameters derived from the Guinier analysis. After modeling the N- and C-termini, missing loops and missing atoms in the X-ray ensemble, both ensembles fit the experimental SAXS data quite well (Table 3). We looked for the minimal ensemble sufficient to describe the SAXS data, which in both cases turned out to be as little as three models. The major source of variability that is required for a good agreement with the SAXS data is found at the flexible C-terminus and the N-terminal His-tag (Figure 7B).
Figure 7.
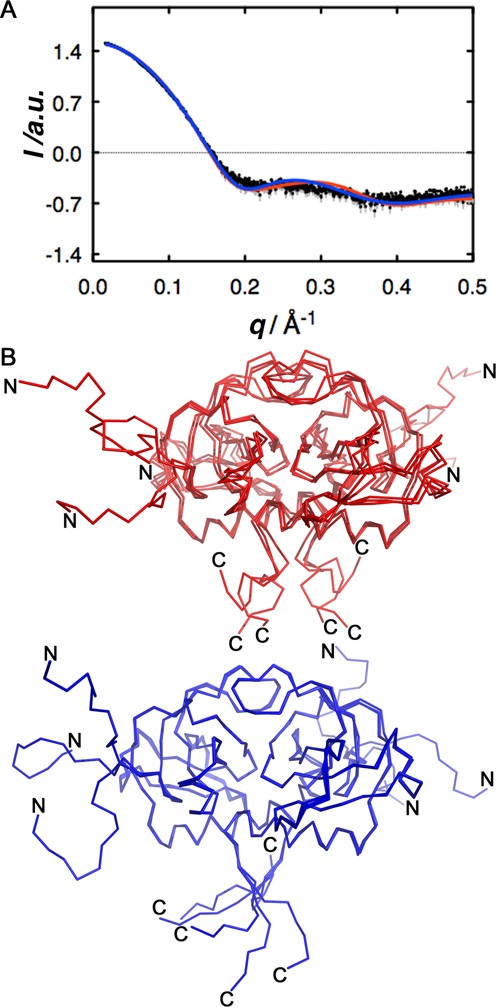
Small-angle X-ray scatter. (A) Experimental scatter data. The experimental data are shown in black while the error margins are shown in gray. Analysis of the scattering curve indicates that SaMazF forms a globular dimer with a radius of gyration of 23.1 Å as determined through Guinier and p(r) analysis, and a molecular weight of about 28 kDa as determined through Guinier analysis. The theoretical scattering curves calculated from the full NMR (red) and X-ray (blue) ensembles are overlaid and predict the experimental data equally well. (B) Minimal set of NMR (red) and X-ray (blue) structures necessary to predict the experimental data. In each case, selecting three models from the full ensemble is sufficient, with the major source of variability that needs to be taken into account coming from the disordered C-terminus and the N-terminal His-tag (indicated by N and C). Panel (B) was prepared using PyMol (84).
Table 3.
Structural parameter determined from the Guinier analysis of the experimental SAXS curve of SaMazF
| Protein | Rg (Å) | Dmax (Å) | MW (kDa) SAXS | MW (kDa) theoretical | χ NMR | χ X-ray |
|---|---|---|---|---|---|---|
| SaMazF | 23.09 | 79.8 | 28.3 | 29.8 | 1.06 | 1.17 |
Conformational flexibility and backbone dynamics from 15N relaxation data
A per residue view of the conformational dynamics can be obtained from 15N R1, R2 and heteronuclear NOEs, which were measured for the 100 non-overlapping cross peaks of SaMazF (Figure 8). Besides the N- and C-termini, low NOE values and especially elevated R1 values (Figure 8A and B) are observed for the residues located in two loops: residues Leu12-Gly22 (S1-S2) and residues Ile61-Lys70 (S4-S5), indicating increased mobility at the ps to sub-ns timescale. Some residues outside these two loop regions show elevated R2 values (Figure 8C), which are indicative of conformational exchange on the microsecond to millisecond timescale (85).
Figure 8.
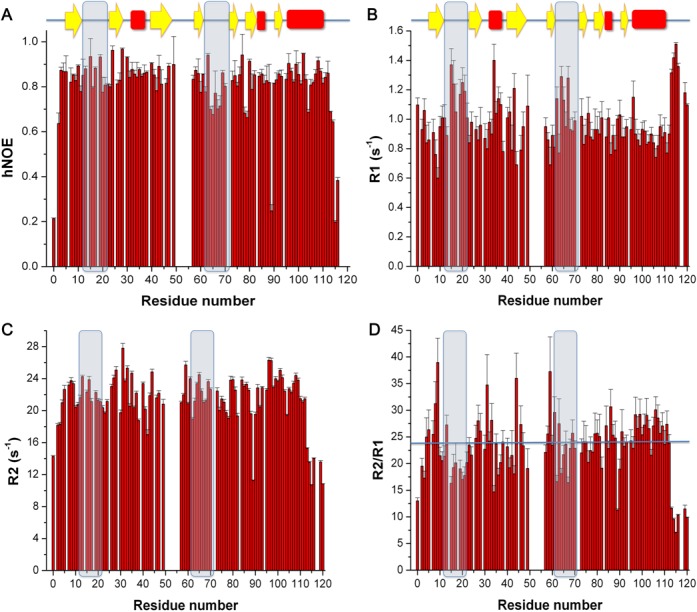
Backbone dynamics of SaMazF. Backbone dynamics of SaMazF were measured at 600 MHz and 308 K. (A) 1H–15N steady-state heteronuclear NOEs in function of residue number. (B) 15N R1 in function of residue number. (C) 15N R2 in function of residue number. (D) R2 over R1 ratios in function of residue number. The solid line in panel (D) corresponds to the average R2/R1 ratio used for obtaining the rotation correlation time τc. The loops Leu12-Gly22 and Ile61-Lys70 are highlighted in all panels.
The high RMSD values mentioned earlier for the loop regions Leu12-Ser18 and Lys64-Lys70 in the NMR ensemble and plotted in Figure 5 correlate well with these observations and with an increased flexibility reflected by the decrease in R2/R1 values (and also the N- and C-termini) (Figure 8D). They correlate, however, also with a lower number of long-distance restraints (Supplementary Figure S5). The enhanced conformational flexibility of loop Gly48-Lys54 cannot be deduced from this analysis due to lack of data. It is, however, also prominent in the X-ray ensemble and therefore is likely to be a true feature of SaMazF rather than an artifact of data paucity.
A further global picture of the dynamics of SaMazF can be obtained from the rotational correlation time τc. Analysis of the relaxation data of SaMazF using TENSOR2 (78) indicates an average 15N R2/R1 ratio in the most ordered regions of 23.73 (Figure 8D), corresponding to an apparent rotational correlation time τc of 15.4 ns. The estimated correlation time for a globular protein of the same molecular weight (29.584 kDa) at 308 K is 14 ns (http://nickanthis.com/tools/tau). The slightly higher τc derived from the R2/R1 ratio is likely due to the two highly flexible termini that increase the effective radius of gyration.
Dynamics probed by X-ray crystallography
Besides structural variation, X-ray crystallography further provides (limited) information on protein dynamics via the atomic B-factors. Variation of the main chain B-factors closely follows the per residue pair-wise RMSD values. There is however one notable exception: in chain B of crystal form I, elevated B-factors are also observed for residues Ala10-Val23 (Figure 9). This is the only indication in our set of crystallographic data that hints toward flexibility of this loop, which in the NMR data behaves as the most dynamic part of the molecule if the termini are excluded.
Figure 9.
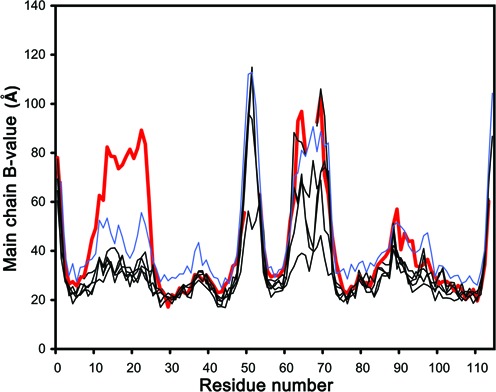
B-factor-derived dynamics. The average backbone B-factors are plotted in function of residue number for all six crystallographic independent monomers from crystal forms I and II and for monomer A of crystal form III. The B-factors in the latter crystal were restrained using non-crystallographic symmetry due to the lower resolution of the data and the profiles for monomers B–H are essentially identical to that of A and therefore not shown. They are in general slightly higher than those for the six monomers from crystal forms I and II over the whole residue range and therefore highlighted in blue. The thick red curve corresponds to monomer B from crystal form I and shows elevated values for residues belonging to loop S1-S2.
SaMazE binding site
In order to determine the binding site of SaMazE on SaMazF, we performed NMR chemical shift mapping using SaMazE23–56, a SaMazE-derived peptide consisting of residues Met23-Glu56. In these experiments, 0.5 mM 13C15N SaMazF was titrated with 3.5 mM SaMazE23–56 up to a final molar ratio of SaMazF2:SaMazE23–56 of 1:2. The effect of SaMazE23–56 mainly consists of a weakening of most of the 1H–15N HSQC peaks of SaMazF (except for the flexible N- and C-termini) with only small shifts in resonances. As aggregation was observed at the end of the titration, we based our analysis on the fifth titration point corresponding to a 1:1 ratio. Figure 10A and B plots the effects of SaMazE23–56 on the intensities and chemical shifts of the 1H–15N HSQC cross-peaks. Although the statistical reliability is limited, the largest effects for chemical shift changes are found in loop S1-S2 and strands S5 and S6, which makes sense in terms of the toxin-antitoxin interactions observed in the related YdcE–YdcD complex (86) (Figure 10C and D and Supplementary Figure S7). Loop S1-S2 needs to move to an open conformation to allow antitoxin binding in YdcE. Strand S6 is located underneath loop S1-S2 and is a major part of the interaction surface for YdcD residues Met64-Glu83, the segment that corresponds to our SaMazE23–56 peptide. Within the MazF subfamily to which SaMazF belongs, the residues involved in antitoxin and substrate binding are well conserved (Supplementary Figure S1). In addition, CD measurements indicate that SaMazE23–56 adopts an α-helical conformation when bound to SaMazF (data not shown). These observations are in agreement with a conserved mode of inhibition within the mazEF modules.
Figure 10.
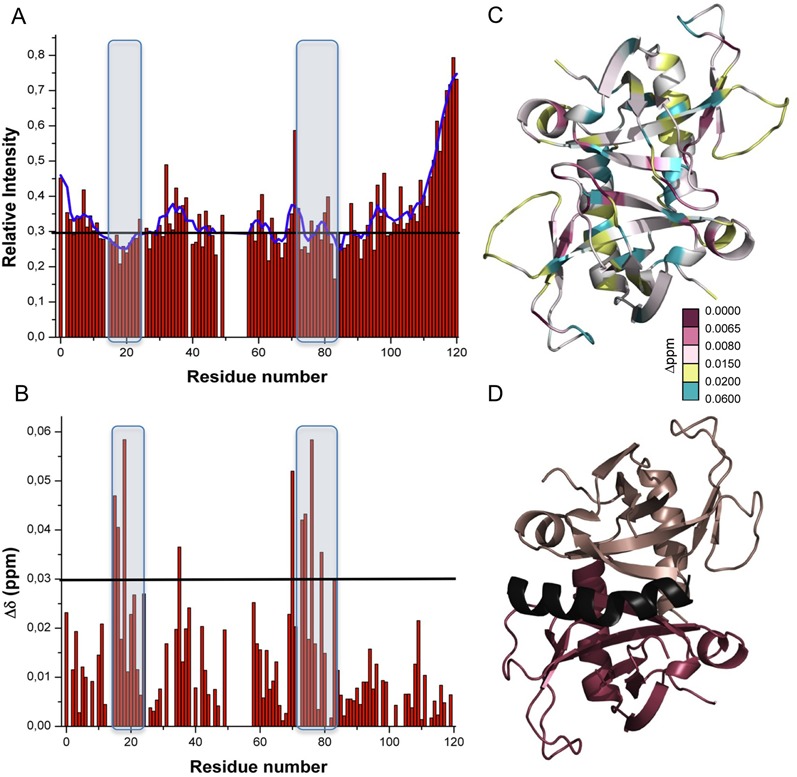
MazE binding. (A) Relative change of 1H–15N HSQC cross-peak intensities in function of residue number upon titration of SaMazF with SaMazE23–56 till a 1:1 ratio. The blue curve corresponds to average intensity changes using a sliding window of five residues. Loop S1-S2 and strands S5 and S6 are highlighted. (B) Combined 1H and 15N chemical shift differences between free and bound SaMazF in a 1:1 ratio with SaMazE23–56. Loop S1-S2 and strands S5 and S6 are highlighted. (C) Combined 1H–15N chemical shift differences plotted on a ribbon diagram of the SaMazF dimer. Residues are color-coded according to the change in chemical shift of their 1H–15N HSQC cross-peaks with red corresponding to the largest effects. The orientation is identical to the left panel in Figure 4B. (D) Equivalent view of the B. subtilis YdcE–YdcD (PDB entry 4ME7) complex. The two YdcE monomers are shown in salmon and red. Residues Met64-Glu83 of the bound antitoxin YdcD are colored black. The N-terminal domain of YdcD is omitted for clarity. Figure created in PyMol (84).
DISCUSSION
Because of their biochemical activities that often lead to cell death upon over-expression, wild-type TA toxins can usually only be expressed in presence of their cognate antitoxin and therefore are difficult to obtain in large quantities. Indeed, production of E. coli EcMazF of suitable quality and quantity for structural studies was reported to require a mutation that abrogates its RNase activity (87). Attempts to purify wild-type EcMazF in presence of the antitoxin EcMazE using an unfolding/refolding protocol (17) led to protein with a low solubility and a poor NMR spectrum (87).
To overcome these problems, we designed an on-column separation protocol that allows separating SaMazF from SaMazE without compromising protein quality. Likely our approach was facilitated by the biophysical properties of SaMazF. Unfolding of SaMazF is kinetically limited and aggregation-driven. Possibly only a small fraction of SaMazF (if any) unfolds during the procedure used to strip SaMazE from the Ni-NTA-bound SaMazF. As aggregation is not possible because the SaMazF dimers remain physically separated from each other on the column during the removal of SaMazE, a high yield of well-folded SaMazF is possible.
Whether or not SaMazF (partially) unfolds during the on-column separation protocol is difficult to establish. Guanidinium-induced unfolding of SaMazF cannot be followed by fluorescence spectroscopy as the protein does not posses tryptophan and its four tyrosine side chains are fully solvent exposed. CD measurements in 3 M GdHCl are not possible below 220 nm. While the CD spectrum of SaMazF incubated for 5 h in 3 M GdHCl is, within the margins of error, identical to that of SaMazF in absence of GdHCl, this cannot be taken as a proof of lack of unfolding or dissociation into monomers. DLS measurements are hampered by the difference in viscosity of the solutions, making it difficult to compare hydrodynamic radii. Control experiments using colloidal gold nano-particles (Nanopartz) indicate a correction factor of 1.5 to the hydrodynamic radius for the use of 3 M GdHCl, and when applying this correction factor, the hydrodynamic radius of SaMazF remains unaltered upon 1 h of exposure to 3 M GdHCl.
Thermal unfolding of SaMazF contrasts with the two-state unfolding of F-plasmid and Vibrio fischeri CcdB, two proteins that share the same tertiary and quaternary structure (88,89). Unfolding of SaMazF monomers is kinetically limited and even at temperatures higher than 363 K the monomers do still have an appreciable lifetime. Unfolding leads to rapid aggregation into large particles with a large amount of β-structure. Possibly the high activation energy for unfolding of the SaMazF monomer was selected to prevent aggregation of SaMazF in vivo. Indeed, at physiological temperatures (T < 313 K), unfolding and therefore aggregation is highly unlikely to occur.
Although overall highly similar, the X-ray- and NMR-derived structures represent distinct conformational ensembles and distinct profiles of backbone dynamics. In the X-ray ensemble, conformational variability and dynamics is mainly located in loop Ile61-Lys70 (between strands S4 and S5) and to a lesser extent in loop Gly48-Lys54 (between strands S3 and S4). The NMR ensemble on the other hand shows increased dynamics and structural variability in loops Leu12-Ser18 (between strands S1 and S2), and Gly48-Lys54, and less pronounced in loop Lys64-Lys70. Of these, the backbone dynamics of loop Lys64-Lys70 is likely not of direct functional importance. The other two loops on the other hand change conformation between the substrate- and antitoxin-bound states in the closely related YdcE (86). In this respect, the NMR ensemble and its 15N relaxation-derived backbone dynamics correlate better with the proposed molecular mechanisms behind MazF regulation (86). The importance of dynamics in loop Leu12-Ser18 can in the X-ray ensemble only be inferred from one out of 14 monomers (form I chain B), where this loop shows elevated B-factors. Not surprisingly, in this monomer, the loop is not involved in lattice contacts. In general, it appears that loops S1-S2, S3-S4 and S4-S5 have a preferred conformation which can be modulated by ligand binding. The latter potential for conformational change is further reflected in crystal-packing mediated loop conformations and in the NMR order parameters. The individual conformations of these loops as well as the larger structural variation present in the NMR ensemble are probably for the larger part due to lack of sufficient NOE restraints while differences between the X-ray and NMR ensembles due to crystal packing interactions are restricted to loop S4-S5 and to a smaller extent to loop S3-S4.
While the NMR data seem to be able to indicate more correctly which loops may undergo functional dynamics during ligand binding (both RNA and MazE), neither crystallography nor NMR provide information on the actual conformations that are to be adopted in the bound states. For each of the three dynamic loops, the NMR ensemble shows a single conformational family that each time encompasses the most populated conformational family observed in the X-ray ensemble. The alternative conformations observed in the X-ray ensemble for loops S4-S5 on the other hand are not related to conformations observed in the RNA- or MazE-bound forms of the closely related YdcE (86).
When comparing with other MazF family members with known structure, SaMazF has its highest sequence identity with YdcE from Bacillus subtilis (64%) (Supplementary Figure S1), which is reflected in an RMSD of 0.73 Å for 110 common Cα atoms and which deviates in structure mainly in the conformation between Gly48 and Ile55, a region that is also conformationally heterogeneous within our population of SaMazF monomers. Sequence identity is much weaker for R1 Kid (22% corresponding to 1.57 Å for 110 Cα atoms) where conformational differences are extended to Glu62-Ser72 and Asp83-Lys90, and for E. coli EcMazF (18% corresponding to 1.69 Å for 95 Cα atoms) where in addition to the already mentioned regions, the loops Leu9-Pro25 and Ile29-Thr40 also adopt different structures. Secondary structure elements are nevertheless well conserved.
The MazF family as a whole is a highly divergent family at the sequence level (Supplementary Figure S1). With the exception of two essential catalytic residues (Arg24 and Thr47), residues implicated in substrate and antitoxin recognition are not specifically conserved, in agreement with the existence of at least two structurally different families of MazF-associated antitoxins (exemplified by the crystal structures of the E. coli and B. subtilis MazF–MazE complexes). To compare RNA binding and specificity between SaMazF and YdcE, we constructed a model of SaMazF bound to 5′UUdUACAUAA3′ and mapped the amino acid differences between SaMazF and YdcE (Supplementary Figure S6A). Within the vicinity of the two likely catalytic residues Arg24 and Thr47, only one substitution is observed between SaMazF and YdcE: Gln50 of YdcE is replaced by Arg49 in SaMazF (Supplementary Figure S6B). This substitution is neutral with respect to RNA specificity as interactions can only be made with the phosphate backbone. Other substitutions between both proteins involving side chains contacting the bound 9-mer substrate mimic cluster at the 3′ (Thr33, Lys36 and Tyr37) and 5′ (Leu9, Leu68, Asp69, Lys70, Lys88, Glu89 and Leu91) ends and do not affect the core UACAU sequence that seems to be the target of most if not all MazF proteins. The amino acid side chains that are involved in base recognition of the UACAU core sequence (Ser18, Gln20, Thr47, Lys52, Leu55, His58, Phe68, Ser72, Glu77 and Gln78) tend to be well conserved among the closer homologues of SaMazF (35% sequence identity or higher), and for most of them it was shown that alanine substitutions inactivate YdcE (86). The only highly conserved residue that is not involved in RNA recognition (or catalysis) is Asn35. Its side chain is buried in a hydrophilic cluster and seems to have a structural role.
Within the SaMazF subfamily (sequences that show at least 35% sequence identity to SaMazF) residue conservation also correlates well with the NMR mapping of SaMazE23–56. In the segment that binds to the toxin, SaMazE and YdcD share 42% sequence identity, while for the residues of YdcE interacting with YdcD, 85% are conserved with SaMazF. Furthermore, superposition of the YdcE–YdcD complex on SaMazF indicates that those residues conserved between SaMazE and YdcD are capable of making identical TA interactions. Thus, although SaMazE is considerably shorter than YdcD, its toxin-neutralizing segment is expected to adopt the same conformation when bound to SaMazF as does YdcD when bound to YdcE.
Protein function not only depends on protein structure but also on dynamics. While the conservation of protein structure during evolution is well established (90), fewer studies are available that examine protein dynamics and its relationship with protein function in an evolutionary context. While there is accumulating evidence that protein dynamics is often evolutionarily conserved (91), conserved activities of related proteins may use distinct dynamic mechanisms (92). We therefore compared the profiles of dynamics of SaMazF to that of EcMazF and to the F-plasmid and V. fischeri CcdB proteins, which adopt the same tertiary and quaternary fold (89,93) but function as gyrase inhibitors (21,94). Regions with elevated dynamics in EcMazF as observed by NMR correspond to the same three loops as seen for SaMazF: S1-S2, S3-S4 and S4-S5, with again loop S1-S2 being the most pronounced (87). More interesting however is that the S1-S2 and S3-S4 loops also show pronounced dynamics in V. fischeri CcdB (89) and that the S1-S2 loop undergoes a disorder-to-order transition in going from the target-bound structure to the antitoxin-bound structure in F-plasmid CcdB (88). Thus, the pattern of dynamics seems to be conserved within the MazF/CcdB superfamily and exploited in an equivalent way for functionality. While this may be a consequence of a common mode of antitoxin binding, it should be noted that the substrates of the MazF and CcdB proteins are completely unrelated (RNA and gyrase), and that in both cases substrate and antitoxin binding sites only partially overlap. In addition, the disorder-to-order transition in loop S1-S2 occurs in opposite directions in MazF and CcdB (21,23,86,93), suggesting an equivalent exploitation of the dynamic potential but with this mechanism independently acquired in the MazF and CcdB families.
PROTEIN DATA BANK ACCESSION NUMBERS
Coordinates have been submitted to the Protein Data Bank with accession numbers 2MF2, 4MZM, 4MZP and 4MZT.
SUPPLEMENTARY DATA
Supplementary Data is available at NAR Online.
Acknowledgments
V.Z. and A.G.P. are pre- and post-doctoral fellows of FWO respectively. The authors acknowledge Soleil Synchrotron for beam time allocation and Andrew Thompson for assistance during data collection.
FUNDING
National Institutes of Health; Fonds Wetenschappelijk Onderzoek-Vlaanderen (FWO); Vlaams Instituut voor Biotechnologie (VIB); Onderzoeksraad of the Vrije Universiteit Brussel and the Hercules Foundation; Belgian PRODEX Programme [ESAAO-2004-070 to M.S.]. Source of open access funding: Internal VIB grant.
Conflict of interest statement. None declared.
REFERENCES
- 1.Buts L., Lah J., Dao-Thi M., Wyns L., Loris R. Toxin-antitoxin modules as bacterial metabolic stress managers. Trends Biochem. Sci. 2005;30:672–679. doi: 10.1016/j.tibs.2005.10.004. [DOI] [PubMed] [Google Scholar]
- 2.Gerdes K., Christensen S.K., Lobner-Olesen A. Prokaryotic toxin-antitoxin stress response loci. Nat. Rev. Microbiol. 2005;3:371–382. doi: 10.1038/nrmicro1147. [DOI] [PubMed] [Google Scholar]
- 3.Yamaguchi Y., Park J.H., Inouye M. Toxin-antitoxin systems in bacteria and archaea. Annu. Rev. Genet. 2011;45:61–79. doi: 10.1146/annurev-genet-110410-132412. [DOI] [PubMed] [Google Scholar]
- 4.Hayes F., Van Melderen L. Toxins-antitoxins: diversity, evolution and function. Crit. Rev. Biochem. Mol. Biol. 2011;46:386–408. doi: 10.3109/10409238.2011.600437. [DOI] [PubMed] [Google Scholar]
- 5.Wang X., Wood T.K. Toxin-antitoxin systems influence biofilm and persister cell formation and the general stress response. Appl. Environ. Microbiol. 2011;77:5577–5583. doi: 10.1128/AEM.05068-11. [DOI] [PMC free article] [PubMed] [Google Scholar]
- 6.Christensen-Dalsgaard M., Jørgensen M.G., Gerdes K. Three new RelE-homologous mRNA interferases of Escherichia coli differentially induced by environmental stresses. Mol. Microbiol. 2010;75:333–348. doi: 10.1111/j.1365-2958.2009.06969.x. [DOI] [PMC free article] [PubMed] [Google Scholar]
- 7.Cooper C.R., Daugherty A.J., Tachdijan S., Blum P.H., Kelly R.M. Role of vapBC toxin-antitoxin loci in the thermal stress response of Sulfolobus solfataricus. Biochem. Soc. Trans. 2009;37:123–126. doi: 10.1042/BST0370123. [DOI] [PMC free article] [PubMed] [Google Scholar]
- 8.Kolodkin-Gal I., Engelberg-Kulka H. Induction of Escherichia coli chromosomal mazEF by stressful conditions causes an irreversible loss of viability. J. Bacteriol. 2006;188:3420–3423. doi: 10.1128/JB.188.9.3420-3423.2006. [DOI] [PMC free article] [PubMed] [Google Scholar]
- 9.Aguirre-Ramírez M., Ramírez-Santos J., Van Melderen L., Gómez-Eichelmann M.C. Expression of the F plasmid ccd toxin-antitoxin system in Escherichia coli cells under nutritional stress. Can. J. Microbiol. 2006;52:24–30. doi: 10.1139/w05-107. [DOI] [PubMed] [Google Scholar]
- 10.Christensen S.K., Mikkelsen M., Pedersen K., Gerdes K. RelE, a global inhibitor of translation, is activated during nutritional stress. Proc. Natl. Acad. Sci. U.S.A. 2001;98:14328–14333. doi: 10.1073/pnas.251327898. [DOI] [PMC free article] [PubMed] [Google Scholar]
- 11.Afif H., Allali N., Couturier M., Van Melderen L. The ratio between CcdA and CcdB modulates the transcriptional repression of the ccd poison-antidote system. Mol. Microbiol. 2001;41:73–82. doi: 10.1046/j.1365-2958.2001.02492.x. [DOI] [PubMed] [Google Scholar]
- 12.Overgaard M., Borch J., Jørgensen M.G., Gerdes K. Messenger RNA interferase RelE controls relBE transcription by conditional cooperativity. Mol. Microbiol. 2008;69:841–857. doi: 10.1111/j.1365-2958.2008.06313.x. [DOI] [PubMed] [Google Scholar]
- 13.Garcia-Pino A., Balasubramanian S., Wyns L., Gazit E., De Greve H., Magnuson R.D., Charlier D., van Nuland N.A., Loris R. Allostery and intrinsic disorder mediate transcription regulation by conditional cooperativity. Cell. 2010;142:101–111. doi: 10.1016/j.cell.2010.05.039. [DOI] [PubMed] [Google Scholar]
- 14.Winther K.S., Gerdes K. Regulation of enteric vapBC transcription: induction by VapC toxin dimer-breaking. Nucleic Acids Res. 2012;40:4347–4357. doi: 10.1093/nar/gks029. [DOI] [PMC free article] [PubMed] [Google Scholar]
- 15.Neubauer C., Gao Y.G., Andersen K.R., Dunham C.M., Kelley A.C., Hentschel J., Gerdes K., Ramakrishnan V., Brodersen D.E. The structural basis for mRNA recognition and cleavage by the ribosome-dependent endonuclease RelE. Cell. 2009;139:1084–95. doi: 10.1016/j.cell.2009.11.015. [DOI] [PMC free article] [PubMed] [Google Scholar]
- 16.Pedersen K., Zavialov A.V., Pavlov M.Y., Elf J., Gerdes K., Ehrenberg M. The bacterial toxin RelE displays codon-specific cleavage of mRNAs in the ribosomal A site. Cell. 2003;112:131–140. doi: 10.1016/s0092-8674(02)01248-5. [DOI] [PubMed] [Google Scholar]
- 17.Zhang J., Zhang Y., Hoeflich K.P., Ikura M., Qing G., Inouye M. MazF cleaves cellular mRNAs specifically at ACA to block protein synthesis in Escherichia coli. Mol. Cell. 2003;12:913–923. doi: 10.1016/s1097-2765(03)00402-7. [DOI] [PubMed] [Google Scholar]
- 18.Christensen S.K., Gerdes K. RelE toxins from bacteria and Archaea cleave mRNAs on translating ribosomes, which are rescued by tmRNA. Mol. Microbiol. 2003;48:1389–1400. doi: 10.1046/j.1365-2958.2003.03512.x. [DOI] [PubMed] [Google Scholar]
- 19.Castro-Roa D., Garcia-Pino A., De Gieter S., van Nuland N.A., Loris R., Zenkin N. The Fic protein Doc uses an inverted substrate to phosphorylate and inactivate EF-Tu. Nat. Chem. Biol. 2013 doi: 10.1038/nchembio.1364. doi: 10.1038/nchembio.1364. [DOI] [PMC free article] [PubMed] [Google Scholar]
- 20.Germain E., Castro-Roa D., Zenkin N., Gerdes K. Molecular mechanism of bacterial persistence by HipA. Mol. Cell. 2013 doi: 10.1016/j.molcel.2013.08.045. doi: 10.1016/j.molcel.2013.08.045. [DOI] [PubMed] [Google Scholar]
- 21.De Jonge N., Simic M., Buts L., Haesaerts S., Roelants K., Garcia-Pino A., Sterckx Y., De Greve H., Lah J., Loris R. Alternative interactions define gyrase specificity in the CcdB family. Mol. Microbiol. 2012;84:965–978. doi: 10.1111/j.1365-2958.2012.08069.x. [DOI] [PubMed] [Google Scholar]
- 22.Yuan J., Sterckx Y., Mitchenall L.A., Maxwell A., Loris R., Waldor M.K. Vibrio cholerae ParE2 poisons DNA gyrase via a mechanism distinct from other gyrase inhibitors. J. Biol. Chem. 2010;285:40397–44008. doi: 10.1074/jbc.M110.138776. [DOI] [PMC free article] [PubMed] [Google Scholar]
- 23.De Jonge N., Garcia-Pino A., Buts L., Haesaerts S., Charlier D., Zangger K., Wyns L., De Greve H., Loris R. Rejuvenation of CcdB-poisoned gyrase by an intrinsically disordered protein domain. Mol. Cell. 2009;35:154–163. doi: 10.1016/j.molcel.2009.05.025. [DOI] [PubMed] [Google Scholar]
- 24.Jiang Y., Pogliano J., Helinski D.R., Konieczny I. ParE toxin encoded by the broad-host-range plasmid RK2 is an inhibitor of Escherichia coli gyrase. Mol. Microbiol. 2002;44:971–979. doi: 10.1046/j.1365-2958.2002.02921.x. [DOI] [PubMed] [Google Scholar]
- 25.Critchlow S.E., O’Dea M.H., Howells A.J., Couturier M., Gellert M., Maxwell A. The interaction of the F plasmid killer protein, CcdB, with DNA gyrase: induction of DNA cleavage and blocking of transcription. J. Mol. Biol. 1997;273:826–839. doi: 10.1006/jmbi.1997.1357. [DOI] [PubMed] [Google Scholar]
- 26.Bernard P., Kézdy K.E., Van Melderen L., Steyaert J., Wyns L., Pato M.L., Higgins P.N., Couturier M. The F plasmid CcdB protein induces efficient ATP-dependent DNA cleavage by gyrase. J. Mol. Biol. 1993;234:534–541. doi: 10.1006/jmbi.1993.1609. [DOI] [PubMed] [Google Scholar]
- 27.Bravo A., de Torrontegui G., Díaz R. Identification of components of a new stability system of plasmid R1, ParD, that is close to the origin of replication of this plasmid. Mol. Gen. Genet. 1987;210:101–110. doi: 10.1007/BF00337764. [DOI] [PubMed] [Google Scholar]
- 28.Tsuchimoto S., Ohtsubo H., Ohtsubo E. Two genes, pemK and pemI, responsible for stable maintenance of resistance plasmid R100. J. Bacteriol. 1988;170:1461–1466. doi: 10.1128/jb.170.4.1461-1466.1988. [DOI] [PMC free article] [PubMed] [Google Scholar]
- 29.Masuda Y., Miyakawa K., Nishimura Y., Ohtsubo E. chpA and chpB, Escherichia coli chromosomal homologs of the pem locus responsible for stable maintenance of plasmid R100. J. Bacteriol. 1993;175:6850–6856. doi: 10.1128/jb.175.21.6850-6856.1993. [DOI] [PMC free article] [PubMed] [Google Scholar]
- 30.Aizenman E., Engelberg-Kulka H., Glaser G. An Escherichia coli chromosomal “addiction module” regulated by guanosine 3’,5’-bispyrophosphate: a model for programmed bacterial cell death. Proc. Natl. Acad. Sci. U.S.A. 1996;93:6059–6063. doi: 10.1073/pnas.93.12.6059. [DOI] [PMC free article] [PubMed] [Google Scholar]
- 31.Mittenhuber G. Occurrence of mazEF-like antitoxin/toxin systems in bacteria. J. Mol. Microbiol. Biotechnol. 1999;1:295–302. [PubMed] [Google Scholar]
- 32.Anantharaman V., Aravind L. New connections in the prokaryotic toxin-antitoxin network: relationship with the eukaryotic nonsense-mediated RNA decay system. Genome Biol. 2003;4:R81. doi: 10.1186/gb-2003-4-12-r81. [DOI] [PMC free article] [PubMed] [Google Scholar]
- 33.Pandey D.P., Gerdes K. Toxin–antitoxin loci are highly abundant in free-living but lost from host-associated prokaryotes. Nucleic Acids Res. 2005;33:966–976. doi: 10.1093/nar/gki201. [DOI] [PMC free article] [PubMed] [Google Scholar]
- 34.Leplae R., Geeraerts D., Hallez R., Guglielmini J., Drèze P., Van Melderen L. Diversity of bacterial type II toxin-antitoxin systems: a comprehensive search and functional analysis of novel families. Nucleic Acids Res. 2011;39:5513–5525. doi: 10.1093/nar/gkr131. [DOI] [PMC free article] [PubMed] [Google Scholar]
- 35.Hazan R., Sat B., Engelberg-Kulka H. Escherichia coli mazEF-mediated cell death is triggered by various stressful conditions. J. Bacteriol. 2004;186:3663–3669. doi: 10.1128/JB.186.11.3663-3669.2004. [DOI] [PMC free article] [PubMed] [Google Scholar]
- 36.Kolodkin-Gal I., Hazan R., Gaathon A., Carmeli S., Engelberg-Kulka H. A linear pentapeptide is a quorum-sensing factor required for mazEF-mediated cell death in Escherichia coli. Science. 2007;318:652–655. doi: 10.1126/science.1147248. [DOI] [PubMed] [Google Scholar]
- 37.Amitai S., Yassin Y., Engelberg-Kulka H. MazF-mediated cell death in Escherichia coli: a point of no return. J. Bacteriol. 2004;186:8295–8300. doi: 10.1128/JB.186.24.8295-8300.2004. [DOI] [PMC free article] [PubMed] [Google Scholar]
- 38.Christensen-Dalsgaard M., Gerdes K. Translation affects YoeB and MazF messenger RNA interferase activities by different mechanisms. Nucleic Acids Res. 2008;36:6472–6481. doi: 10.1093/nar/gkn667. [DOI] [PMC free article] [PubMed] [Google Scholar]
- 39.Park J.H., Yamaguchi Y., Inouye M. Bacillus subtilis MazF-bs (EndoA) is a UACAU-specific mRNA interferase. FEBS Lett. 2011;585:2526–2532. doi: 10.1016/j.febslet.2011.07.008. [DOI] [PMC free article] [PubMed] [Google Scholar]
- 40.Zhu L., Inoue K., Yoshizumi S., Kobayashi H., Zhang Y., Ouyang M., Kato F., Sugai M., Inouye M. Staphylococcus aureus MazF specifically cleaves a pentad sequence, UACAU, which is unusually abundant in the mRNA for pathogenic adhesive factor SraP. J. Bacteriol. 2009;191:3248–3255. doi: 10.1128/JB.01815-08. [DOI] [PMC free article] [PubMed] [Google Scholar]
- 41.Schuster C.F., Park J.H., Prax M., Herbig A., Nieselt K., Rosenstein R., Inouye M., Bertram R. Characterization of a mazEF toxin-antitoxin homologue from Staphylococcus equorum. J. Bacteriol. 2013;195:115–125. doi: 10.1128/JB.00400-12. [DOI] [PMC free article] [PubMed] [Google Scholar]
- 42.Pimentel B., Madine M.A., de la Cueva-Méndez G. Kid cleaves specific mRNAs at UUACU sites to rescue the copy number of plasmid R1. EMBO J. 2005;24:3459–3469. doi: 10.1038/sj.emboj.7600815. [DOI] [PMC free article] [PubMed] [Google Scholar]
- 43.Pellegrini O., Mathy N., Gogos A., Shapiro L., Condon C. The Bacillus subtilis ydcDE operon encodes an endoribonuclease of the MazF/PemK family and its inhibitor. Mol. Microbiol. 2005;56:1139–1148. doi: 10.1111/j.1365-2958.2005.04606.x. [DOI] [PubMed] [Google Scholar]
- 44.Fu Z., Donegan N.P., Memmi G., Cheung A.L. Characterization of MazFSa, an endoribonuclease from Staphylococcus aureus. J. Bacteriol. 2007;189:8871–8879. doi: 10.1128/JB.01272-07. [DOI] [PMC free article] [PubMed] [Google Scholar]
- 45.Amitai S., Kolodkin-Gal I., Hananya-Meltabashi M., Sacher A., Engelberg-Kulka H. Escherichia coli MazF leads to the simultaneous selective synthesis of both “death proteins” and “survival proteins”. PLoS Genet. 2009;5:e1000390. doi: 10.1371/journal.pgen.1000390. doi: 10.1371/journal.pgen.1000390. [DOI] [PMC free article] [PubMed] [Google Scholar]
- 46.Fu Z., Tamber S., Memmi G., Donegan N.P., Cheung A.L. Overexpression of MazFsa in Staphylococcus aureus induces bacteriostasis by selectively targeting mRNAs for cleavage. J. Bacteriol. 2009;191:2051–2059. doi: 10.1128/JB.00907-08. [DOI] [PMC free article] [PubMed] [Google Scholar]
- 47.Yamaguchi Y., Nariya H., Park J.H., Inouye M. Inhibition of specific gene expressions by protein-mediated mRNA interference. Nat. Commun. 2012;3:607. doi: 10.1038/ncomms1621. doi: 10.1038/ncomms1621. [DOI] [PubMed] [Google Scholar]
- 48.Vesper O., Amitai S., Belitsky M., Byrgazov K., Kaberdina A.C., Engelberg-Kulka H., Moll I. Selective translation of leaderless mRNAs by specialized ribosomes generated by MazF in Escherichia coli. Cell. 2011;147:147–157. doi: 10.1016/j.cell.2011.07.047. [DOI] [PMC free article] [PubMed] [Google Scholar]
- 49.Moll I., Engelberg-Kulka H. Selective translation during stress in Escherichia coli. Trends Biochem. Sci. 2012;37:493–498. doi: 10.1016/j.tibs.2012.07.007. [DOI] [PMC free article] [PubMed] [Google Scholar]
- 50.Schifano J.M., Edifor R., Sharp J.D., Ouyang M., Konkimalla A., Husson R.N., Woychik N.A. Mycobacterial toxin MazF-mt6 inhibits translation through cleavage of 23S rRNA at the ribosomal A site. Proc. Natl. Acad. Sci. U.S.A. 2013;110:8501–8506. doi: 10.1073/pnas.1222031110. [DOI] [PMC free article] [PubMed] [Google Scholar]
- 51.Fu Z., Donegan N.P., Memmi G., Cheung A.L. Characterization of MazFSa, an endoribonuclease from Staphylococcus aureus. J. Bacteriol. 2007;189:8871–8879. doi: 10.1128/JB.01272-07. [DOI] [PMC free article] [PubMed] [Google Scholar]
- 52.Donegan N.P., Cheung A.L. Regulation of the mazEF toxin-antitoxin module in Staphylococcus aureus and its impact on sigB expression. J. Bacteriol. 2009;191:2795–805. doi: 10.1128/JB.01713-08. [DOI] [PMC free article] [PubMed] [Google Scholar]
- 53.Zorzini V., Haesaerts S., Fu Z., Donegan N., Cheung A., van Nuland N.A. J., Loris R. Crystallization of the Staphylococcus aureus MazF mRNA interferase. Acta Crystallogr. F. 2011;67:386–389. doi: 10.1107/S1744309111000571. [DOI] [PMC free article] [PubMed] [Google Scholar]
- 54.Zorzini V., Haesaerts S., Cheung A., Loris R., van Nuland N.A.J. 1H, 13C, and 15N backbone and side-chain chemical shift assignment of the staphylococcal MazF mRNA interferase. Biomol. NMR Assign. 2011;5:157–160. doi: 10.1007/s12104-010-9290-1. [DOI] [PubMed] [Google Scholar]
- 55.Gill S.C., von Hippel P.H. Calculation of protein extinction coefficients from amino acid sequence data. Anal. Biochem. 1989;182:319–326. doi: 10.1016/0003-2697(89)90602-7. [DOI] [PubMed] [Google Scholar]
- 56.Berne B.J., Pecora R. Dynamic Light Scattering: With Applications to Chemistry, Biology, and Physics. New York: Courier Dover Publications; 1976. [Google Scholar]
- 57.Johnson W.C., Jr Analyzing protein circular dichroism spectra for accurate secondary structures. Proteins: Struct. Funct. Genet. 1999;35:307–312. [PubMed] [Google Scholar]
- 58.Sreerama N., Woody R.W. Estimation of protein secondary structure from circular dichroismsc of CONTIN, SELCON, and CDSSTR methods with an expanded reference set. Anal. Biochem. 2000;287:252–260. doi: 10.1006/abio.2000.4880. [DOI] [PubMed] [Google Scholar]
- 59.Konarev P.V., Volkov V.V., Sokolova A.V., Koch M.H.J., Svergun D.I. PRIMUS: a Windows PC-based system for small-angle scattering data analysis. J. Appl. Cryst. 2003;36:1277–1282. [Google Scholar]
- 60.Konarev P.V., Petoukhov M.V., Volkov V.V., Svergun D.I. ATSAS 2.1, a program package for small-angle scattering data analysis. J. Appl. Cryst. 2006;39:277–286. doi: 10.1107/S0021889812007662. [DOI] [PMC free article] [PubMed] [Google Scholar]
- 61.Svergun D.I., Barberato C., Koch M.H.J. CRYSOL—a program to evaluate X-ray solution scattering of biological macromolecules from atomic coordinates. J. Appl. Crystallogr. 1995;28:768–773. [Google Scholar]
- 62.Sali A., Blundell T.L. Comparative protein modelling by satisfaction of spatial restraints. J. Mol. Biol. 1993;234:779–815. doi: 10.1006/jmbi.1993.1626. [DOI] [PubMed] [Google Scholar]
- 63.Weinkam P., Pons J., Sali A. Structure-based model of allostery predicts coupling between distant sites. Proc. Natl. Acad. Sci. U.S.A. 2012;109:4875–4880. doi: 10.1073/pnas.1116274109. [DOI] [PMC free article] [PubMed] [Google Scholar]
- 64.Pelikan M., Hura G.L., Hammel M. Structure and flexibility within proteins as identified through small angle X-ray scattering. Gen. Physiol. Biophys. 2009;28:174–189. doi: 10.4149/gpb_2009_02_174. [DOI] [PMC free article] [PubMed] [Google Scholar]
- 65.Otwinowski Z., Minor W. Processing of X-ray diffraction data collected in oscillation mode. Methods Enzymol. 1997;276:307–326. doi: 10.1016/S0076-6879(97)76066-X. [DOI] [PubMed] [Google Scholar]
- 66.Afonine P.V., Grosse-Kunstleve R.W., Echols N., Headd J.J., Moriarty N.W., Mustyakimov M., Terwilliger T.C., Urzhumtsev A., Zwart P.H., Adams P.D. Towards automated crystallographic structure refinement with phenix.refine. Acta Crystallogr. D Biol. Crystallogr. 2012;68:352–367. doi: 10.1107/S0907444912001308. [DOI] [PMC free article] [PubMed] [Google Scholar]
- 67.Emsley P., Lohkamp B., Scott W.G., Cowtan K. Features and development of Coot. Acta Cryst. D. 2010;66:486–501. doi: 10.1107/S0907444910007493. [DOI] [PMC free article] [PubMed] [Google Scholar]
- 68.Krissinel E. Macromolecular complexes in crystals and solutions. Acta Crystallogr. D Biol. Crystallogr. 2011;67:376–385. doi: 10.1107/S0907444911007232. [DOI] [PMC free article] [PubMed] [Google Scholar]
- 69.Delaglio F., Grzesiek S., Vuister G.W., Zhu G., Pfeifer J., Bax A. NMRPipe: a multidimensional spectral processing system based on UNIX pipes. J. Biomol. NMR. 1995;6:277–293. doi: 10.1007/BF00197809. [DOI] [PubMed] [Google Scholar]
- 70.Vranken W.F., Budesinsky M., Fant F., Boulez K., Borremans F.A. The complete Consensus V3 loop peptide of the envelope protein gp120 of HIV-1 shows pronounced helical character in solution. FEBS Lett. 1995;374:117–121. doi: 10.1016/0014-5793(95)01086-t. [DOI] [PubMed] [Google Scholar]
- 71.Johnson B.A., Blevins R.A. NMR View: a computer program for the visualization and analysis of NMR data. J. Biomol. NMR. 1994;4:603–614. doi: 10.1007/BF00404272. [DOI] [PubMed] [Google Scholar]
- 72.Shen Y., Lange O., Delaglio F., Rossi P., Aramini J.M., Liu G., Eletsky A., Wu Y., Singarapu K.K., Lemak A., et al. Consistent blind protein structure generation from NMR chemical shift data. Proc. Natl. Acad. Sci. U.S.A. 2008;105:4685–4690. doi: 10.1073/pnas.0800256105. [DOI] [PMC free article] [PubMed] [Google Scholar]
- 73.Shen Y., Delaglio F., Cornilescu G., Bax A. TALOS plus: a hybrid method for predicting protein backbone torsion angles from NMR chemical shifts. J. Biomol. NMR. 2009;44:213–223. doi: 10.1007/s10858-009-9333-z. [DOI] [PMC free article] [PubMed] [Google Scholar]
- 74.Guntert P., Mumenthaler C., Wuthrich K. Torsion angle dynamics for NMR structure calculation with the new program DYANA. J. Mol. Biol. 1997;273:283–298. doi: 10.1006/jmbi.1997.1284. [DOI] [PubMed] [Google Scholar]
- 75.Herrmann T., Guntert P., Wuthrich K. Protein NMR structure determination with automated NOE-identification in the NOESY spectra using the new software ATNOS. J. Biomol. NMR. 2002;24:171–189. doi: 10.1023/a:1021614115432. [DOI] [PubMed] [Google Scholar]
- 76.Nederveen A.J., Doreleijers J.F., Vranken W., Miller Z., Spronk C.A., Nabuurs S.B., Guntert P., Livny M., Markley J.L., Nilges M., et al. RECOORD: a recalculated coordinate database of 500+ proteins from the PDB using restraints from the BioMagResBank. Proteins. 2005;59:662–672. doi: 10.1002/prot.20408. [DOI] [PubMed] [Google Scholar]
- 77.Brunger A.T., Adams P.D., Clore G.M., DeLano W.L., Gros P., Grosse-Kunstleve R.W., Jiang J.S., Kuszewski J., Nilges M., Pannu N.S., et al. Crystallography & NMR system: a new software suite for macromolecular structure determination. Acta Crystallogr. D Biol. Crystallogr. 1998;54:905–921. doi: 10.1107/s0907444998003254. [DOI] [PubMed] [Google Scholar]
- 78.Farrow N.A., Muhandiram R., Singer A.U., Pascal S.M., Kay C.M., Gish G., Shoelson S.E., Pawson T., Forman-Kay J.D., Kay L.E. Backbone dynamics of a free and phosphopeptide-complexed Src homology 2 domain studied by 15N NMR relaxation. Biochemistry. 1994;33:5984–6003. doi: 10.1021/bi00185a040. [DOI] [PubMed] [Google Scholar]
- 79.Dosset P., Hus J.C., Blackledge M., Marion D. Efficient analysis of macromolecular rotational diffusion from heteronuclear relaxation data. J. Biomol. NMR. 2000;16:23–28. doi: 10.1023/a:1008305808620. [DOI] [PubMed] [Google Scholar]
- 80.Ashkenazy H., Erez E., Martz E., Pupko T., Ben-Tal N. ConSurf 2010: calculating evolutionary conservation in sequence and structure of proteins and nucleic acids. Nucleic Acids Res. 2010;38:W529–W533. doi: 10.1093/nar/gkq399. [DOI] [PMC free article] [PubMed] [Google Scholar]
- 81.Larkin M.A., Blackshields G., Brown N.P., Chenna R., McGettigan P.A., McWilliam H., Valentin F., Wallace I.M., Wilm A., Lopez R., et al. Clustal W and Clustal X version 2.0. Bioinformatics. 2007;23:2947–2948. doi: 10.1093/bioinformatics/btm404. [DOI] [PubMed] [Google Scholar]
- 82.Phillips J.C., Braun R., Wang W., Gumbart J., Tajkhorshid E., Villa E., Chipot C., Skeel R.D., Kale L., Schulten K. Scalable molecular dynamics with NAMD. J. Comput. Chem. 2005;26:1781–1802. doi: 10.1002/jcc.20289. [DOI] [PMC free article] [PubMed] [Google Scholar]
- 83.Fiers W., Contreras R., Duerinck F., Haegeman G., Iserentant D., Merregaert J., Min Jou W., Molemans F., Raeymaekers A., Van den Berghe A., et al. Complete nucleotide sequence of bacteriophage MS2 RNA: primary and secondary structure of the replicase gene. Nature. 1976;260:500–507. doi: 10.1038/260500a0. [DOI] [PubMed] [Google Scholar]
- 84.The PyMOL Molecular Graphics System. Schrödinger, LLC. Version 0.99. [Google Scholar]
- 85.Blake-Hall J., Walker O., Fushman D. Characterization of the overall rotational diffusion of a protein from 15N relaxation measurements and hydrodynamic calculations. Methods Mol. Biol. 2004;278:139–160. doi: 10.1385/1-59259-809-9:139. [DOI] [PubMed] [Google Scholar]
- 86.Simanshu D.K., Yamaguchi Y., Park J.H., Inouye M., Patel D.J. Structural basis of mRNA recognition and cleavage by toxin MazF and its regulation by antitoxin MazE in Bacillus subtilis. Mol. Cell. 2013;52:447–458. doi: 10.1016/j.molcel.2013.09.006. [DOI] [PMC free article] [PubMed] [Google Scholar]
- 87.Li G-Y., Zhang Y., Chan M.C.Y., Mal T.K., Hoeflich K.P., Inouye M., Ikura M. Characterization of dual substrate binding sites in the homodimeric structure of Escherichia coli mRNA interferase MazF. J. Mol. Biol. 2006;357:139–150. doi: 10.1016/j.jmb.2005.12.035. [DOI] [PubMed] [Google Scholar]
- 88.Dao-Thi M.H., Messens J., Wyns L., Backmann J. The thermodynamic stability of the proteins of the ccd plasmid addiction system. J. Mol. Biol. 2000;299:1373–1386. doi: 10.1006/jmbi.2000.3815. [DOI] [PubMed] [Google Scholar]
- 89.De Jonge N., Hohlweg W., Garcia-Pino A., Respondek M., Buts L., Haesaerts S., Lah J., Zangger K., Loris R. Structural and thermodynamic characterization of Vibrio fischeri CcdB. J. Biol. Chem. 2010;285:5606–5613. doi: 10.1074/jbc.M109.068429. [DOI] [PMC free article] [PubMed] [Google Scholar]
- 90.Chothia C., Lesk A.M. The relation between the divergence of sequence and structure in proteins. EMBO J. 1986;5:823–826. doi: 10.1002/j.1460-2075.1986.tb04288.x. [DOI] [PMC free article] [PubMed] [Google Scholar]
- 91.Marsh J.A., Teichmann S.A. Parallel dynamics and evolution: protein conformational fluctuations and assembly reflect evolutionary changes in sequence and structure. BioEssay. 2014;36:209–218. doi: 10.1002/bies.201300134. [DOI] [PubMed] [Google Scholar]
- 92.Bhabha G., Ekiert D.C., Jennewein M., Zmasek C.M., Tuttle L.M., Kroon G., Dyson H.J., Godzik A., Wilson I.A., Wright P.E. Divergent evolution of protein conformational dynamics in dihydrofolate reductase. Nat. Struct. Mol. Biol. 2013;20:1243–1249. doi: 10.1038/nsmb.2676. [DOI] [PMC free article] [PubMed] [Google Scholar]
- 93.Loris R., Dao-Thi M.H., Bahassi E.M., Van Melderen L., Poortmans F., Liddington R., Couturier M., Wyns L. Crystal structure of CcdB, a topoisomerase poison from E. coli. J. Mol. Biol. 1999;285:1667–1677. doi: 10.1006/jmbi.1998.2395. [DOI] [PubMed] [Google Scholar]
- 94.Bernard P., Couturier M. Cell killing by the F plasmid CcdB protein involves poisoning of DNA-topoisomerase II complexes. J. Mol. Biol. 1992;226:735–745. doi: 10.1016/0022-2836(92)90629-x. [DOI] [PubMed] [Google Scholar]
Associated Data
This section collects any data citations, data availability statements, or supplementary materials included in this article.