


Abstract
Histone variants play an important role in shaping the mammalian epigenome and their aberrant expression is frequently observed in several types of cancer. However, the mechanisms that mediate their function and the composition of the variant-containing chromatin are still largely unknown. A proteomic interrogation of chromatin containing the different H2A variants macroH2A.1.2, H2A.Bbd and H2A revealed a strikingly different protein composition. Gene ontology analysis reveals a strong enrichment of splicing factors as well as components of the mammalian replisome in H2A.Bbd-containing chromatin. We find H2A.Bbd localizing transiently to sites of DNA synthesis during S-phase and during DNA repair. Cells that express H2A.Bbd have a shortened S-phase and are more susceptible to DNA damage, two phenotypes that are also observed in human Hodgkin's lymphoma cells that aberrantly express this variant. Based on our experiments we conclude that H2A.Bbd is targeted to newly synthesized DNA during replication and DNA repair. The transient incorporation of H2A.Bbd may be due to the intrinsic instability of nucleosomes carrying this variant or a faster chromatin loading. This potentially leads to a disturbance of the existing chromatin structure, which may have effects on cell cycle regulation and DNA damage sensitivity.
INTRODUCTION
Chromatin consists of an equal mass of DNA and histone proteins and is bound by a plethora of associated factors (1–6). The fundamental unit of chromatin is the nucleosome, a structure that contains 147 bp of DNA wrapped around a histone octamer made up by the four core histones H2A, H2B, H3 and H4. Individual nucleosomes can differ from each other by a multitude of post-translational modifications and by the incorporation of distinct histone variants. Whereas relatively few variants for H4 and H2B are known, most eukaryotes have several isoforms of H3 and H2A (7). Canonical histones, which constitute the majority of the histones in a cell, are incorporated during S-phase whereas most histone variants are assembled independently of DNA synthesis. Genome-wide association studies in various organisms demonstrate a non-random association of histone variants across the genome (8) suggesting a possible function in setting up defined chromatin structures.
The structure of chromatin can undergo massive and global rearrangements during cellular differentiation (9–12), which are often accompanied by a substantial difference in the chromatin composition. Changes in chromatin structure and nuclear morphology are frequently observed during oncogenic transformation and are often used as diagnostic markers. In this light it is noteworthy that the overexpression of specific histone variants has recently been shown to be a hallmark of several cancer types. The gene encoding the replication-independent H3.3 variant for example has been found to carry a driving mutation in paediatric glioblastoma (13,14). The two prevalent mutations result in a disturbed modification of H3K27 and/or H3K36 presumably causing a mis-regulation of epigenetic marks. The centromeric H3 variant CENP-A on the other hand is overexpressed in primary colorectal cancers, which leads to a mistargeting of this variant (15) resulting in mitotic defects and an increase in aneuploidy, a hallmark of cancerous cells (16). Besides H3, several H2A variants have also been shown to be mis-regulated in cancer (17–20). The two most divergent H2A variants H2A.Bbd and macroH2A show a striking dichotomy when it comes to their involvement in cancer: whereas H2A.Bbd RNA is overexpressed in strongly proliferating Hodgkin's lymphoma (HL) cells (17), the expression of macroH2A significantly suppresses melanoma progression (18). These findings suggest that the two variants may have opposing properties in regulating cellular physiology.
MacroH2A has been named after its large C-terminal macro domain (21). Initially it was shown to be enriched on the inactive female X-chromosome in mammals (22,23) but has later been shown to also localize to large autosomal domains (1–3,8,24–26). MacroH2A stabilizes nucleosome core particles (27) and interferes with the remodeling activity of the SWI/SNF complex (22,28). Consistent with a rather repressive function, macroH2A mostly localizes to heterochromatic regions and correlates with H3K27me3-rich regions (24,29,30). H2A.Bbd preferentially binds H4 hyperacetylated regions and was named Barr body-deficient according to its striking exclusion from the inactive female X-chromosome when expressed ectopically (17,31). H2A.Bbd-containing nucleosomes organize less DNA and are less stable than canonical nucleosomes (16,32). The mouse genome contains four genes encoding putative homologues of H2A.Bbd termed H2A.Lap1–4 (33,34). The H2A.Lap1 isoform is expressed in testis and brain and localizes to the transcription start sites of active genes in round spermatids where it can even localize to the inactive X-chromosome (27,29,30,35). When ectopically expressed in HeLa cells, H2A.Bbd is enriched on active genes where it is involved in transcriptional activation and mRNA processing (29,30,36). This potential role of H2A.Bbd in transcriptional activation and splicing regulation may have important implications in HL cells that express increased levels of H2A.Bbd and also show an increased mobilization of transposable elements (37,38).
Despite a large body of work with regard to the structure and localization of nucleosomes carrying these two histone variants, surprisingly little is known about their function under physiological or pathophysiological conditions. Mice lacking both macroH2A genes are viable and fertile (39–41) but their somatic cells are more susceptible to epigenetic remodeling compared to wild type suggesting that this histone variant acts as a barrier to induced pluripotency (42). Mice lacking the H2A.Bbd homologues H2A.lap1–4 have not been reported so far but the testis-specific expression pattern suggests a role of this histone variant during male gametogenesis (35,43). In order to better understand the role of H2A.Bbd upon expression in somatic cells and its role during tumor progression, we ectopically expressed the H2A.Bbd variant in mouse embryonic fibroblasts (MEFs) and analyzed the composition of chromatin domains containing H2A.Bbd by comparing it to domains that either contained canonical H2A or the differentially localizing macroH2A.1.2 variant.
MATERIALS AND METHODS
Cell culture and cell transfection
Female MEF cells were grown under standard conditions in Dulbecco's Modified Eagle Medium (DMEM) supplemented with 10% fetal bovine serum (Sigma) and penicillin/streptomycin (PAA). Human HL cell lines L-1236 (44), L-540 (45), L-428 (27,46), HDLM-2 (28,46) and KM-H2 (24,30,47) were obtained from the Deutsche Sammlung für Mikroorganismen und Zellkulturen (Braunschweig, Germany) HL cell lines and control Epstein-Barr virus-immortalised cell lines (LCL) were cultured in RPMI 1640/GlutaMAX (Gibco) supplemented with 10% fetal bovine serum (Sigma), betamercaptoethanol and penicillin/streptomycin (PAA). Peripheral blood mononuclear cells (PBMCs) from healthy donors and patients with HL were isolated as described (31,48) with informed consent and approval by the ethics committee of the Medical Faculty of the Martin Luther University Halle-Wittenberg. MEF cells were transfected with GFP-H2A.Bbd and GFP-H2A expression plasmids using FuGENE® HD transfection reagent (Roche) according to the manufacturer's instructions. Stable cell lines were selected using G418 (PAA) at a concentration of 600 μg/ml. The GFP-macroH2A expression plasmid was transfected using the TransIT LT1 reagent (Mirus) according to the manufacturer's instructions. For live cell imaging, MEF cells stably expressing H2A.Bbd were transfected with mRFP-PCNA (49) using Amaxa nucleofection as previously described (50).
FACS sorting and FACS analysis
GFP single cell sorting was carried out using a MoFlo cell sorter (Beckman Coulter). Single cell clone suspensions of GFP-H2A.Bbd, GFP-macroH2A and GFP-H2A MEFs were analyzed using a FACS Canto flow cytometer (Beckman Coulter). The GFP signal was detected in the Fluorescein Isothiocyanate (FITC) channel, and the data analysis to quantify the GFP positive cells was performed using FlowJo software.
Chromatin purification
Adherently growing MEFs were detached by trypsinization followed by centrifugation at 200 × g. Cells were washed twice with phosphate buffered saline (PBS) and nuclei were isolated by the addition of ice-cold PBS/0.3% Triton-X. After a 10 min incubation step at 4°C, nuclei were pelleted for 10 min at 1000 × g, washed once with PBS and resuspended in EX-100 (10 mM Hepes pH 7.6, 100 mM NaCl, 1.5 mM MgCl2, 0.5 mM EGTA, 10% v/v glycerol) freshly supplemented with proteinase inhibitors. Chromatin was solubilized by 20 min micrococcal nuclease (MNase) digestion at 26°C in the presence of 2 mM CaCl2. The reaction was stopped by adding 1/50th volume of 0.5 M EGTA. All further steps were carried out at 4°C. The first supernatant (S1) was recovered after centrifugation at 1000 × g and the pellet was resuspended in resuspension buffer (1× PBS, 150 mM NaCl, 2 mM EDTA, 0.1% Triton) and over-head rotated over night (o/n) to further extract solubilized chromatin fragments. The second supernatant (S2) was recovered by a 30 min centrifugation, pooled with the first supernatant to yield the purified chromatin. A chromatin aliquot was used to check the MNase digestion by DNA purification and agarose gel electrophoresis to measure the size of chromatin fragments.
GFP pull-down
MNase-digested chromatin was precleared with 20 μl of a 1:1 (v/v) slurry of agarose beads in EX-100 (10 mM Hepes pH 7.6, 100 mM NaCl, 1.5 mM MgCl2, 0.5 mM EGTA, 10% v/v glycerol) for 1 h at 4°C. The supernatant was collected after 2 min of centrifugation at 2000 × g, 4°C. Twenty microliters of a 1:1 slurry (v/v) of GFP-binder (Chromotek) were equilibrated three times with EX-100 and then added to the supernatant. Immunoaffinity purification was performed for 2 h at 4°C. The beads were washed three times with resuspension buffer (1× PBS, 150 mM NaCl, 2 mM EDTA, 0.1% Triton) plus proteinase inhibitors and centrifuged at 4°C at 2000 × g. Fifteen microliters of 2× Lammli buffer were added to the beads and boiled for 15 min at 95°C.. Samples were run on a 15% SDS gel for 2 cm and stained with Coomassie Brilliant Blue G250 for 20 min. After destaining with 10% acetic acid, every lane was cut into eight slices and every slice was collected into a tube.
Trypsin digestion and mass spectrometry
Gel pieces were washed once with milliQ water and two times with 20 mM NH4HCO3. Destain of the gel pieces was preformed in 50% ACN, 50% NH4HCO3 at 37°C for 1 h. Samples were washed two times with 20 mM NH4HCO3 and dehydrated with 100% ACN (supplier and quality grade ultrapure). Reduction was performed in DTT 10 mM diluted in 20 mM NH4HCO3 for 1 h at room temperature. Alkylation of the gel pieces was done in 50 mM IAA diluted in 20 mM NH4HCO3 at room temperature in the dark for 30 min. Before tryptic digestion, the samples were washed once with 20 mM NH4HCO3 and dehydrated with 100% ACN. 30–50 μl of trypsin (25 ng/μl) was added to the gel pieces in ice till the gel pieces hydrated completely. Not absorbed trypsin was removed and 50 μl of 20 mM NH4HCO3 was added. The samples were incubated overnight at 37°C. The supernatant containing peptides was collected and placed in a fresh vial. Gel pieces were incubated twice in 50% ACN, 0.25% TFA, 10 min at room temperature followed by two times 100% ACN, 10 min at room temperature. All supernatants were pooled, dried and then resuspended in 15 μl 0.1% FA. Fifty percent of the sample was injected in an Ultimate 3000 HPLC system (LC Packings Dionex). Samples were desalted on-line by a C18 trapping column (300 μm i.d. 5 mm, packed with C18 PepMapTM, 5 μm, 100 Å by Thermo-Fisher Scientific), and subsequently peptides were separated with a gradient from 5% to 60% acetonitrile in 0.1% formic acid over 40 min at 300 nl/min on an analytical column (75 μm i.d.×10 cm, packed with C18-PepMap, 3 μm, 100 Å). The effluent from the HPLC was directly electro-sprayed into the LTQ Orbitrap mass spectrometer (Thermo Fisher Scientific). The mass spectrometry (MS) instrument was operated in the data-dependent mode to automatically switch between full scan MS and MS/MS acquisition. Survey MS spectra (m/z 350–2000) were acquired in the Orbitrap with resolution 60 000 at m/z 400. Fragment ion spectra were recorded in the linear trap of the instrument. For all measurements with the Orbitrap detector, three lock-mass ions from ambient air (m/z = 371.10123, 445.12002, 519.13882) were used for internal calibration as described. The six most intense peptide ions with defined charge states of 2+ and higher were sequentially isolated in a 2 Da window around the precursor signal (window = 350–2000 m/z) to a target value of 10 000 and fragmented in the linear ion trap by collision-induced dissociation (CID). The ion selection threshold for triggering acquisition of an MSMS spectrum was 10 000 counts. Previously fragmented precursor signals were excluded from repeated fragmentation analysis for 30 s. Typical mass spectrometric conditions were: spray voltage, 1.4 kV; no sheath and auxiliary gas flow; heated capillary temperature, 200°C; normalized collision energy, 35% for CID in linear ion trap.
Mass spectrometry data analysis
For protein identification, the raw data were analyzed with the Andromeda algorithm of the MaxQuant protein analysis package (version 1.2.2.5) against the IPI mouse v.3.68.Fasta including reverse sequences and contaminants. The trypsin/P enzyme was selected, allowing for maximally two missed cleavages. Carbamidomethylation of C was set as fixed modification whereas methionine oxidation and protein N-acetylation were included as variable modifications. The mass tolerance of the initial search was 20 ppm; after recalibration, a 6 ppm mass error was applied for the main search. Fragment ions were searched with a mass offset of 0.5 Da using the six most intense signals per 100 Da. Searching for secondary peptide hits within already assigned MSMS spectra was enabled. The search results were filtered with a peptide and protein false discovery rate of 0.01 with a minimum peptide length of six amino acids. Protein identifications with at least one unique or razor peptide were accepted. For the quantification, the Intensity Based Absolute Quantification (iBAQ) values were calculated from peptide intensities and the protein sequence information (51) of unmodified, M/oxidated and acetylated peptide species with a minimum of two peptides per protein. The mass spectrometry proteomics data have been deposited to the ProteomeXchange Consortium (http://www.proteomexchange.org) via the PRIDE partner repository (52) with the data set identifier PXD000789.
Statistical data analysis
Statistical analysis of protein enrichment was performed from the three affinity purification-MS replicates of the three GFP-H2A variants. First, all replicates were normalized using the median of abundant histone H4 peptides, including only peptides without modifications, less than two missed cleavages and excluding tryptic cleavage after Pro, as normalization factor. No-GFP data were not normalized, since detected H4 levels were too low. Second, normalized iBAQ values were log2 transformed and missing values were imputed from a Gaussian distribution that was shifted by a difference of about 2.5 and had a width of 0.3 using the Perseus software tool (53). The average difference of the GFP-H2A variants over cells not expressing GFP (no-GFP) was calculated and only proteins having a difference of more than 3.5 and quantitative information in at least two experiments were kept. To determine enrichment factors and p-values for enrichment, ANOVA was performed in DanteR and resulting p-values were subsequently corrected for multiple hypothesis testing using the Benjamini–Hochberg method in DanteR (54). Data were plotted with Perseus software. The gene ontology was performed using the Database for Annotation, Visualization and Integrated Discovery (DAVID) version 6.7. (55,56) Functional Annotation Charts were created using default settings.
Immunofluorescence
Cells grown on glass coverslips were fixed in PBS/3.7% FA (Roth:7398.1) for 10 min at room temperature. After fixation, the cells were washed in PBS and then permealized in 3.3 mM sodium citrate and 0.1% Triton X-100 for 5 min at room temperature. The cells were then washed two times with PBS and two times with washing solution I (PBS-Tween (0.1%) plus 0.25% BSA). Blocking was performed with blocking solution I (5 ml washing solution I/2.5% BSA) for 30 min at room temperature. Primary antibodies were diluted in blocking solution I. Incubation with the primary antibody was performed overnight at 4°C. The next day after washing with washing solution I the cells were incubated with the secondary antibodies diluted in blocking solution II (blocking solution I plus 10% normal goat serum) for 1 h at room temperature. Slides were mounted with Vectashield containing 4′,6-diamidino-2-phenylindole (DAPI; Vectore Laboratories) and sealed with nail polish. Images were acquired using a Zeiss LSM 510 META confocal microscope equipped with a 63× oil immersion objective NA = 1.4 or a Leica TCS SP5 confocal microscope with a 63× glycerol immersion objective NA = 1.3. Digital image processing, light linear adjustment of brightness and contrast, was done using ImageJ.
The primary antibodies used were anti-H3K27me3 (kind gift of Gunnar Schotta) and anti-GFP (mixture of mouse monoclonal antibodies from Roche). For detection, the cells were stained with donkey anti-mouse Alexa 488 (Jackson Immuno Research), goat anti-rabbit Cy3 (Millipore), TO-Pro-3 (Invitrogen). For live cell imaging, MEF transfected cells were plated on a glass bottom p35 dish and grown under standard conditions. 3D stacks were acquired at 20 min intervals overnight. Time lapse imaging was carried out on a UltraVIEW VoX spinning disk confocal system (PerkinElmer, UK) in a closed live cell microscopy chamber (ACU control, Olympus, Japan) heated to 37°C, with 5% CO2 and 60% air humidity control, mounted on a Nikon Ti microscope (Nikon, Japan), using a 60×/1.45 NA Planapochromat oil immersion objective lens. Images were obtained with a cooled 14 bit EMCCD camera (C9100-50, CamLink). Maximum intensity Z-projections were assembled into videos and annotated using ImageJ (http://rsb.info.nih.gov/ij/). For cyclobutane-pyrimidine dimer (CPD) analysis, cells were grown on glass coverslips. Fixation of the cells was done with 3.7% formaldehyde for 10 min at room temperature followed by a combined permeabilization and DNA denaturation step with ice-cold 0.7% Triton X-100/0.4 N HCL/PBS for 10 min. For blocking step, the cells were incubated with 4% BSA for 30 min. Immunostaining for CPD was performed by incubating the cells with monoclonal anti-CPD (Kamiya Biomedical Company, Cat no.: MC-062) at a dilution of 1:200 for 1 h at room temperature. For detection, cells were incubated with polyclonal anti-mouse IgG Cy3 (Jackson Laboratories, Cat no.: 715–165–151) at a dilution of 1:330 for 1 h at room temperature. The DNA content was stained with DAPI and finally mounted in Mowiol 4-88 (Sigma-Aldrich Chemie).
In situ replication labeling
To visualize newly synthesized DNA, cells grown on coverslips were pulse labeled with either 10 μM EdU (Figure 4) or 100 μM 5-bromo-2′-deoxyuridine (BrdU, Sigma-Aldrich) (Figure 5) and either fixed immediately or chased for the indicated time in pre-warmed medium supplemented with 200 μM thymidine. Cells were fixed with 3.7% formaldehyde for 10 min and permeabilized with 0.5% Triton X-100 for 20 min. BrdU detection was performed with rat-anti-BrdU (Gentaur, Cat no.: OBT0030CX, dilution 1:100) in the presence of DNase I as described (50). Click reaction was performed using the click-it kit (Invitrogen). Alexa Fluor 647 azide was added in a final concentration of (2 μM). The click reaction was performed for 30 min at room temperature. The cells were then stained with an anti-GFP antibody as described above.
Figure 4.
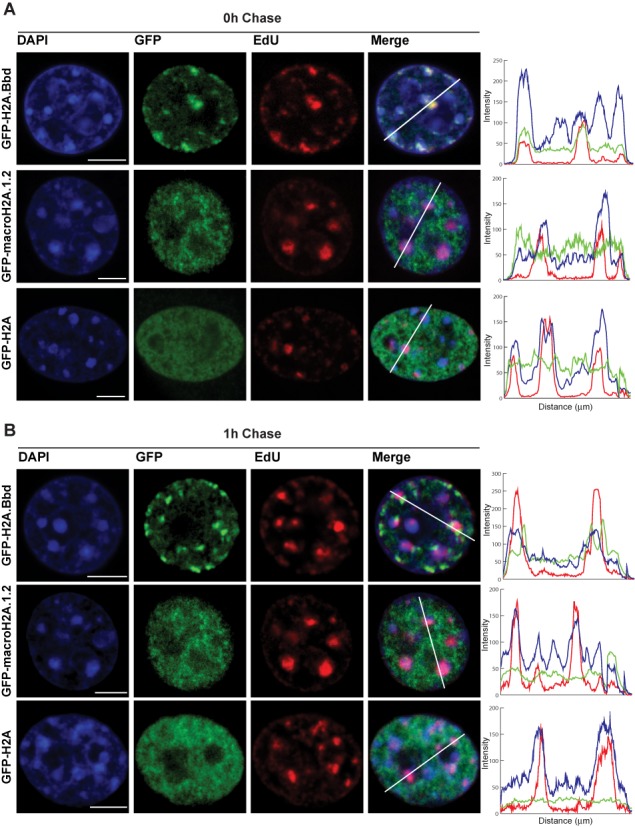
H2A.Bbd localizes to DNA synthesis sites and is replaced within 1 h. (A) Single confocal slice of female MEFs expressing the GFP-tagged histone variants pulsed labeled with EdU. (B) Single confocal slice of female MEFs expressing the GFP-tagged histone variants pulse labeled with EdU and chased for 1 h before fixation. DAPI: DNA (blue); GFP: GFP-tagged histone variant (green); EdU: replication foci (red). Scale bar: 5 μm. The channel intensity recorded along the white line is plotted on a diagram. Blue line: DNA; green line: GFP-tagged histone variants; red line: replication foci.
Figure 5.
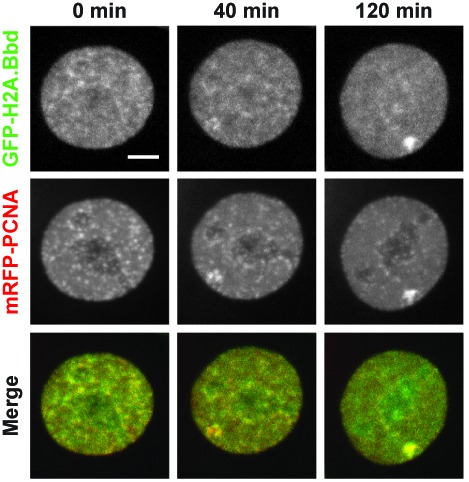
H2A.Bbd follows PCNA at replication foci. Selected frames of time-lapse imaging (see Supplementary movie) of MEF cells stably expressing GFP-H2A.Bbd (green) transfected with mRFP-PCNA (red). Z-stacks were collected every 20 min over night using a spinning disk microscope equipped with temperature, humidity and CO2 control. Shown are maximum intensity projections. Scale bars: 5 μm.
Nuclear extract for western blot analysis
GFP-histone variant transfected MEFs and HL cell lines were incubated with 0.1% Triton in PBS supplemented with proteinase inhibitor for 10 min at 4°C. After centrifugation at 3000 rpm the nuclear pellet was resuspended in 1× PBS supplemented with proteinase inhibitors and the DNA was digested with Benzonase (VWR) for 15 min at 37°C. 2× Laemmli buffer was added to the suspension of nuclei and boiled for 15 min at 95°C.
Western blot antibodies
The anti-GFP antibody (a mixture of two mouse anti-GFP monoclonal antibodies (Roche)) was used at a dilution of 1:1000, the anti-H3 antibody (Abcam ab1719) was used at a concentration of 1:5000 and the H2A.Bbd antibody (Millipore polyclonal) at a concentration of 1:1000. HRP-coupled secondary antibodies were used at a concentration of 1:5000 and detection was performed using ECL chemiluminescent reagents (GE Healthcare Life Sciences).
Microirradiation experiments
Microirradiation experiments were carried out in Nikon Ti spinning disk microscope (see live cell imaging) with a 405 nm diode laser set to 100% transmission. Approximately 1 μm spots were selected inside the nucleus and microirradiated with 1 mJ. Pre- and post-bleach images were acquired as indicated.
UV-C irradiation experiments
For UV-C irradiation experiments, the cells were irradiated with a UV-C source containing 5.8 W short wave lamps (Amersham Biosciences) at a wavelength of 254 nm. For damage induction, the media were removed from the cells and were globally irradiated for 10 s with a final dose of 1 mJ/cm2. Unirradiated cells were used as control.
CPD quantification
The levels of DNA damage were calculated from confocal 3D images of CPD stainings and DNA counterstained with DAPI using the image analysis platform Priithon (http://code.google.com/p/priithon/). The DAPI images were used to create 3D nuclear masks by applying a median filter (sigma = 500 nm) and segmenting the filtered images using automatic thresholding. The integrated CPD signal within the nuclear mask was divided by the mask volume to obtain the mean CPD intensity in each nucleus.
Quantitative reverse transcription-polymerase chain reaction
RNA from HL cell lines and PBMCs was isolated using Trizol reagent (Invitrogen, Karlsruhe, Germany) following the manufacturer's protocol. After reverse transcription of 2 μg of RNA, quantitative reverse transcription-polymerase chain reaction (qRT-PCR) was performed essentially as described (57). The following primer combinations have been used: actin beta (ACTB): 5′-ggc atc gtg atg gac tcc g-3′ and 5′-gct gga agg tgg aca gcg a-3′; H2A.Bbd: 5′-tcg ttt tca gtg agc cag gt-3′ and 5′-cag aat taa tga agg ccc aag-3′. Quantification of gene expression was performed using the 2−ΔΔCt method [H], and for comparative analysis the median Dct value from PBMC (21 independent donors) was set as one.
RESULTS
To investigate the composition of H2A.Bbd-containing chromatin we generated female MEF clonal cell lines expressing GFP-tagged H2A.Bbd, macroH2A.1.2 and -H2A. These cell lines express the corresponding histones at approximately similar levels (Figure 1A). After several weeks in culture, we noticed that whereas the levels of GFP-H2A.Bbd and GFP-H2A remained the same, the amount of GFP-macroH2A.1.2 dropped, as seen by immunoblot of nuclear extracts (Figure 1B). This phenomenon was observed in several attempts and may be caused by a negative effect of high levels of macroH2A.1.2 on the cell cycle (18) and a subsequent negative selection of the highly expressing cell clones. In agreement with previously published results, we detect GFP-macroH2A.1.2 co-localizing with the inactive X-chromosome labeled with an antibody recognizing H3K27me3 (22) whereas GFP-H2A.Bbd is largely excluded from the Barr Body (31) (Figure 1C). The canonical GFP-H2A in contrast does not show enrichment on a particular chromosome or nuclear domain (data not shown).
Figure 1.

Female MEF single clones stably express the GFP-tagged histone variants. (A) FACS profile of female MEF cell populations derived from sorted single cell clones that express H2A.Bbd, macroH2A.1.2 and H2A tagged with GFP (solid line) in comparison to untransfected control female MEF cells (dotted and filled histogram). (B) Western blot analysis of GFP-tagged histone variant expression levels with antibody against GFP. Detection of histone H3 served as loading control. (C) Nuclear localization of the histone variants GFP-H2A.Bbd and -macroH2A.1.2 in female MEFs stained with H3K27me3 (red). Arrows indicate the Barr body. Scale bar: 5 μm.
Upon establishment of stable lines expressing the different GFP-tagged histones, we isolated chromatin fragments from MEFs using micrococcal nuclease (MNase) digestion. As chromatin is organized in large domains in which not all nucleosomes contain the same histone isoform (36), we pooled chromatin fragments of different lengths that were released from the nuclei using a combination of different extraction protocols (Figure 2A). The tagged histone variants (Figure 2B) were released with similar efficiency from the nuclei, suggesting that the physicochemical properties of the nucleosomal arrays carrying specific variants in MEFs are roughly the same. MNase treatment released more than 80% of the tagged chromatin, which is comparable to the amount isolated by Tolstorukov et al. (29) and significantly higher than the levels released in experiments performed by Ishibashi et al. (34). This difference may be due to experimental differences or differences in cell culture conditions as we also observe a small fraction of GFP-H2A.Bbd in the nuclear matrix fraction. However, our isolation procedure was selective for chromatin-bound histones, as we could not release histones from nuclei without MNase digestion (Figure 2B).
Figure 2.
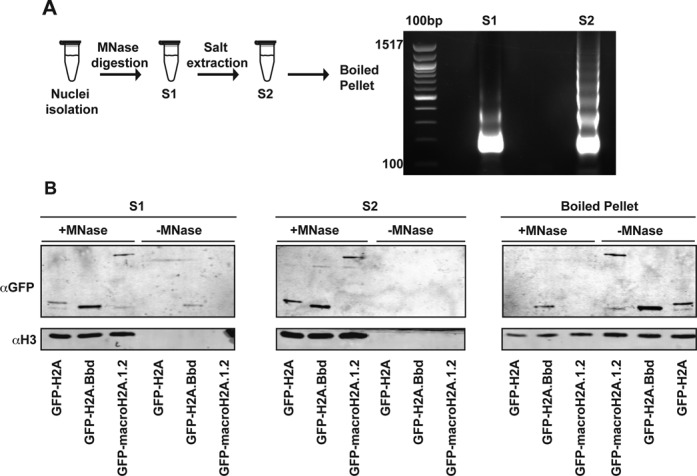
Chromatin containing GFP-tagged histone variants is released after MNase digestion. (A) Chromatin purification protocol (left) and DNA analysis of the first and second supernatants containing chromatin (S1 and S2, respectively). (B) Western blot analysis of the GFP-tagged histone variant release compared to H3 in presence or absence of chromatin MNase digestion.
The nucleosomal arrays containing GFP-H2A.Bbd, GFP-macroH2A.1.2 or GFP-H2A were purified by GFP-affinity chromatography (Figure 3A). The analysis of the protein composition of these fibres showed that, not surprisingly, the oligonucleosomal arrays contain not only the tagged versions of H2A used for purification but also all four canonical histones. This is in good agreement with our previous findings that chromatin domains are not homogenous with regard to their histone isoform/variant composition (36).
Figure 3.
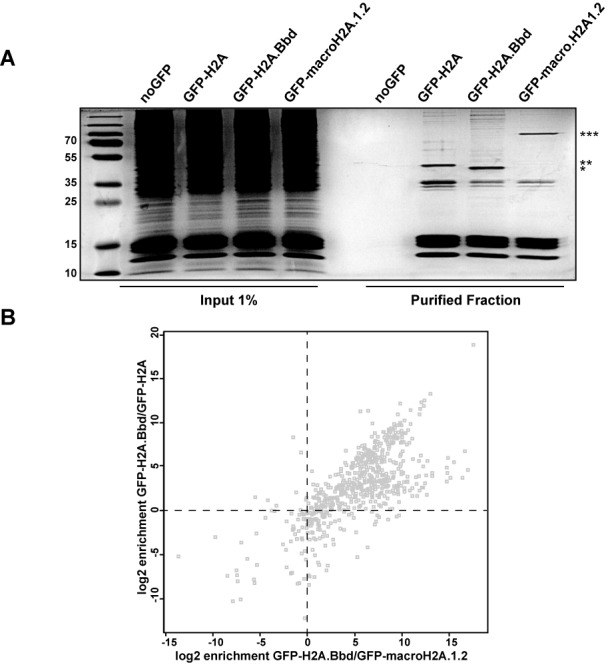
Chromatin containing the GFP-tagged histone variants shows different protein composition. (A) Coomassie blue staining of SDS-PAGE gel of chromatin fibers purified by GFP-nanotrap beads. Chromatin input and purified fractions are shown. The bands corresponding to the GFP-tagged histones are indicated: (*) GFP-H2A.Bbd, (**) GFP-H2A and (***) GFP-macroH2A.1.2. (B) Proteomic analysis of GFP-H2A.Bbd-, GFP-macroH2A.1.2- and GFP-H2A-containing chromatin. Specific proteins enriched in the GFP-H2A.Bbd pull-down over the proteins in the GFP-macroH2A.1.2 (x-axis) and GFP-H2A (y-axis) pull-downs are displayed in a scatter plot according to their log2 enrichment values.
The non-histone proteins that were isolated together with the tagged short nucleosomal arrays were identified and quantified by separation of the proteins via SDS-PAGE, and a subsequent identification by liquid chromatography-mass spectrometry (LC-MS). Proteins were identified from these runs using the Andromeda algorithm of the MaxQuant protein analysis package and quantified using their iBAQ values (51,58). We identified a total number of 1428 proteins in three independent biological replicates for each variant and control. More than 50% of the proteins are identified in at least two independent biological replicates. The overlap varies between samples: 53.4% for H2A.Bbd, 51.6% for H2A and 53.1% for -macroH2A.1.2 (Supplementary Figure S1). A protein was considered to be specifically chromatin-bound when its average log2 transformed iBAQ value had a difference of at least 3.5 between the GFP-H2A variant sample and the background control and it was detected in at least two samples. The application of these filters resulted in the identification of 607 bona fide chromatin proteins. For every chromatin-bound protein, we determined its variant specificity value as the log2 value of the ratio of the corresponding enrichment factors (Figure 3B). As expected based on the different chromosomal distributions ((22,31) and Figure 1C), the GFP-H2A.Bbd- and GFP-macroH2A.1.2-containing short nucleosomal arrays were the most divergent (Figure 3B). For the functional analysis, we focused our further analysis towards the proteins enriched in the GFP-H2A.Bbd-containing chromatin. Very little is known about the effect of H2A.Bbd on chromatin structure and its molecular function. We therefore wondered whether a global analysis of the H2A.Bbd bound proteome would provide a deeper insight. To this end, we performed a gene ontology analysis for factors enriched in the GFP-H2A.Bbd compared to the GFP-macroH2A.1.2 and the GFP-H2A samples (upper right panel, Figure 3B). Consistent with the recent finding that H2A.Bbd might play a role in RNA splicing (29,30), we observe a strong overrepresentation of gene ontology categories related to RNA maturation (Tables 1 and 2). In addition, when we compared the H2A.Bbd- with macroH2A.1.2-containing chromatin, we found a strong enrichment of factors involved in DNA replication such as PCNA, the MCM proteins, the FACT complex and the CAF1 complex (Tables 1 and 3). These proteins are also strongly enriched when comparing GFP-H2A.Bbd chromatin with chromatin isolated from cells expressing the GFP-tagged H2A isoform (Tables 2 and 3), suggesting that they are specific for GFP-H2A.Bbd rather than excluded from chromatin that contains high levels of GFP-macroH2A.1.2.
Table 1.
DNA replication factors are significantly over-represented in the GFP-H2A.Bbd compared to the GFP-macroH2A.1.2 pull-down
| Category | Term | Count | % | p-value | Bonferroni | Benjamini | FDR |
|---|---|---|---|---|---|---|---|
| GOTERM BP FAT | GO:0006396-RNA processing | 100 | 17.5 | 3.32E-59 | 3.71 E-56 | 3.71 E-56 | 5.33E-56 |
| GOTERM BP FAT | GO:0006412∼translation | 75 | 13.2 | 1.35E-44 | 1.51E-41 | 7.55E-42 | 2.17E-41 |
| GOTERM BP FAT | GO:0006397∼mRNA processing | 65 | 11.4 | 5.53E-40 | 6.17E-37 | 2.06E-37 | 8.86E-37 |
| GOTERM BP FAT | GO:0042254∼ribosome biogenesis | 45 | 7.9 | 1.22E-37 | 1.36E-34 | 3.40E-35 | 1.95E-34 |
| GOTERM BP FAT | GO:0008380-RNA splicing | 56 | 9.8 | 3.24E-37 | 3.62E-34 | 7.23E-35 | 5.19E-34 |
| GOTERM BP FAT | GO:0016071∼mRNA metabolic process | 66 | 11.6 | 5.59E-37 | 6.24E-34 | 1.04E-34 | 8.96E-34 |
| GOTERM BP FAT | GO:0022613∼ribonucleoprotein complex biogenesis | 47 | 8.2 | 1.10E-35 | 1.23E-32 | 1.76E-33 | 1.76E-32 |
| GOTERM BP FAT | GO:0006364∼rRNA processing | 29 | 5.1 | 9.06E-24 | 1.01E-20 | 1.26E-21 | 1.45E-20 |
| GOTERM BP FAT | GO:0016072∼rRNA metabolic process | 29 | 5.1 | 1.40E-23 | 1.57E-20 | 1.74E-21 | 2.25E-20 |
| GOTERM BP FAT | GO:0006325∼chromatin organization | 47 | 8.2 | 5.21 E-1 9 | 5.82E-16 | 5.82E-17 | 8.35E-16 |
| GOTERM BP FAT | GO:0051276∼chromosome organization | 53 | 9.3 | 6.67E-19 | 7.44E-16 | 6.77E-17 | 1.07E-15 |
| GOTERM BP FAT | GO:0034470∼ncRNA processing | 31 | 5.4 | 7.42E-16 | 8.67E-13 | 7.23E-14 | 1.24E-12 |
| GOTERM BP FAT | GO:0034660∼ncRNA metabolic process | 31 | 5.4 | 6.50E-13 | 7.25E-10 | 5.58E-11 | 1.04E-09 |
| GOTERM BP FAT | GO:0006260-DNA replication | 27 | 4.7 | 8.31 E-1 3 | 9.28E-10 | 6.63E-11 | 1.33E-09 |
| GOTERM BP FAT | GO:0016568∼chromatin modification | 33 | 5.8 | 1.38E-12 | 1.54E-09 | 1.03E-10 | 2.22E-09 |
| GOTERM BP FAT | GO:0006259-DNA metabolic process | 44 | 7.7 | 3.61 E-12 | 4.03E-09 | 2.52E-10 | 5.78E-09 |
| GOTERM BP FAT | GO:0016569∼covalent chromatin modification | 20 | 3.5 | 7.62E-11 | 8.50E-08 | 5.00E-09 | 1.22E-07 |
| GOTERM BP FAT | GO:0016570∼histone modification | 19 | 3.3 | 2.95E-10 | 3.30E-07 | 1.83E-08 | 4.73E-07 |
| GOTERM BP FAT | GO:0006333∼chromatin assembly or disassembly | 20 | 3.5 | 7.51 E-1 0 | 8.38E-07 | 4.41 E-08 | 1.20E-06 |
| GOTERM BP FAT | GO:0034622∼cellular macromolecular complex assembly | 25 | 4.4 | 5.55E-08 | 6.20E-05 | 3.10E-06 | 8.89E-05 |
| GOTERM BP FAT | GO:0016573∼histone acetylation | 11 | 1.9 | 6.14E-08 | 6.86E-05 | 3.27E-06 | 9.84E-05 |
| GOTERM BP FAT | GO:0006473∼protein amino acid acetylation | 11 | 1.9 | 8.28E-08 | 9.24E-05 | 4.20E-06 | 1.33E-04 |
| GOTERM_BP_FAT | GO:0034621-cellular macromolecular complex subunit organization | 25 | 4.4 | 5.41 E-07 | 6.04E-04 | 2.63E-05 | 8.67E-04 |
| GOTERM BP FAT | GO:0006350∼transcription | 91 | 16.0 | 6.46E-07 | 7.21 E-04 | 3.00E-05 | 0.00103468 |
| GOTERM BP FAT | GO:0043543∼protein amino acid acylation | 11 | 1.9 | 1.53E-06 | 0.00170809 | 6.84E-05 | 0.0024541 |
| GOTERM BP FAT | GO:0043967-histone H4 acetylation | 8 | 1.4 | 1.95E-06 | 0.0021771 | 8.38E-05 | 0.00312867 |
Top enrichment terms for the factors enriched in the H2A.Bbd/macroH2A.1.2 sample. The terms and their related p-values for Biological Processes (BP) are displayed. Category: original database/resource where the terms orient; Term: enriched term associated with the gene list; Count: gene in the list involved in the term; Percentage: involved genes/total genes; p-value: modified Fisher exact p-value, EASE score.
Table 2.
Replication factors are significantly over-represented in the GFP-H2A.Bbd compared to the GFP-H2A pull-down
| Category | Term | Count | % | p-value | Bonferroni | Benjamini | FDR |
|---|---|---|---|---|---|---|---|
| GOTERM BP FAT | GO:0006396-RNA processing | 90 | 18.6 | 1.61E-55 | 1.66E-52 | 1.66E-52 | 2.56E-52 |
| GOTERM BP FAT | GO:0006412∼translation | 73 | 15.1 | 7.94E-48 | 8.15E-45 | 4.07E-45 | 1.26E-44 |
| GOTERM BP FAT | GO:0006397∼mRNA processing | 60 | 12.4 | 5.30E-39 | 5.43E-36 | 1.81E-36 | 8.40E-36 |
| GOTERM BP FAT | GO:0008380-RNA splicing | 53 | 11.0 | 1.18E-37 | 1.21E-34 | 3.02E-35 | 1.87E-34 |
| GOTERM BP FAT | GO:0016071∼mRNA metabolic process | 61 | 12.6 | 2.38E-36 | 2.44E-33 | 4.88E-34 | 3.77E-33 |
| GOTERM BP FAT | GO:0042254∼ribosome biogenesis | 40 | 8.3 | 6.15E-34 | 6.31 E-31 | 1.05E-31 | 9.75E-31 |
| GOTERM BP FAT | GO:0022613∼ribonucleoprotein complex biogenesis | 41 | 8.5 | 2.40E-31 | 2.46E-28 | 3.52E-29 | 3.80E-28 |
| GOTERM BP FAT | GO:0006364∼rRNA processing | 24 | 5.0 | 3.70E-19 | 3.80E-16 | 4.75E-17 | 5.87E-16 |
| GOTERM BP FAT | GO:0016072∼rRNA metabolic process | 24 | 5.0 | 5.21 E-1 9 | 5.35E-16 | 5.94E-17 | 8.26E-16 |
| GOTERM BP FAT | GO:0034470∼ncRNA processing | 26 | 5.4 | 3.25E-13 | 3.34E-10 | 3.34E-11 | 5.16E-10 |
| GOTERM BP FAT | GO:0034660∼ncRNA metabolic process | 26 | 5.4 | 8.46E-11 | 8.68E-08 | 7.89E-09 | 1.34E-07 |
| GOTERM BP FAT | GO:0006325∼chromatin organization | 31 | 6.4 | 7.43E-10 | 7.62E-07 | 6.35E-08 | 1.18E-06 |
| GOTERM BP FAT | GO:0051276∼chromosome organization | 34 | 7.0 | 5.25E-09 | 5.39E-06 | 4.14E-07 | 8.32E-06 |
| GOTERM BP FAT | GO:0006260-DNA replication | 20 | 4.1 | 1.39E-08 | 1.42E-05 | 1.02E-06 | 2.20E-05 |
| GOTERM BP FAT | GO:0006259∼DNA metabolic process | 31 | 6.4 | 5.34E-07 | 5.48E-04 | 3.66E-05 | 8.47E-04 |
| GOTERM BP FAT | GO:0016568∼chromatin modification | 22 | 4.5 | 8.78E-07 | 9.01 E-04 | 5.63E-05 | 0.00139236 |
| GOTERM BP FAT | GO:0034622∼cellular macromolecular complex assembly | 21 | 4.3 | 9.26E-07 | 9.50E-04 | 5.59E-05 | 0.00146848 |
Top enrichment terms for the factors enriched in the H2A.Bbd/H2A sample. The terms and their related p-values for Biological Processes (BP) are displayed. Category: original database/resource where the terms orient; Term: enriched term associated with the gene list; Count: gene in the list involved in the term; Percentage: involved genes/total genes; p-value: modified Fisher exact p-value, EASE score.
Table 3.
Replication associated factors are enriched in chromatin containing GFP-H2A.Bbd
| Protein names | Iog2 enrichment GFPH2A.Bbd/GFP-H2A | p-value | Iog2 enrichment GFP-H2A.Bbd/GFP-macroH2A.1.2 | p-value |
|---|---|---|---|---|
| Pcna | 9.26 | 0.00555361 | 9.03 | 0.0041637 |
| Gins1 | 7.42 | 0.01801521 | 5.80 | 0.0312951 |
| Mcm3 | 5.44 | 0.2943226 | 4.84 | 0.2709437 |
| Cdc21;Mcm4 | −1.04 | 0.4773969 | 0.09 | 0.9612214 |
| Cdc46;Mcm5 | 0.25 | 0.9734912 | 6.21 | 0.1672788 |
| Cdc47;Mcm7 | 1.17 | 0.7511821 | 2.63 | 0.2726894 |
| Mcm6 | 0.86 | 0.9215584 | 3.21 | 0.4707804 |
| Ssrpl | 4.31 | 0.1783074 | 10.13 | 0.0091877 |
| Fact140 | 5.35 | 0.1497874 | 9.86 | 0.0166473 |
| Chaflb | 7.02 | 0.09077201 | 5.98 | 0.1004223 |
| Rbbp4 | 2.56 | 0.6075331 | 3.46 | 0.3578618 |
| Rfc4 | 8.25 | 0.1551118 | 9.51 | 0.0762587 |
| Rfc2 | 6.89 | 0.1028537 | 7.39 | 0.0611908 |
| Rfc3 | 1.49 | 0.9385401 | 2.87 | 0.8451195 |
Enriched replication factors in the GFP-H2A.Bbd-containing chromatin are displayed according to their enrichment factors and p-values calculated in the GFP-H2A.Bbd/GFP-macroH2A.1.2 and in the GFP-H2A.Bbd/GFP-H2A samples.
When characterizing the nuclear distribution of GFP-H2A.Bbd, we noticed a subpopulation of cells that had a particular GFP-H2A.Bbd localization pattern. In contrast with the hypothesis that H2A.Bbd is preferentially found in transcriptionally active chromatin, these cells showed a strong association with DAPI dense regions within the nucleus, which are usually considered to be transcriptionally inert (Supplemental Figure S2). Based on our observation that GFP-H2A.Bbd is associated with the replication machinery, we wondered whether the cells that showed this particular localization pattern are in fact engaged in replicating heterochromatic DNA.
We therefore labeled asynchronously growing MEFs ectopically expressing GFP-H2A.Bbd with EdU to identify cells that are in S-phase. Consistent with our hypothesis we observed a striking co-localization of the EdU signal with GFP-H2A.Bbd in all S-phase cells (Figure 4A and Supplementary Figure S3). However, after a 1 h chase following the 30 min EdU labelling, the co-localization is lost suggesting a transient interaction (Figure 4B). To get a better understanding of the dynamic localization of H2A.Bbd to sites of DNA synthesis, we performed live cell imaging of cell lines expressing GFP-tagged H2A.Bbd (Figure 5 and Supplementary movie). High-resolution microscopy revealed that H2A.Bbd is incorporated slightly after PCNA is recruited to sites of DNA replication, which confirms our finding that H2A.Bbd interacts with PCNA-containing chromatin (Figure 5). Using this technique we could also determine a residence time of H2A.Bbd at replication foci of less than 10 min at early replicating foci and 30 min at sites of late replication (Supplementary Figure S4). As we see a close association with PCNA, we wondered whether GFP-H2A.Bbd is also incorporated at sites of DNA damage. For this we microirradiated MEFs expressing GFP-tagged H2A.Bbd at 450 nm for 1200 ms. After irradiation, PCNA quickly localizes to sites of DNA damage followed by GFP-H2A.Bbd, which is similar to their timing of localization to DNA replication sites. However, in contrast to replication sites, GFP-H2A.Bbd can be detected at repair foci for at least 2 h (Figure 6).
Figure 6.

H2A.Bbd accumulates at DNA damage sites following PCNA. Time-lapse imaging of microirradiated MEF cells stably expressing GFP-H2A.Bbd (green) and transfected with mRFP-PCNA (red) at 405 nm for 1200 ms. Images were collected before microirradiation and 5 s, 10/50 and 110 min after microirradiation. Scale bars: 5 μm.
In order to investigate whether the expression of H2A.Bbd has an effect on replication and DNA damage, we compared the S-phase length of cells expressing GFP-H2A.Bbd with the ones expressing the canonical GFP-H2A. In agreement with the hypothesis that H2A.Bbd facilitates chromatin remodeling or assembly during DNA replication, we detect a 20% shorter S-phase in the GFP-H2A.Bbd expressing MEFs compared to the GFP-H2A expressing cells (Figure 7A). Moreover, the expression of H2A.Bbd also increases the sensitivity to UV based DNA damage as measured by the increased formation of CPDs (Figure 7B). The shortening of S-phase and increased sensitivity toward DNA damage are hallmarks of cancer cells. Indeed, the analysis of Gene Expression Omnibus microarray data sets from HL cell lines and primary HL samples in comparison with normal tissue revealed increased levels of H2A.Bbd RNA in a large number of HL lines ((17); Figure 7C). Consistent with this finding, chromatin isolated from HL cells contains much higher levels of H2A.Bbd than control cells (Figure 7D) where H2A.Bbd is not detectable. Interestingly, the total levels of H2A.Bbd vary substantially in different HL lines with the ones containing a lot of H2A.Bbd having a shorter doubling time than the ones with lower expression levels ((32); Figure 7E), suggesting that H2A.Bbd overexpression might have a similar effect in MEFs and tumor cells.
Figure 7.
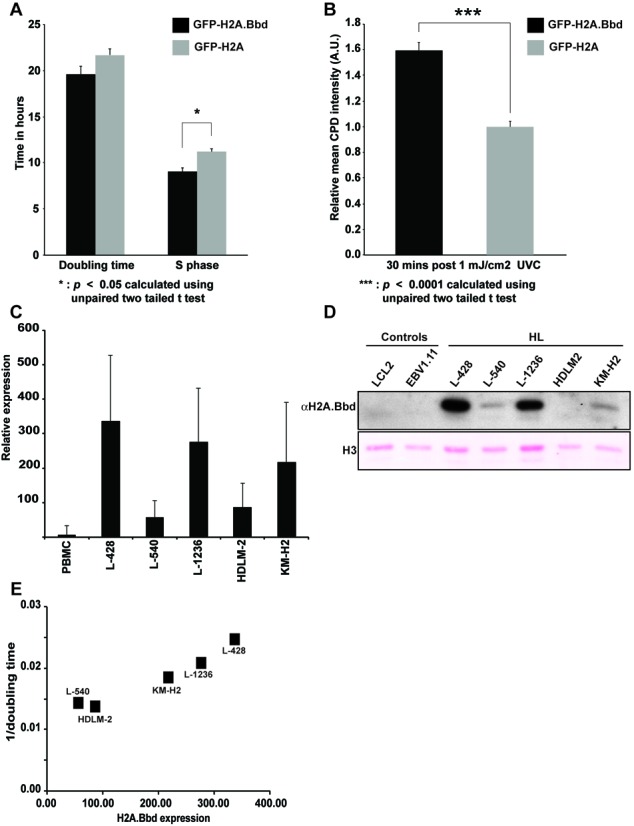
MEF cells and HL lines expressing H2A.Bbd replicate faster and are more sensitive to DNA damage. (A) Doubling time and S-phase length in MEF cells stably expressing GFP-H2A.Bbd and GFP-H2A. (B) Mean intensity of nuclear CPD signal 10 and 30 min post 1 mJ UV-C irradiation. Error bars represent the 95% confidence interval. N > 30 (C) qRT-PCR expression analysis of H2A.Bbd in HL cells and control cells. cDNA from HL cell lines (two independent experiments) and normal PBMC (21 donors) was used as template for quantitative PCR. For calculation of relative expression values, actin beta was used as housekeeping control and the median expression in normal PBMC was set as 1. (D) Western blot analysis of H2A.Bbd in Hodgkin's lymphoma cells (HL) and control cell lines. Ponceau staining of histone H3 is used as loading control. (E) Dot plot showing the correlation in Hodgkin's lymphoma cell lines between the doubling time derived from (32) (y-axis) and the expression levels of H2A.Bbd (x-axis) measured by qRT-PCR. Every dot represents a specific Hodgkin's lymphoma cell line.
DISCUSSION
So far most studies addressing the function of the histone variant H2A.Bbd focused either on the structural characteristics of nucleosomes containing these variants (33) or on the DNA sequences that are associated with it (27,29,30). However, the physicochemical properties of chromatin and its function are mainly defined by associated proteins. As the current knowledge about the proteome bound to the H2A.Bbd-containing chromatin is limited, we performed a detailed proteomic analysis on chromatin isolated from cells expressing a GFP-tagged version of H2A.Bbd and used the purification of nucleosomal arrays containing GFP-macroH2A.1.2 and GFP-H2A as highly specific filters for a differential proteomics approach. As the cells we use to analyze H2A.Bbd bound chromatin do not show significant expression levels of this variant, the system most likely reflects the situation in tumor cells that have a high expression level for H2A.Bbd.
In agreement with earlier findings investigating chromatin fibres containing H3 variants H3.1 and H3.3 (36), we observed that arrays of nucleosomes containing either one of the two H2A variants also contain a sizeable amount of canonical histones. Despite this apparent heterogeneity of the purified fibres, these histone variants have a major impact on the proteomic composition of chromatin. Noteworthy, the number of proteins detected in GFP-H2A.Bbd chromatin is higher compared to chromatin isolated from GFP-H2A or GFP-macroH2A 1.2. This observation could be due to an intrinsic feature of H2A.Bbd containing chromatin or a result of slight expression differences of the histone variants within the cells. In order not to bias our quantitative analysis, we normalized the resulting quantitative information of all variant specific chromatin proteins to the total amount of isolated chromatin using the histone H4 iBAQ values.
We observed a striking enrichment of factors involved in DNA replication within the GFP-H2A.Bbd-containing nucleosomal arrays in an asynchronous population of cells. Although most proteins reported to reside in the mammalian replisome are enriched in the GFP-H2A.Bbd associated chromatin, not all enrichment values are significantly different among the variant containing chromatin when analyzed by rigorous statistical testing. This may well be due to the fact that only a fraction of cells within the population is actively replicating and incorporating H2A.Bbd at sites of DNA synthesis.
Nevertheless, the presence of factors associated with DNA replication in the chromatin containing GFP-H2A.Bbd prompted us to analyze its involvement in this process using alternative methods. Indeed, when we analyzed DNA replication by immunohistochemistry and live cell imaging, we observed a strong co-localization pattern of GFP-H2A.Bbd with sites of DNA replication. Interestingly, a previous report had reported a dotted staining pattern in a small fraction of H2A.Bbd transfected MEFs (34), which in light of our findings most likely reflects replicating chromatin. Histone variants have been shown to be recruited to DNA repair foci (37), however, they have not been found co-localizing with replicating DNA. H2A.Bbd is a striking exception to this rule. Interestingly, this enrichment is only transient as the co-localization of H2A.Bbd with newly synthesized DNA is only detected for less than 60 min, which may be the reason why it has gone unnoticed so far. This apparent instability of the newly formed nucleosome is in agreement with the observed low intrinsic stability of the H2A.Bbd-containing particles and its inability to bind the linker histone H1 (39,41).
H2A.Bbd is incorporated at both early and late replicating chromatin during S-phase, which points to a general role of the DNA synthesis machinery in the incorporation of this histone variant. Alternatively, the localization of H2A.Bbd to sites of DNA synthesis might reflect its ability to bind to naked DNA at replication sites. However, we do not think this is the sole mechanism of incorporation as we do not observe it for the canonical H2A variant that is expressed to comparable levels and has a similar affinity for naked DNA.
The differential residence time of H2A.Bbd in early or late replicating foci may be related to the different efficiency of replication fork progression in eu- and heterochromatin or to a different binding dynamics of an H2A.Bbd interacting factor. What is intriguing, however, is the substantial increase in residence time on DNA repair foci, which may be due to an extended presence of PCNA at those regions.
Like most other studies performed before, we do not investigate H2A.Bbd containing chromatin isolated from cells that naturally express this variant. It is therefore difficult to make a conclusion about its physiological function. However, it is tempting to speculate that the incorporation of H2A.Bbd at sites of DNA synthesis could physiologically contribute to the maturation of sperm and the replacement of the canonical histone with protamines. The putative mouse homologue H2A.Lap1 is expressed in all stages of spermatogenesis with the highest level between the late pachytene and round spermatid stage when it is exported to the cytosol and another H2A.Bbd-like histone becomes incorporated into the chromatin (17–20,35). The presence of H2A.Bbd-like histones in mouse coincides with episodes of increased DNA breakage in sperm (17,18,21,35,59). Moreover, the DNA repair machinery might facilitate the incorporation of H2A.Bbd, thereby facilitating DNA recombination and protamine exchange. As spermatocytes expressing H2A.Bbd are postmitotic, it is unlikely that H2A.Bbd plays a role in DNA replication.
As pointed out above, our system more closely resembles the elevated expression of H2A.Bbd in HL cells (Figure 7C and D. Such an overexpression might result in a faster S-phase progression similar to what we observe in MEFs expressing GFP-H2A.Bbd (Figure 7). Indeed, HL cell lines with lower expression of H2A.Bbd (cell lines L-540 and HDLM-2) have longer doubling times than cell lines with higher expression of H2A.Bbd (22,23,32). HL high sensitivity to radio- and chemotherapy is known for a long time and has led to the development of highly effective treatment regimens (reviewed in (60)). H2A.Bbd is specifically overexpressed in HL cell lines and in HL cells in vivo (17) and might be involved in the high success of radio- and chemotherapy for treatment of these patients.
CONCLUSION
Our data support a functional compartmentalization of chromatin by histone variants and their associated factors. The finding that H2A.Bbd transiently localizes to sites of DNA synthesis in cells thereby increasing S-phase progression and sensitizing the cells for DNA damaging UV irradiation opens up new avenues for the investigation of the function of this exceptional histone variant in healthy and diseased tissue.
SUPPLEMENTARY DATA
Supplementary Data are available at NAR Online.
Acknowledgments
We would like to thank the labs of Emily Bernstein, Dimitri Thanos and Aloys Schepers for expression constructs and control cell lines. We would also like to thank Joachim W. Ellwart from the Cell Sorting Service at the Helmholtz Centre Munich for help with the FACS sorting. V.S. carried out the chromatin purifications, the EdU labelling of nascent chromatin and the H2A.Bbd detection in Hodgkin's lymphoma cells. C.S.C.D. and M.R. did the live cell imaging and the functional assays in MEF expressing various H2A variants. A.W.T. acquired confocal images of fixed MEFs and following EdU replication labelling. A.S. did the statistical analysis of the mass spectrometry data. C.B. helped in FACS sorting the MEFs stably expressing H2A and H2A.Bbd. M.S.S. provided the HL cell lines and performed real-time PCR experiments. S.B.H. and M.C.C. participated in the experimental design and interpretation of the data and A.I. conceived the study, participated in its design and wrote the manuscript. All authors read and approved the final manuscript.
Footnotes
Present addresses:
Corella S. Casas-Delucchi, Cancer Research UK London Research Institute, Clare Hall Laboratories, South Mimms EN6 3LD, UK.
Clemens Bönisch, Institute of Experimental Genetics, Helmholtz Zentrum München GmbH - German Research Center for Environmental Health, Neuherberg, Germany.
FUNDING
German Research Foundation (DFG, SFB TR5) (S.B.H.) [DFG Ca 198/7 and DFG GRK1657/1 to M.C.C.], Center for Integrated Protein Science Munich (CIPSM) (S.B.H.); European Union (Stategra) (S.B.H.); Marie Curie Fellowship [INTEGER 214902 to V.S.]; European Union [EpiGeneSys 257082 to V.S.]; Peter-Escher-Foundation for children with cancer (M.S.S.). Source of open access funding: EpiGeneSys 257082.
Conflict of interest statement. None declared.
REFERENCES
- 1.LeRoy G., Floudas C.A., Hake S.B., Garcia B.A. Proteomic interrogation of human chromatin. PLoS One. 2011. [DOI] [PMC free article] [PubMed]
- 2.Khoudoli G.A., Gillespie P.J., Stewart G., Andersen J.S., Swedlow J.R., Blow J.J. Temporal profiling of the chromatin proteome reveals system-wide responses to replication inhibition. Curr. Biol. 2008;18:838–843. doi: 10.1016/j.cub.2008.04.075. [DOI] [PMC free article] [PubMed] [Google Scholar]
- 3.Dutta B., Adav S.S., Koh C.G., Lim S.K., Meshorer E., Sze S.K. Elucidating the temporal dynamics of chromatin-associated protein release upon DNA digestion by quantitative proteomic approach. J. Proteomics. 2012;75:5493–5506. doi: 10.1016/j.jprot.2012.06.030. [DOI] [PubMed] [Google Scholar]
- 4.Ohta S., Bukowski-Wills J.-C., Sanchez-Pulido L., Alves F.de, L., Wood L., Chen Z.A., Platani M., Fischer L., Hudson D.F., Ponting C.P., et al. The protein composition of mitotic chromosomes determined using multiclassifier combinatorial proteomics. Cell. 2010;142:810–821. doi: 10.1016/j.cell.2010.07.047. [DOI] [PMC free article] [PubMed] [Google Scholar]
- 5.Chu D.S., Liu H., Nix P., Wu T.F., Ralston E.J., Yates J.R., Meyer B.J. Sperm chromatin proteomics identifies evolutionarily conserved fertility factors. Nature. 2006;443:101–105. doi: 10.1038/nature05050. [DOI] [PMC free article] [PubMed] [Google Scholar]
- 6.Franklin S., Chen H., Mitchell-Jordan S., Ren S., Wang Y., Vondriska T.M. Quantitative analysis of the chromatin proteome in disease reveals remodeling principles and identifies high mobility group protein B2 as a regulator of hypertrophic growth. Mol. Cell. Proteomics. 2012;11:M111.014258–M111.014258. doi: 10.1074/mcp.M111.014258. [DOI] [PMC free article] [PubMed] [Google Scholar]
- 7.Talbert P.B., Ahmad K., Almouzni G., Ausió J., Berger F., Bhalla P.L., Bonner W.M., Cande W.Z., Chadwick B.P., Chan S.W.L., et al. A unified phylogeny-based nomenclature for histone variants. Epigenet. Chromatin. 2012;5:7–26. doi: 10.1186/1756-8935-5-7. [DOI] [PMC free article] [PubMed] [Google Scholar]
- 8.Hake S.B., Allis C.D. Histone H3 variants and their potential role in indexing mammalian genomes: the “H3 barcode hypothesis”. Proc. Natl. Acad. Sci. U.S.A. 2006;103:6428–6435. doi: 10.1073/pnas.0600803103. [DOI] [PMC free article] [PubMed] [Google Scholar]
- 9.Schneider T.D., Arteaga-Salas J.M., Mentele E., David R., Nicetto D., Imhof A., Rupp R.A.W. Stage-specific histone modification profiles reveal global transitions in the Xenopus embryonic epigenome. PLoS One. 2011;6:e22548. doi: 10.1371/journal.pone.0022548. [DOI] [PMC free article] [PubMed] [Google Scholar]
- 10.Bhattacharya D., Talwar S., Mazumder A., Shivashankar G.V. Spatio-temporal plasticity in chromatin organization in mouse cell differentiation and during Drosophila embryogenesis. Biophys. J. 2009;96:3832–3839. doi: 10.1016/j.bpj.2008.11.075. [DOI] [PMC free article] [PubMed] [Google Scholar]
- 11.Meshorer E., Yellajoshula D., George E., Scambler P.J., Brown D.T., Misteli T. Hyperdynamic plasticity of chromatin proteins in pluripotent embryonic stem cells. Dev. Cell. 2006;10:105–116. doi: 10.1016/j.devcel.2005.10.017. [DOI] [PMC free article] [PubMed] [Google Scholar]
- 12.Dai B., Rasmussen T.P. Global epiproteomic signatures distinguish embryonic stem cells from differentiated cells. Stem Cells. 2007;25:2567–2574. doi: 10.1634/stemcells.2007-0131. [DOI] [PubMed] [Google Scholar]
- 13.Wu G., Broniscer A., McEachron T.A., Lu C., Paugh B.S., Becksfort J., Qu C., Ding L., Huether R., Parker M., et al. Somatic histone H3 alterations in pediatric diffuse intrinsic pontine gliomas and non-brainstem glioblastomas. Nat. Genet. 2012;44:251–253. doi: 10.1038/ng.1102. [DOI] [PMC free article] [PubMed] [Google Scholar]
- 14.Schwartzentruber J., Korshunov A., Liu X.-Y., Jones D.T.W., Pfaff E., Jacob K., Sturm D., Fontebasso A.M., Quang D.-A.K., Tönjes M. Driver mutations in histone H3.3 and chromatin remodelling genes in paediatric glioblastoma. 2012. doi:10.1038/nature10833. [DOI] [PubMed]
- 15.Lacoste N., Woolfe A., Tachiwana H., Garea A.V., Barth T., Cantaloube S., Kurumizaka H., Imhof A., Almouzni G. Mislocalization of the centromeric histone variant CenH3/CENP-A in human cells depends on the chaperone DAXX. Mol. Cell. 2014;53:631–644. doi: 10.1016/j.molcel.2014.01.018. [DOI] [PubMed] [Google Scholar]
- 16.Tomonaga T., Matsushita K., Yamaguchi S., Oohashi T., Shimada H., Ochiai T., Yoda K., Nomura F. Overexpression and mistargeting of centromere protein-A in human primary colorectal cancer. Cancer Res. 2003;63:3511–3516. [PubMed] [Google Scholar]
- 17.Winkler C., Steingrube D.S., Altermann W., Schlaf G., Max D., Kewitz S., Emmer A., Kornhuber M., Banning-Eichenseer U., Staege M.S. Hodgkin's lymphoma RNA-transfected dendritic cells induce cancer/testis antigen-specific immune responses. Cancer Immunol. Immunother. 2012;61:1769–1779. doi: 10.1007/s00262-012-1239-z. [DOI] [PMC free article] [PubMed] [Google Scholar]
- 18.Kapoor A., Goldberg M.S., Cumberland L.K., Ratnakumar K., Segura M.F., Emanuel P.O., Menendez S., Vardabasso C., LeRoy G., Vidal C.I., et al. The histone variant macroH2A suppresses melanoma progression through regulation of CDK8. Nature. 2010;468:1105–1109. doi: 10.1038/nature09590. [DOI] [PMC free article] [PubMed] [Google Scholar]
- 19.Svotelis A., Gévry N., Grondin G., Gaudreau L. H2A.Z overexpression promotes cellular proliferation of breast cancer cells. Cell Cycle. 2010;9:364–370. doi: 10.4161/cc.9.2.10465. [DOI] [PubMed] [Google Scholar]
- 20.Hua S., Kallen C.B., Dhar R., Baquero M.T., Mason C.E., Russell B.A., Shah P.K., Liu J., Khramtsov A., Tretiakova M.S. Genomic analysis of estrogen cascade reveals histone variant H2A.Z associated with breast cancer progression. Mol. Syst. Biol. 2008;4:188. doi: 10.1038/msb.2008.25. [DOI] [PMC free article] [PubMed] [Google Scholar]
- 21.Pehrson J.R., Fried V.A. MacroH2A, a core histone containing a large nonhistone region. Science. 1992;257:1398–1400. doi: 10.1126/science.1529340. [DOI] [PubMed] [Google Scholar]
- 22.Costanzi C., Pehrson J.R. Histone macroH2A1 is concentrated in the inactive X chromosome of female mammals. Nature. 1998;393:599–601. doi: 10.1038/31275. [DOI] [PubMed] [Google Scholar]
- 23.Mietton F., Sengupta A.K., Molla A., Picchi G., Barral S., Heliot L., Grange T., Wutz A., Dimitrov S. Weak but uniform enrichment of the histone variant macroH2A1 along the inactive X chromosome. Mol. Cell. Biol. 2009;29:150–156. doi: 10.1128/MCB.00997-08. [DOI] [PMC free article] [PubMed] [Google Scholar]
- 24.Gamble M.J., Frizzell K.M., Yang C., Krishnakumar R., Kraus W.L. The histone variant macroH2A1 marks repressed autosomal chromatin, but protects a subset of its target genes from silencing. Genes Dev. 2010;24:21–32. doi: 10.1101/gad.1876110. [DOI] [PMC free article] [PubMed] [Google Scholar]
- 25.Agelopoulos M., Thanos D. Epigenetic determination of a cell-specific gene expression program by ATF-2 and the histone variant macroH2A. EMBO J. 2006;25:4843–4853. doi: 10.1038/sj.emboj.7601364. [DOI] [PMC free article] [PubMed] [Google Scholar]
- 26.Buschbeck M., Uribesalgo I., Wibowo I., Rué P., Martin D., Gutierrez A., Morey L., Guigo R., López-Schier H., Di Croce L. The histone variant macroH2A is an epigenetic regulator of key developmental genes. Nat. Struct. Mol. Biol. 2009;16:1074–1079. doi: 10.1038/nsmb.1665. [DOI] [PubMed] [Google Scholar]
- 27.Abbott D.W., Chadwick B.P., Thambirajah A.A., Ausió J. Beyond the Xi: macroH2A chromatin distribution and post-translational modification in an avian system. J. Biol. Chem. 2005;280:16437–16445. doi: 10.1074/jbc.M500170200. [DOI] [PubMed] [Google Scholar]
- 28.Angelov D., Molla A., Perche P.-Y., Hans F., Cote J., Khochbin S., Bouvet P., Dimitrov S. The histone variant macroH2A interferes with transcription factor binding and SWI/SNF nucleosome remodeling. Mol. Cell. 2003;11:1033–1041. doi: 10.1016/s1097-2765(03)00100-x. [DOI] [PubMed] [Google Scholar]
- 29.Tolstorukov M.Y., Goldman J.A., Gilbert C., Ogryzko V., Kingston R.E., Park P.J. Histone variant H2A.Bbd Is associated with active transcription and mRNA processing in human cells. Mol. Cell. 2012;47:1–12. doi: 10.1016/j.molcel.2012.06.011. [DOI] [PMC free article] [PubMed] [Google Scholar]
- 30.Ioudinkova E.S., Barat A., Pichugin A., Markova E., Sklyar I., Pirozhkova I., Robin C., Lipinski M., Ogryzko V., Vassetzky Y.S., et al. Distinct distribution of ectopically expressed histone variants H2A.Bbd and MacroH2A in open and closed chromatin domains. PLoS One. 2012;7:e47157. doi: 10.1371/journal.pone.0047157. [DOI] [PMC free article] [PubMed] [Google Scholar]
- 31.Chadwick B.P., Willard H.F. A novel chromatin protein, distantly related to histone H2A, is largely excluded from the inactive X chromosome. J. Cell Biol. 2001;152:375–384. doi: 10.1083/jcb.152.2.375. [DOI] [PMC free article] [PubMed] [Google Scholar]
- 32.Drexler H.G. Guide to leukemia-lymphoma cell lines. 2nd edn. Braunschweig: German Collection of Microorganisms and Cell Cultures; 2010. [Google Scholar]
- 33.Gautier T., Abbott D.W., Molla A., Verdel A., Ausió J., Dimitrov S. Histone variant H2ABbd confers lower stability to the nucleosome. EMBO Rep. 2004;5:715–720. doi: 10.1038/sj.embor.7400182. [DOI] [PMC free article] [PubMed] [Google Scholar]
- 34.Ishibashi T., Li A., Eirín-López J.M., Zhao M., Missiaen K., Abbott D.W., Meistrich M., Hendzel M.J., Ausió J. H2A.Bbd: an X-chromosome-encoded histone involved in mammalian spermiogenesis. Nucleic Acids Res. 2010;38:1780–1789. doi: 10.1093/nar/gkp1129. [DOI] [PMC free article] [PubMed] [Google Scholar]
- 35.Soboleva T.A., Nekrasov M., Pahwa A., Williams R., Huttley G.A., Tremethick D.J. A unique H2A histone variant occupies the transcriptional start site of active genes. Nat. Struct. Mol. Biol. 2011;19:25–30. doi: 10.1038/nsmb.2161. [DOI] [PubMed] [Google Scholar]
- 36.Loyola A., Bonaldi T., Roche D., Imhof A., Almouzni G. PTMs on H3 variants before chromatin assembly potentiate their final epigenetic state. Mol. Cell. 2006;24:309–316. doi: 10.1016/j.molcel.2006.08.019. [DOI] [PubMed] [Google Scholar]
- 37.Polo S.E., Roche D., Almouzni G. New histone incorporation marks sites of UV repair in human cells. Cell. 2006;127:481–493. doi: 10.1016/j.cell.2006.08.049. [DOI] [PubMed] [Google Scholar]
- 38.Lamprecht B., Walter K., Kreher S., Kumar R., Hummel M., Lenze D., Köchert K., Bouhlel M.A., Richter J., Soler E. Derepression of an endogenous long terminal repeat activates the CSF1R proto-oncogene in human lymphoma. Nat. Med. 2010;16:571–579. doi: 10.1038/nm.2129. [DOI] [PubMed] [Google Scholar]
- 39.Bao Y., Konesky K., Park Y.-J., Rosu S., Dyer P.N., Rangasamy D., Tremethick D.J., Laybourn P.J., Luger K. Nucleosomes containing the histone variant H2A.Bbd organize only 118 base pairs of DNA. EMBO J. 2004;23:3314–3324. doi: 10.1038/sj.emboj.7600316. [DOI] [PMC free article] [PubMed] [Google Scholar]
- 40.Gaspar-Maia A., Qadeer Z.A., Hasson D., Ratnakumar K., Leu N.A., LeRoy G., Liu S., Costanzi C., Valle-Garcia D., Schaniel C., et al. MacroH2A histone variants act as a barrier upon reprogramming towards pluripotency. Nat. Commun. 2013;4:1565–1578. doi: 10.1038/ncomms2582. [DOI] [PMC free article] [PubMed] [Google Scholar]
- 41.Shukla M.S., Syed S.H., Goutte-Gattat D., Richard J.L.C., Montel F., Hamiche A., Travers A., Faivre-Moskalenko C., Bednar J., Hayes J.J., et al. The docking domain of histone H2A is required for H1 binding and RSC-mediated nucleosome remodeling. Nucleic Acids Res. 2011;39:2559–2570. doi: 10.1093/nar/gkq1174. [DOI] [PMC free article] [PubMed] [Google Scholar]
- 42.Pasque V., Radzisheuskaya A., Gillich A., Halley-Stott R.P., Panamarova M., Zernicka-Goetz M., Surani M.A., Silva J.C.R. Histone variant macroH2A marks embryonic differentiation in vivo and acts as an epigenetic barrier to induced pluripotency. J. Cell Sci. 2013;125:6094–6104. doi: 10.1242/jcs.113019. [DOI] [PMC free article] [PubMed] [Google Scholar]
- 43.Govin J., Escoffier E., Rousseaux S., Kuhn L., Ferro M., Thevenon J., Catena R., Davidson I., Garin J., Khochbin S., et al. Pericentric heterochromatin reprogramming by new histone variants during mouse spermiogenesis. J. Cell Biol. 2007;176:283–294. doi: 10.1083/jcb.200604141. [DOI] [PMC free article] [PubMed] [Google Scholar]
- 44.Wolf J., Kapp U., Bohlen H., Kornacker M., Schoch C., Stahl B., Mücke S., Kalle von C., Fonatsch C., Schaefer H.E., et al. Peripheral blood mononuclear cells of a patient with advanced Hodgkin's lymphoma give rise to permanently growing Hodgkin-Reed Sternberg cells. Blood. 1996;87:3418–3428. [PubMed] [Google Scholar]
- 45.Diehl V., Kirchner H.H., Schaadt M., Fonatsch C., Stein H., Gerdes J., Boie C. Hodgkin's disease: establishment and characterization of four in vitro cell lies. J. Cancer Res. Clin. Oncol. 1981;101:111–124. doi: 10.1007/BF00405072. [DOI] [PubMed] [Google Scholar]
- 46.Drexler H.G., Gaedicke G., Lok M.S., Diehl V., Minowada J. Hodgkin's disease derived cell lines HDLM-2 and L-428: comparison of morphology, immunological and isoenzyme profiles. Leuk. Res. 1986;10:487–500. doi: 10.1016/0145-2126(86)90084-6. [DOI] [PubMed] [Google Scholar]
- 47.Kamesaki H., Fukuhara S., Tatsumi E., Uchino H., Yamabe H., Miwa H., Shirakawa S., Hatanaka M., Honjo T. Cytochemical, immunologic, chromosomal, and molecular genetic analysis of a novel cell line derived from Hodgkin's disease. Blood. 1986;68:285–292. [PubMed] [Google Scholar]
- 48.Foell J.L., Volkmer I., Giersberg C., Kornhuber M., Horneff G., Staege M.S. Loss of detectability of Charcot-Leyden crystal protein transcripts in blood cells after treatment with dimethyl sulfoxide. J. Immunol. Methods. 2008;339:99–103. doi: 10.1016/j.jim.2008.08.006. [DOI] [PubMed] [Google Scholar]
- 49.Sporbert A., Domaing P., Leonhardt H., Cardoso M.C. PCNA acts as a stationary loading platform for transiently interacting Okazaki fragment maturation proteins. Nucleic Acids Res. 2005;33:3521–3528. doi: 10.1093/nar/gki665. [DOI] [PMC free article] [PubMed] [Google Scholar]
- 50.Casas-Delucchi C.S., van Bemmel J.G., Haase S., Herce H.D., Nowak D., Meilinger D., Stear J.H., Leonhardt H., Cardoso M.C. Histone hypoacetylation is required to maintain late replication timing of constitutive heterochromatin. Nucleic Acids Res. 2012;40:159–169. doi: 10.1093/nar/gkr723. [DOI] [PMC free article] [PubMed] [Google Scholar]
- 51.Schwanhäusser B., Busse D., Li N., Dittmar G., Schuchhardt J., Wolf J., Chen W., Selbach M. Global quantification of mammalian gene expression control. Nature. 2011;473:337–342. doi: 10.1038/nature10098. [DOI] [PubMed] [Google Scholar]
- 52.Vizcaíno J.A., Côté R.G., Csordas A., Dianes J.A., Fabregat A., Foster J.M., Griss J., Alpi E., Birim M., Contell J., et al. The PRoteomics IDEntifications (PRIDE) database and associated tools: status in 2013. Nucleic Acids Res. 2013;41:D1063–D1069. doi: 10.1093/nar/gks1262. [DOI] [PMC free article] [PubMed] [Google Scholar]
- 53.Cox J., Mann M. 1D and 2D annotation enrichment: a statistical method integrating quantitative proteomics with complementary high-throughput data. BMC Bioinformatics. 2012;13((Suppl. 16)):S12. doi: 10.1186/1471-2105-13-S16-S12. [DOI] [PMC free article] [PubMed] [Google Scholar]
- 54.Benjamini Y., Hochberg Y. Controlling the false discovery rate: a practical and powerful approach to multiple testing. 1995;57:289–300. [Google Scholar]
- 55.Huang D.W., Sherman B., Lempicki R. Bioinformatics enrichment tools: paths toward the comprehensive functional analysis of large gene lists. Nucleic Acids Res. 2009;37:1–13. doi: 10.1093/nar/gkn923. [DOI] [PMC free article] [PubMed] [Google Scholar]
- 56.Huang D.W., Sherman B.T., Lempicki R. Systematic and integrative analysis of large gene lists using DAVID bioinformatics resources. Nat. Protocols. 2008;4:44–57. doi: 10.1038/nprot.2008.211. [DOI] [PubMed] [Google Scholar]
- 57.Neumann I., Foell J.L., Bremer M., Volkmer I., Korholz D., Burdach S., Staege M.S. Retinoic acid enhances sensitivity of neuroblastoma cells for imatinib mesylate. Pediatr. Blood Cancer. 2010;55:464–470. doi: 10.1002/pbc.22603. [DOI] [PubMed] [Google Scholar]
- 58.Cox J., Neuhauser N., Michalski A., Scheltema R.A., Olsen J.V., Mann M. Andromeda: a peptide search engine integrated into the MaxQuant environment. J. Proteome Res. 2011;10:1794–1805. doi: 10.1021/pr101065j. [DOI] [PubMed] [Google Scholar]
- 59.Leduc F., Maquennehan V., Nkoma G.B., Boissonneault G. DNA damage response during chromatin remodeling in elongating spermatids of mice. Biol. Reprod. 2008;78:324–332. doi: 10.1095/biolreprod.107.064162. [DOI] [PubMed] [Google Scholar]
- 60.Yeoh K.-W., Mikhaeel N.G. Role of radiotherapy in modern treatment of Hodgkin's lymphoma. Adv. Hematol. 2011;2011:258797. doi: 10.1155/2011/258797. [DOI] [PMC free article] [PubMed] [Google Scholar]
Associated Data
This section collects any data citations, data availability statements, or supplementary materials included in this article.