

Abstract
The glycan array is a powerful tool for investigating the specificities of glycan-binding proteins. By incubating a glycan-binding protein on a glycan array, the relative binding to hundreds of different oligosaccharides can be quantified in parallel. Based on these data, much information can be obtained about the preference of a glycan-binding protein for specific subcomponents of oligosaccharides, or motifs. In many cases the analysis and interpretation of glycan array data can be time consuming and imprecise if done manually. Recently we developed software, called GlycoSearch, to facilitate the analysis and interpretation of glycan array data based on previously developed methods called Motif Segregation and Outlier Motif Analysis. Here we describe the principles behind the method and the use of this new tool for mining glycan array data. The automated, objective, and precise analysis of glycan array data should enhance the value of the data for a broad range of research applications.
Keywords: Glycobiology, glycan array, glycan motif, lectin
INTRODUCTION
Lectins—proteins that recognize and bind specific carbohydrate structures—are present in every living creature. Each lectin recognizes its own set of glycan patterns. Some lectins bind a single structure that is rarely present in any organism, and others bind an assortment of structures found throughout an organism and in many different types of organisms. Some lectins bind just one or a few saccharides, while other lectins bind many different glycans, with such diversity that the rules governing the lectin binding are hard to determine. The binding preferences of a lectin determine its biological activities and therefore are important to characterize.
A transformative technology for the study of lectin specificities was the glycan array, introduced by several groups in 2002 (Bathe et al., 2010; Blixt et al., 2004; Drickamer and Taylor, 2002; Lee et al., 2010; Lo et al., 2010; Manimala et al., 2006; Yue and Haab, 2009). Glycan arrays consist of multiple synthesized and purified glycans of various structures that are immobilized on a planar surface. A lectin that is incubated on the surface of a glycan array will localize to the glycans with which it interacts (Fig. 1A), and the amount of lectin localized at each glycan can be quantified (Fig. 1B). An example method of quantitation is to use a biotinylated lectin, probe the array with dye-conjugated streptavidin, and scan the array for fluorescence. Such an experiment enables a parallel view of the interactions of a lectin with many different glycans. Prior to the glycan array, researchers had to examine interactions between lectins and glycans one at a time, resulting in very lengthy analyses when considering interactions with many different glycans, and requiring much more volume of each glycan than required by the glycan array. The requirement for more material is significant, given the cost, time, and expertise required to synthesize or purify specific glycans.
Figure 1. Glycan array data.

(A) Glycan arrays consist of purified glycans immobilized in discrete locations on slides. A glycan-binding protein is incubated on the slide to allow binding to any glycans. The amount of bound protein at each glycan spot is determined through measuring fluorescence from a tag on the glycan-binding protein or on a secondary detection reagent. (B) The fluorescence signals from the binding of the lectin vicia villosa (VVL) to 215 different glycans were quantified (left panel) and placed in an Excel file containing the names of the glycans and the corresponding signals (right panel), which served as the input for the GlycoSearch software.
In principle, it should be possible to determine from glycan array data the binding preferences of a lectin. An important characteristic of protein-glycan interactions to consider is that a lectin usually does not interact with an entire oligosaccharide structure but rather with just a subcomponent of it. The subcomponent responsible for the lectin binding is usually one to four monosaccharides organized in a particular arrangement. This group of monosaccharides could be just a small portion of the overall oligosaccharide, found on many different oligosaccharides, and scattered across various proteins and locations. Thus the biology of lectin-glycan interactions depends not so much on entire glycan structures as on the presence and location of the particular “motifs” that make up the binding determinants (Fig. 2).
Figure 2. Motifs contained in a glycan.

(A) A representative glycan, given in symbolic and text notation. (B) Representative motifs in the glycan. Each listed motif is a substructure of the glycan in panel (A).
When we approach glycan array data to determine the binding specificities of lectins, we can use this concept of motifs. If a particular motif is responsible for lectin binding, we should look for motifs that are present on the glycans bound by a lectin but not present on the glycans not bound by the lectin. Or, stated another way, we expect glycans that contain the determinant (the motif that represents the binding specificity of the lectin) to interact with the lectin more strongly than glycans that do not contain the determinant. These expected behaviors form the basis for the analysis of glycan array data presented here.
This article describes a systematic approach for analyzing glycan array data to determine lectin specificities. This approach is made practical by the development of new software, called GlycoSearch. GlycoSearch makes it straightforward for non-experts to perform basic analyses of glycan array data, while it also provides flexibility for experts to delve deeply into datasets and to pursue novel hypotheses. A useful feature of GlycoSearch is its ability to handle glycan array data from any platform; no requirements are prescribed for the content or characteristics of the glycan array. We begin with the steps for basic analysis and follow with more in-depth analyses as may be required for lectins with complex specificities. We provide an example of the use of the method for the analyses of glycan array data from the lectin bauhinia purpurea.
BASIC PROTOCOL 1: Analyzing glycan array data
The goal of the analysis is to determine the binding determinant of a glycan binding protein. Specifically, we want to know the minimal glycan motif, or set of motifs, that is necessary and sufficient for the binding of a lectin. The steps are: the acquisition of data, the processing of the data using GlycoSearch, the interpretation of the initial output, and the refinement of the analysis and interpretation. The first protocol describes the initial analysis and interpretation, and the alternate protocols describe the approaches for refinement.
Materials
The use of this method requires the GlycoSearch software, glycan array data, and Microsoft Excel or a similar analysis program.
GlycoSearch software
GlycoSearch is freely available from the authors. The software is written in Java and runs on various computer platforms, including Windows, Macintosh, and Linux. Verify that the latest version of Java is installed on your computer (Java is freely available on the web by download). Currently, GlycoSearch must be resident on the local disk of the computer.
Glycan array data
Several versions of glycan arrays have been produced, each with its own set of glycans. GlycoSearch will work with any glycan array data, provided the sequences of the glycans are available. Many glycan array datasets are freely available for download from the Consortium for Functional Glycomics (CFG, www.functionalglycomics.org). If a researcher desires to generate new glycan array data, the CFG provides a service to run glycan microarrays for lectins submitted by an investigator. The downloaded glycan array data, saved either as a tab-delimited text file or as a Microsoft Excel workbook, can be used directly as the input for the GlycoSearch software. The glycan names should be in a condensed IUPAC notation as defined by the CFG and in the Essentials of Glycobiology textbook (Varki et al., 2009). Some deviations from IUPAC notation can be properly interpreted, and the software is flexible enough to catch and automatically correct common errors in glycan expressions.
The output data from a glycan array experiment consists of a list of the glycans on the array followed by a numerical quantification of the fluorescence intensity level detected at each glycan (Fig. 1B). Other parameters could be associated with each glycan such as the level of background signal around the glycan spot, the standard deviation between pixels within the spot, or the standard deviation between replicate spots, which may be useful for quality control purposes.
Protocol steps
-
Begin the analysis by starting GlycoSearch and indicating the file to be analyzed.
As described above, the input file should be an Excel workbook containing at least a column of the glycan names followed by a column of the average fluorescence intensity signal associated with each glycan
The input file may optionally include a third column of the standard deviation associated with each glycan’s fluorescence intensity. The CFG and other versions of glycan arrays commonly incorporate multiple spots of each glycan on the array, or each glycan may be sampled several times in a local neighborhood of each spot, for enhanced quality control purpose. By having multiple measurements, the uniformity of lectin incubation across the array can be quantified, for instance by having 3 spots for each glycan on the array, placed in non-adjacent locations on the array. The multiple measurements of each glycan on the array are typically combined to output the mean and standard deviation of the fluorescence intensity measurements. When the standard deviation information is available, the GlycoSearch program can use this information to identify outliers, indicated by an unusually large standard deviation for a particular glycan, and correspondingly adjust its internal variation thresholds.
Specific column headers are not required, since the program can recognize the glycan information and data types of each column. The input file can have the rows of information in any order; GlycoSearch will sort the rows in decreasing fluorescence intensity order.
Once an input file is selected, GlycoSearch will analyze the input file and produce the two output files, described in step 3 below, containing a summary of the motifs identified by the program and a detailed report of its findings.
-
Examine the two output files generated by the program. The first is an Excel workbook that contains the results of the analysis and is named the same as the input filename, appended with ‘_lectin_out’. The second is a text file that contains a description of the binding motifs learned by the analysis and is named the same as the input filename, appended with ‘_learned_motifs’.
For example, an input file named ‘ConA’ would produce output files named ‘ConA_lectin_out.xlsx’ and ‘ConA_learned_motifs.txt’.
Locate the primary motifs recognized by the lectin, sorted by decreasing motif score. This information is in the lectin_out workbook, in a tab called ‘Motif Scores’.
Table 1 lists the motifs with score > 2.0 for the lectin BPL, using data from the CFG glycan array version 2.0.
Interpret the motif scores. The motif score is the absolute value of the logarithm of the p value from the Mann-Whitney test comparing the intensities of glycans containing the motif to those not containing the motif (Fig. 3, and see Background Information). The highest motif scores are most significant. A motif score of 1.3 indicates p = 0.05 (−log10(0.05) = 1.3), which can be a useful threshold, suggesting a statistically significant binding observed in glycans with the motif than in ones without the same motif.
-
Interpret the motifs. The motif with the highest score has the highest accuracy for defining the binding determinant of the lectin. (See the Critical Parameters section for more information on interpreting the motif score.) Other motifs with lower but significant scores may simply be dependent subsets of the primary motif, or they may be independent motifs. By “subset,” we mean that a subset of all the glycans containing the primary motif also contains the dependent motif. For example, of all the glycans containing the ‘terminal galactose any linkage’ motif, a subset contains the ‘terminal β-linked galactose’ motif. If the true determinant of the lectin is the subset, the motif representing the subset will have the higher score, and vice versa. Figure 2 provides examples of motifs within a glycan.
For BPL, the top-scoring motif (Table 1) is “Terminal Galactose AnyLinkage,” which is consistent with the known specificity of BPL. (The AnyLinkage modifier indicates that the motif includes both beta-linked and alpha-linked terminal galactose.) The next two highest motifs also are terminal galactose but specific to a beta linkage. The next motifs have weaker but still significant scores and suggest that BPL has broader specificity than just the top motif.
-
Determine whether the top motif completely describes the binding determinant of the lectin. This step is necessary to determine if modifications to the motif definitions are needed to more accurately describe the lectin binding. Locate the list of glycans on the array, sorted by decreasing fluorescence (found in the ‘_lectin_out’ file). For each glycan, a list is given of the motifs contained in the glycan. (The motif IDs are used (as in Table 1), for example ID 88 = ‘Fucose alpha1,6’.) Determine if only the glycans with high fluorescence contain the top-scoring motif. If some glycans with high fluorescence do not contain the top-scoring motif, or if glycans containing the top-scoring motif have low fluorescence, then the top-scoring motif does not perfectly describe the determinant.
This analysis requires differentiation between glycans with high and low fluorescence. GlycoSearch calculates thresholds to make that determination, displayed in a plot of the fluorescence intensities of each glycan. The thresholds are calculated as previously described (Maupin et al., 2011).
Normally the pre-defined set will contain something close to the actual determinant, given the broad range of simple and complex sugar structures represented by the over 200 motifs. However, some lectins have complex binding rules that are hard to predict.
Plan the next steps. If the top motif does not fully describe the observed binding of the lectin to the glycans, GlycoSearch provides two approaches for refining the analysis: combination motifs (Alternate Protocol 1) and outlier analysis (Alternate Protocol 2).
Table 1.
Individual motif scores for BPL.
| Motif ID | Motif Name | Score |
|---|---|---|
| 19 | Terminal Galactose AnyLinkage | 5.99 |
| 5 | Terminal Galb | 5.31 |
| 2 | Terminal Galb1,3 | 5.27 |
| 32 | GalNAca 6′ Substituted | 3.08 |
| 113 | Core 2 O-glycan | 2.90 |
| 188 | Gala1-3Gal Not Blood Group B | 2.85 |
| 127 | O Glycan (GalNAca-Sp) | 2.81 |
| 164 | Linear B | 2.76 |
| 30 | GalNAca 3′ Substituted | 2.72 |
| 173 | Lewis x | 2.50 |
| 169 | Lewis a | 2.46 |
| 139 | Type 3 Chain (Galb1-3GalNAca) Poly LacNAc OR Neo Poly LacNAc |
2.45 |
| 148 | Terminal | 2.40 |
| 112 | Terminal Core 1 O-glycan | 2.18 |
| 23 | Terminal GalNAcb | 2.06 |
Figure 3. Motif segregation.
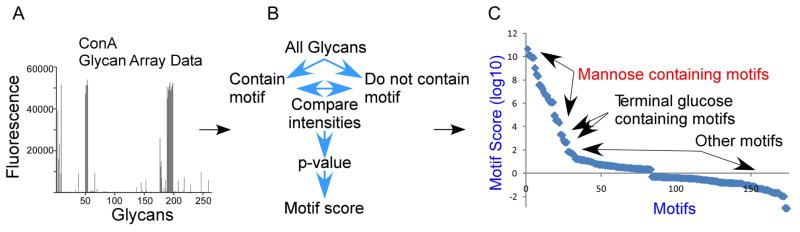
Quantified glycan array data (A) are processed using the GlycoSearch software and the motif segregation algorithm to produce motif scores for each experiment (B). The analysis of a glycan array experiment of the lectin ConA is given as an example, in which the top scoring motifs contain mannose, followed by motifs with terminal glucose (C).
ALTERNATE PROTOCOL 1: Refining the motif interpretation through combined and excluded motifs
The purpose of this protocol is to refine the definition of a motif so that it more accurately describes the observed binding of a lectin. The goal is to define a motif that is present in all the glycans that show high lectin binding and not present in the glycans that show low lectin binding. An approach to refining the motif definition is to test combinations of the existing motifs. Many new motifs can be created simply from binary combinations of the existing motifs. For example, the combination motif ‘Terminal galactose OR fucose alpha1,2’ encompasses all glycans that contain either of the motifs joined by the OR operator, and the combination motif ‘Lactosamine AND NOT sialic acid alpha2,3’ excludes glycans containing the motif after the AND NOT operator. The AND NOT operator could be useful if certain motifs inhibit lectin binding.
GlycoSearch combines, using the OR operator, the top-scoring motif with each other individual motifs and calculates a new motif score for each combination. The combination that most improves the score is recorded. The program then tests the exclusion of each individual motif from the new combined motif using the AND NOT operator. Any exclusions that improve the score are incorporated into the new motif definition. The process continues until no combination or exclusion further improves the score. The user can examine the list of combined and excluded motifs to gain insights into the lectin specificity. A new motif definition can be derived from this information and tested.
Protocol steps
Locate the combination motif results. These results are automatically calculated and presented in a separate tab called ‘Learned Motifs’. The list gives the result of each iteration of testing combination and exclusion motifs. The score of each combination is given, followed by the gain over the previous best combination, the total number of glycans included in the new combination, and the motif used in the combination.
-
If exclusions using the AND NOT operator produce an improvement in the motif score, the excluded motifs are listed as well.
The details of each iteration step and more information about the motifs added or excluded at each step are provided in the _learned_motifs text file. The example application below provides more information on how to interpret and use this information.
-
Interpret the combination motifs. Each addition to the motif represents an independent contributor of lectin binding. Dependent motifs would not be included in this list, since the inclusion of dependent motifs would not add any glycans to the combined motif. Therefore, the combination motifs that improve the score provide insights into the breadth of binding of the lectin. It may be possible to identify commonalities between the individual motifs included in the top combination motif, leading to a more general understanding of the lectin specificity.
In the first iteration of combinations for BPL (Table 2), the combination of motif 19 with motif 23 (Terminal GalNAcβ) and exclusion of several motifs resulted in 68 glycans with the combined motif. The combined motif had a score of 10.39, a major gain over the starting score of 5.99. This result indicates that the binding specificity of BPL primarily encompasses both terminal, beta-linked Gal and GalNAc, but with exclusions.
The next two iterations show that BPL could also bind both alpha-linked GalNAc and GlcNAc under certain circumstances. The following iterations shown in Table 2 reinforce the above interpretations and provide information on specific circumstances in which BPL binds. The overall picture emerges that BPL binding is broader than simply beta-linked, terminal Gal, encompassing beta-linked GalNAc and alpha-linked GalNAc and GlcNAc in certain configurations, although with weaker preference.
-
Interpret the exclusions. The exclusions point to modifications of the primary motif that inhibit lectin binding. A new, general motif definition may be derived that accounts for the exclusions.
The exclusions for BPL (Table 2) are mainly sulfation and sialylation, which are known to prevent BPL binding.
The findings from this analysis can be used in the outlier analysis described below.
Table 2. Combination motif scores.
Each iteration shows the motif that was added and the exclusions applied to that glycan. The Exclusions column gives the ID of the excluded motifs and the number of excluded glycans in square brackets. The names of the excluded motifs are given at the bottom of the table.
| Itr | Score | Gain | Glycans | ID | Motif | Exclusions |
|---|---|---|---|---|---|---|
| 0 | 5.99 | - | 109 | 19 | Terminal Galactose AnyLinkage | 180 [21]; 85 [28]; 40 OR 13 [1]; 185 [4] |
| 1 | 10.39 | 4.40 | 68 | 23 | Terminal GalNAcb | 168 OR 94 [8] |
| 2 | 11.03 | 0.65 | 61 | 107 | Tn Antigen | |
| 3 | 11.21 | 0.18 | 62 | 59 | Terminal GlcNAca1-6 | |
| 4 | 11.37 | 0.16 | 63 | 25 | GalNAcb 4′ Substituted | |
| 5 | 11.49 | 0.11 | 64 | 121 | Core 6 O-glycan | |
| 6 | 11.55 | 0.07 | 65 | 189 | Forssman Antigen (GalNAca1-3GalNAcb) Not Blood Group A | |
| 7 | 11.61 | 0.06 | 66 | 188 | Gala1-3Gal Not Blood Group B | |
| 8 | 11.67 | 0.06 | 67 | 161 | Blood Group H Type 3 | |
| 9 | 11.72 | 0.05 | 68 | 207 | MDPLys | |
| 10 | 11.76 | 0.04 | 69 | 181 | Phosphorylated Glycans | |
| 11 | 11.79 | 0.03 | 70 | 155 | Blood Group B Type 2 | |
| 12 | 11.82 | 0.03 | 70 | 31 | GalNAca 4′ Substituted | |
| 13 | 11.87 | 0.05 | 71 | 207 | MDPLys | 51 [2] |
| 14 | 11.90 | 0.04 | 72 | 166 | Blood Group I GlcNAcb1-3(GlcNAcb1-6)Galb | |
| 15 | 11.92 | 0.01 | 73 | 91 | Rhamnose Anywhere | |
| 16 | 11.93 | 0.01 | 74 | 186 | Internal Gala1-4Galb | 94 OR 95 [1] |
| ID | Excluded Motifs |
|---|---|
| 180 | Sulfated Glycans |
| 85 | Fuca1-2 |
| 40 | Glcb 6′ Substituted |
| 13 | Terminal Gala1-6 |
| 185 | Terminal Gala1-4Galb |
| 168 | Blood Group Sd(a), CAD (GalnAcb1-4(Siaa2-3)Gal) |
| 94 | Neu5Aca2-3 Anywhere |
| 51 | Terminal GlcNAcb1-4 |
| 94 | Neu5Aca2-3 Anywhere |
| 95 | Terminal Neu5Aca2-3 |
ALTERNATE PROTOCOL 2: Refining the motif interpretation through outlier analysis
Outlier analysis is another way to identify modifications to the motifs that better describe the lectin specificity.
Protocol steps
The first step is to identify the outlier and non-outlier glycans. Along with the list of glycans, GlycoSearch provides the fluorescence intensity (column header “RFU,” for Relative Fluorescence Units), indicating the amount of lectin binding to the glycan, and the summed motif score. The summed motif score is the sum of the scores of the motifs contained in the glycan, for motifs with a score > 3. If no motifs in a glycan have a score > 3, the summed motif score will be zero. A motif score of 3 corresponds to p value 0.001, which is significant, but not stongly, in multiple hypothesis testing of about 200 pre-defined motifs.
-
Outlier glycans can be identified by comparing the RFUs to the summed motif scores. Positive outliers have high RFU but low summed motif score, and negative outliers have high summed motif score but low RFU.
An examination of the BPL outlier plot (Fig. 4A) reveals several positive and negative outliers.
Group the outliers and non-outliers. Copy the positive outliers, negative outliers, and non-outliers into separate lists, along with all the information for each glycan (including the list of motifs contained in each glycan). Non-outliers can be placed into two categories: glycans that have high RFU and high summed motif score, and glycans that have low RFU and low summed motif score.
Compare the outliers to the non-outliers. It is useful to handle positive and negative outliers separately.
-
Compare the positive outliers to the non-outliers with low RFUs and low summed motif scores. Neither of these groups contains the top motifs, but one group has high RFUs (the outliers) and the other has low (the non-outliers). An initial approach is to examine the list of motifs contained in the glycans in each group to identify differences. In addition, the user can scan the glycan sequences and glycan names in the two groups to identify differences. Record the differences between the groups that could potentially explain the differential lectin binding. These differences can be incorporated into new motif definitions.
Positive outliers suggest that the lectin binds other motifs than represented by the top-scoring motif. Examine the motifs in the learned motifs analysis (described above) for clues about additional, independent motifs recognized by the lectin.
For BPL, the positive outliers were mostly terminal GalNAcα or terminal/penultimate Galα sequences for which we previously did not have specific motifs (Fig. 4A). These motifs and many others are now included in GlycoSearch.
-
Compare the negative outliers to the non-outliers with high RFUs and high motif scores. Both of these groups contain the top motifs, but one group has low RFUs (the outliers) and the other has high (the non-outliers). As with the positive outliers, compare the groups using the lists of motifs contained in the glycans and by visual examination. Differences that potentially account for the differential binding can be tested in new motif definitions.
Negative outliers suggest that the lectin does not bind the motif in certain presentations, such as if substituted in a certain way. Search the exclusions in the learned motifs analysis for clues to inhibiting structures.
For BPL, the negative outliers were mostly sulfated glycans (Fig. 4A). Our definition of “Terminal Galβ” encompassed sulfated Galβ, so sulfated glycans had a high summed-motif score even though they did not bind BPL.
Figure 4. Outlier-motif analysis of the galactose binder BPL.
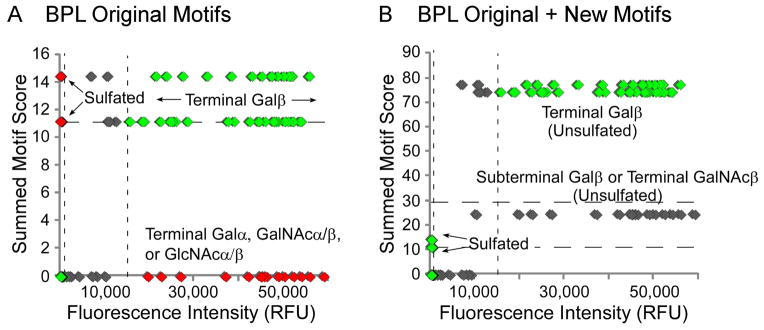
The summed motif scores for each glycan, after analysis with either the original or updated motifs, are plotted with respect to fluorescence intensity after detection with BPL. (A) BPL using the original motifs. (B) BPL using the original plus new motifs (indicated in parenthesis below original motifs). The dashed lines represent thresholds for defining outliers, based on the distributions from all the glycans. Green symbols indicate glycans in expected regions, red symbols indicate outliers, and grey symbols indicate bound glycans that may not represent the primary specificity of the lectin.
ALTERNATE PROTOCOL 3: Testing new motifs
The above analyses may suggest additional motifs, not represented in the pre-defined list, which might be important for the binding of the lectin. In that case, the user should examine whether the newly defined motifs further improve the motif scores. The software enables that analysis through the inclusion of user-defined motifs.
Protocol steps
-
Define the new motifs in a new spreadsheet. The program can accept any combination of standard IUPAC-like motif expressions (component parts of oligosaccharides, Fig. 2) with logical operators such as AND, OR, and NOT. The software can additionally accept any combination of the pre-defined motif terms. GlycoSearch also supports the use of certain wildcards.
For BPL, both the combination motif and the outlier analyses indicated that sulfation should be excluded and that GalNAcα1,3Gal without fucose on the Gal should be added.
The “?” character can be used as a wildcard to indicate any type of attachment linkage, either α linkage or β linkage, between a monosaccharide and another residue; or be used to express any valid carbon position, e.g. “β1-?”, “β?-4” or “??-?”, etc. Other types of wildcards provide ways to specify alternate or excluded residues (for example, Glc or GlcNAc, but not Gal). Yet other wildcards allow the user to specify whether a specific carbon position of a monosaccharide is to be free, occupied by a linkage, or unspecified. The user also may specify search criteria using a sequence of logical operations such as AND, OR and NOT on any combination of glycan expressions. Overall, the GlycoSearch program is designed to be flexible and enable the user to input any type of search pattern, using wildcards and other methods for precisely specifying the search criteria, The GlycoSearch program always checks and verifies the user entry, and it will alert the user of any conflicting search constraints.
A supplementary file with detailed guidelines for the motif naming conventions is available separately from the authors.
-
The list of new motifs should be placed in a new Excel file with the lectin name followed by “_user_motifs.xlsx.” For example, if the file containing the lectin data were named “BPL.xlsx,” the user motifs file should be named “BPL_user_motifs.xlsx,” and the two files should be in the same directory. During the analysis, the program will parse and interpret the user-defined motifs, and add the user-defined motifs to the analysis, in conjunction with the existing motifs.
For BPL, we defined two new motifs: Terminal GalNAca1-3Gal Inclusive No Subterminal Fucose (motif 217), and Terminal GlcNAcb1-6Gal Inclusive (motif 218). We also defined ‘Not sulfated’ versions of all the terminal Gal and GalNAc motifs.
-
Run GlycoSearch as normal, and the new motifs will be incorporated into the analysis and included in the output files.
The GlycoSearch program can be used in either interactive or batch modes. In interactive mode, the program prompts and solicits input from the user, and it provides progress update and feedback to the user. In batch mode operation, the program can quietly perform a large search with minimal user interaction by guiding the program with a number of switches and options that are specified on the command line at run time. The list of switches and options is included with the supplementary file described in section 3b above.
-
Interpret the results as described above in the Basic Protocol and the first two Alternate Protocols. If further modifications to the motifs are required, they can be tested in additional rounds of new motif definition and analysis.
Running GlycoSearch again with the new motifs for BPL showed that the ‘Not sulfated terminal Gal’ motifs were much improved. The success of new motifs in describing binding specificity can be visually checked by creating an outlier plot after the reanalysis (Fig. 4B). Fewer outlier glycans were present than before (Fig. 4A), indicating that the new motifs have properly accounted for the previous outliers.
COMMENTARY
Background Information
Here we provide background on the methods presented here and information on some additional approaches for analyzing glycan array data. We introduced the motif segregation algorithm earlier. Motifs, or component substructures of oligosaccharides (Fig. 2), are predefined by the software. Examples include the blood group A antigen, terminal β-linked galactose, and internal lactosamine. The original analyses (performed using custom Excel spreadsheets) defined 63 motifs, and the current version of GlycoSearch defines over 200 motifs. For every motif, the software determines whether it is present or absent in each glycan on an array, and a matrix of the glycans and motifs (in the rows and columns of the matrix, respectively) is populated with 1s and 0s indicating presence or absence, respectively, of each motif in each glycan. Glycan array data is provided to the program indicating the fluorescence signal intensity at each glycan (corresponding to the amount of binding of a lectin) (Fig. 3A). For each motif, the program statistically compares the signals of the glycans that contain the motif to those that do not contain the motif (Fig. 3B). Using the Mann-Whitney test, a p value is generated for each motif indicating the likelihood that the observed pattern of signals could be generated by chance. For ease of comparison between motifs, the software takes the logarithm (base 10) of the p value and adds a plus or minus sign, with positive indicating that motif-containing glycans have a higher average intensity, and negative indicating the opposite. This signed, logged p value is referred to as the motif score. We showed the approach to be accurate for defining the primary specificities of lectins and glycan-binding antibodies (Maupin et al., 2011; Porter et al., 2010) (Fig. 3C). Developments that were subsequently added to this method include outlier analysis and combination motif analysis, both described above.
Other methods for analyzing glycan arrays have since appeared, including a method that uses comparisons of lectin binding at varying concentrations (Cholleti et al., 2012) and another that uses partial least squares regression to describe motif associations with lectin binding (Xuan et al., 2011). Generalized approaches for defining substructures of glycans according to all combinations of tri-saccharides present in any structure may also be useful for comprehensively identifying motifs (Hizukuri et al., 2005).
Critical Parameters
To properly interpret and use the results from GlycoSearch, researchers must understand what the motif score indicates and what factors affect the motif score. The motif score is a measure of the accuracy with which a motif describes the observed binding of a lectin. If a lectin always shows higher binding to glycans that contain the motif than to those that do not contain the motif, the score is high, but if exceptions occur (either binding is low when the motif is present or binding is high with the motif missing), the score is lower. For example, using glycan array data from the lectin concanavalin A (ConA), motifs containing mannose have high motif scores, and motifs with terminal glucose (a secondary specificity of ConA) have slightly lower scores (Fig. 3C). The motif score also reflects statistical significance along with accuracy, that is, a motif that appears in only 10 of 500 glycans will have a lower motif score than one that appears in 20 of 500 glycans, even with perfect accuracy (all glycans with the motif have higher binding than all glycans without the motif). As such, the motif score does not provide a quantitative measurement of the affinity of the interaction, only the statistical significance that a particular motif is associated with the observed pattern of measurement data.
The motif score can be affected by the complexity of the lectin binding relative to the diversity of the glycans that are present on the arrays. Lectins with more complex specificities would be harder to describe and thus would not be accurately described by the pre-defined motifs. Complex lectins also could more frequently require other factors for optimal binding, such as multivalent presentations of the glycans (Oyelaran et al., 2009; Zhang et al., 2010), particular peptide backbones, or other protein cofactors. The relevant complex motifs might not be present on the arrays, as only a fraction of the glycome is present on any array (Cummings, 2009). These limitations could be addressed in future developments, such as new glycan array data with expanded glycan repertoires or varying densities (Uchimura et al., 2005; Zhang et al., 2010) and the continued definition of motifs that account for complex specificities (Maupin et al., 2011).
Researchers also should be aware of the effects of concentration on lectin specificity. Incubations of lectins at high concentrations may exhibit non-specific binding to certain glycans. On the other hand, incubations at low concentrations may fail to show real interactions. Many of the lectin analyses run by the CFG were performed at several different lectin concentrations. GlycoSearch analysis could be performed on the data from each concentration to determine how motif specificity changes with concentration. The motifs that score well only at the highest concentrations could represent non-specific interactions, but the motifs that maintain a significant score at lower concentrations likely represent specific interactions.
Anticipated Results
In many cases the predefined set of motifs will include a motif that nearly perfectly describes the determinant of a lectin. An example is the lectin ConA, which nearly exclusively binds mannose and terminal glucose—simple motifs that are included in the pre-defined set (Fig. 3C). Therefore, further motif refinements are not necessary for ConA. In other cases the program will return the primary specificity of the lectin but with need for refinement. We anticipate that in nearly all cases the program will return some indication of the specificity of the lectin, considering the breadth of pre-defined motifs. The user determines whether refinement is needed by determining whether all glycans with high fluorescence containing at least one of the significant (score > 3.0) motifs and whether all glycans with low fluorescence do not contain any significant motifs (using the outlier analysis described in Alternate Protocol 2). Based on comparisons of outlier to non-outlier glycans, the user defines new motifs, re-runs the program, and re-interprets the results.
If using data from a custom glycan array, which contains glycans not found on the CFG array or unusual glycans derived from natural sources, for example, it may be necessary to define motifs that are completely different from any of the pre-defined motifs. Glycosearch can accommodate new types of arrays and motifs, and the new motifs can be included in all subsequent analyses.
Time Considerations
The processing of the data is rapid using GlycoSearch; the bulk of the time is spent examining and interpreting the output. The time required for the latter steps depends on the complexity of the lectin and the experience of the user. For a lectin with a simple binding preference that is accurately described by one of the pre-defined motifs, the initial output file would be immediately useful, and no further analysis would be required. Other lectins could require many hours of analysis and reanalysis to achieve an understanding of the binding preferences, and in some cases new experiments must be designed to address particular questions. For example, researchers have designed custom glycan arrays to examine questions about the effects of branching, extension, and core structures on the binding of influenza virus to sialic acids (Nycholat et al., 2012). Such custom arrays may be more effective for revealing lectin specificities than general glycan arrays.
Acknowledgments
The authors gratefully acknowledge funding of this work by a bridging grant from the Consortium for Functional Glycomics; by the National Cancer Institute (1U01CA168896, Alliance of Glycobiologists for Detection of Cancer); and by the Van Andel Research Institute.
Footnotes
INTERNET RESOURCES
Consortium for Functional Glycomics (CFG): www.functionalglycomics.org. This site provides access to the resources and information assembled by the CFG. Data from thousands of glycan array experiments and other types of experiments are available, along with fundamental biological information, links to additional resources, and descriptions of reagents that are available through the consortium.
LITERATURE CITED
- Bathe OF, Shaykhutdinov R, Kopciuk K, Weljie AM, McKay A, Sutherland FR, Dixon E, Dunse N, Sotiropoulos D, Vogel HJ. Feasibility of Identifying Pancreatic Cancer based on Serum Metabolomics. Cancer Epidemiol Biomarkers Prev. 2010;20:140–147. doi: 10.1158/1055-9965.EPI-10-0712. [DOI] [PubMed] [Google Scholar]
- Blixt O, Head S, Mondala T, Scanlan C, Huflejt ME, Alvarez R, Bryan MC, Fazio F, Calarese D, Stevens J, Razi N, Stevens DJ, Skehel JJ, van Die I, Burton DR, Wilson IA, Cummings R, Bovin N, Wong CH, Paulson JC. Printed covalent glycan array for ligand profiling of diverse glycan binding proteins. Proceedings of the National Academy of Sciences of the United States of America. 2004;101:17033–17038. doi: 10.1073/pnas.0407902101. [DOI] [PMC free article] [PubMed] [Google Scholar]
- Cholleti SR, Agravat S, Morris T, Saltz JH, Song X, Cummings RD, Smith DF. Automated motif discovery from glycan array data. Omics: a journal of integrative biology. 2012;16:497–512. doi: 10.1089/omi.2012.0013. [DOI] [PMC free article] [PubMed] [Google Scholar]
- Cummings RD. The repertoire of glycan determinants in the human glycome. Molecular bioSystems. 2009;5:1087–1104. doi: 10.1039/b907931a. [DOI] [PubMed] [Google Scholar]
- Drickamer K, Taylor ME. Glycan arrays for functional glycomics. Genome biology. 2002;3:REVIEWS1034. doi: 10.1186/gb-2002-3-12-reviews1034. [DOI] [PMC free article] [PubMed] [Google Scholar]
- Hizukuri Y, Yamanishi Y, Nakamura O, Yagi F, Goto S, Kanehisa M. Extraction of leukemia specific glycan motifs in humans by computational glycomics. Carbohydr Res. 2005;340:2270–2278. doi: 10.1016/j.carres.2005.07.012. [DOI] [PubMed] [Google Scholar]
- Lee SM, Chan RW, Gardy JL, Lo CK, Sihoe AD, Kang SS, Cheung TK, Guan YI, Chan MC, Hancock RE, Peiris MJ. Systems-level comparison of host responses induced by pandemic and seasonal influenza A H1N1 viruses in primary human type I-like alveolar epithelial cells in vitro. Respir Res. 2010;11:147. doi: 10.1186/1465-9921-11-147. [DOI] [PMC free article] [PubMed] [Google Scholar]
- Lo JF, Yu CC, Chiou SH, Huang CY, Jan CI, Lin SC, Liu CJ, Hu WY, Yu YH. The Epithelial-Mesenchymal Transition Mediator S100A4 Maintains Cancer Initiating Cells in Head and Neck Cancers. Cancer research. 2010;71:1912–1923. doi: 10.1158/0008-5472.CAN-10-2350. [DOI] [PubMed] [Google Scholar]
- Manimala JC, Roach TA, Li Z, Gildersleeve JC. High-throughput carbohydrate microarray analysis of 24 lectins. Angewandte Chemie (International ed. 2006;45:3607–3610. doi: 10.1002/anie.200600591. [DOI] [PubMed] [Google Scholar]
- Maupin KA, Liden D, Haab BB. The fine specificity of mannose-binding and galactose-binding lectins revealed using outlier-motif analysis of glycan array data. Glycobiology. 2011;22:160–169. doi: 10.1093/glycob/cwr128. [DOI] [PMC free article] [PubMed] [Google Scholar]
- Nycholat CM, McBride R, Ekiert DC, Xu R, Rangarajan J, Peng W, Razi N, Gilbert M, Wakarchuk W, Wilson IA, Paulson JC. Recognition of Sialylated Poly-N-acetyllactosamine Chains on N- and O-Linked Glycans by Human and Avian Influenza A Virus Hemagglutinins. Angewandte Chemie (International ed. 2012;51:4860–4863. doi: 10.1002/anie.201200596. [DOI] [PMC free article] [PubMed] [Google Scholar]
- Oyelaran O, Li Q, Farnsworth DW, Gildersleeve JC. Microarrays with Varying Carbohydrate Density Reveal Distinct Subpopulations of Serum Antibodies. Journal of proteome research. 2009 doi: 10.1021/pr9002245. [DOI] [PMC free article] [PubMed] [Google Scholar]
- Porter A, Yue T, Heeringa L, Day S, Suh E, Haab BB. A motif-based analysis of glycan array data to determine the specificities of glycan-binding proteins. Glycobiology. 2010;20:369–380. doi: 10.1093/glycob/cwp187. [DOI] [PMC free article] [PubMed] [Google Scholar]
- Uchimura K, Gauguet JM, Singer MS, Tsay D, Kannagi R, Muramatsu T, von Andrian UH, Rosen SD. A major class of L-selectin ligands is eliminated in mice deficient in two sulfotransferases expressed in high endothelial venules. Nature immunology. 2005;6:1105–1113. doi: 10.1038/ni1258. [DOI] [PubMed] [Google Scholar]
- Varki A, Cummings R, Esko J, Freeze H, Stanley P, Bertozzi CR, Hart G, Etzler ME. Essentials of Glycobiology. 2. Cold Spring Harbor Laboratory Press; Cold Spring Harbor, NY: 2009. [PubMed] [Google Scholar]
- Xuan P, Zhang Y, Tzeng TR, Wan XF, Luo F. A quantitative structure-activity relationship (QSAR) study on glycan array data to determine the specificities of glycan-binding proteins. Glycobiology. 2011;22:552–560. doi: 10.1093/glycob/cwr163. [DOI] [PMC free article] [PubMed] [Google Scholar]
- Yue T, Haab BB. Microarrays in glycoproteomics research. Clin Lab Med. 2009;29:15–29. doi: 10.1016/j.cll.2009.01.001. [DOI] [PMC free article] [PubMed] [Google Scholar]
- Zhang Y, Li Q, Rodriguez LG, Gildersleeve JC. An array-based method to identify multivalent inhibitors. Journal of the American Chemical Society. 2010;132:9653–9662. doi: 10.1021/ja100608w. [DOI] [PMC free article] [PubMed] [Google Scholar]