

Abstract
Background
The prognostic value of Doppler myocardial imaging, including myocardial velocity imaging, strain, and strain rate imaging, in patients with primary (AL) amyloidosis is uncertain. The aim of this longitudinal study was to identify independent predictors of survival, comparing clinical data, hematologic and cardiac biomarkers, and standard echocardiographic and Doppler myocardial imaging measures in a cohort of patients with AL amyloidosis.
Methods
A total of 249 consecutive patients with AL amyloidosis were prospectively enrolled. The primary end point was all-cause mortality, and during a median follow-up period of 18 months, 75 patients (30%) died. Clinical and electrocardiographic data, biomarkers (brain natriuretic peptide and cardiac troponin T) and standard echocardiographic and longitudinal systolic and diastolic Doppler myocardial imaging measurements for 16 left ventricular segments were tested as potential independent predictors of survival.
Results
Age (hazard ratio [HR], 1.03; P = .03), New York Heart Association class III or IV (HR, 2.47; P = .01), the presence of pleural effusion (HR, 1.79; P = .08), brain natriuretic peptide level (HR, 1.29; P = .01), ejection time (HR, 0.99; P = .13), and peak longitudinal systolic strain of the basal anteroseptal segment (HR, 1.05; P = .02) were independent predictors in the final model.
Conclusions
Multivariate survival analysis identified independent predictors of clinical outcome in patients with AL amyloidosis: New York Heart Association class III or IV, presence of pleural effusion, brain natriuretic peptide level > 493 pg/mL, ejection time < 273 ms, and peak longitudinal systolic basal anteroseptal strain less negative than or equal to −7.5% defined a high-risk group of patients.
Keywords: AL amyloidosis, Restrictive cardiomyopathy, Echocardiography, Doppler myocardial imaging, Strain rate imaging
Primary (AL) amyloidosis is characterized by the extracellular deposition of pathologic insoluble fibrillar protein in organs and tissues. Congestive heart failure is seen in approximately 25% of patients with amyloidosis, and its development is associated with an average survival of <4 months.1 There is strong evidence that cardiovascular biomarkers and two-dimensional (2D) and Doppler echocardiographic findings are meaningful predictors of survival in AL amyloidosis.2 The prognostic value of hematologic biomarkers has also been demonstrated.3 Although strain rate imaging and strain imaging have been shown to be very sensitive for the detection of early cardiac dysfunction in patients with systemic amyloid,4,5 their role as predictors of survival is uncertain.
The purposes of the present observational study were twofold: (1) to identify independent predictors of all-cause mortality, considering demographic, clinical, hematologic, and cardiovascular data, including echocardiography with Doppler myocardial imaging (DMI), through a multivariate survival analysis (death from any cause was the outcome), and (2) to establish cut points for those predictors that would be useful in clinical evaluation of patients with AL amyloidosis.
METHODS
Study Population
This study was approved by the institutional review board of the Mayo Clinic. Subjects with AL amyloidosis were prospectively selected from patients undergoing evaluation in the Division of Hematology at the Mayo Clinic (Rochester, MN) from January 1, 2004, through October 31, 2005, and referred for echocardiography. A cohort of 279 consecutive patients with AL amyloidosis who underwent complete echocardiographic and Doppler exams constituted the initial study population. All patients were evaluated by a hematologist and, when appropriate, by other specialists.
The diagnosis of immunoglobulin light chain amyloidosis was made by biopsy of subcutaneous fat or an involved organ that demonstrated typical Congo red birefringence under polarized light. AL amyloidosis was further confirmed by immunohistochemical typing of the amyloid. Exclusion criteria were familial or secondary amyloidosis (n = 18); senile amyloidosis (n = 7); history of moderate or greater systemic or pulmonary hypertension (n = 5); coronary artery disease detected by history of typical symptoms, as well as by regional hypokinesia or akinesia of myocardial segments by standard echocardiography, or induced by exercise echocardiography, or >50% coronary stenosis by angiography (n = 0); and history of moderate or greater degrees of valvular heart disease (n = 0).
Thirty patients were excluded from the analysis on the basis of these exclusion criteria, yielding a final study population of 249 patients. Patients with chronic atrial fibrillation (n = 10) were not excluded.
Patients with AL amyloidosis were evaluated for the extent of amyloid-related organ involvement and for dominant organ involvement, integrating standard criteria described elsewhere,6 along with information provided by the assessment of cardiac biomarkers and left ventricular (LV) wall thickness and diastolic function by echocardiography.
We performed a time-to-event data analysis considering patients altogether, but also selecting only those in whom laboratory and imaging assessments were performed <3 months from diagnosis, to determine the independent predictors of survival. The vital status of each patient was confirmed by review of medical records and the Social Security Death Index. The primary end point was all-cause mortality. Patients who had no records of death were censored at the time they were last known to be alive.
Biomarkers
For all patients, brain natriuretic peptide (BNP), N-terminal pro–BNP (NT-proBNP), and cardiac troponin T levels; creatinine; glomerular filtration rate; proteinuria over 24 hours; and alkaline phosphatase, albumin, and uric acid levels were collected at the time of the echocardiographic examination. Immunoglobulin free light chain and M protein measurements were collected as well. Plasma BNP, NT-proBNP, and troponin T levels were measured as previously described.7 To pool the data of the monoclonal kappa and lambda patients, the clonal free light chain was considered the “involved” immunoglobulin free light chain for the purpose of the analyses. Immunoglobulin clonal free light chain quantitation was carried out as previously described.3
Standard Ultrasound Examination
All ultrasound examinations were performed with a commercially available echocardiographic instrument (Vivid 7; GE Vingmed Ultrasound AS, Horten, Norway). Systolic and diastolic parameters as assessed by standard echocardiography, pulsed-wave Doppler tissue imaging, and timing assessments were measured as previously described.5 Offline analysis of standard echocardiographic variables was performed using dedicated software (ProSolv CardioVascular Analyzer version 3.0; ProSolv CardioVascular, Indianapolis, IN). Each measurement reported is the average of measurements from 3 consecutive beats. This same method was used for patients with chronic atrial fibrillation (n = 10), because their rates were controlled such that their ventricular rhythms were nearly regular. None of the patients was tachycardic during image acquisition. The presence of pleural effusion was ascertained by chest x-ray.
Strain Imaging Data Acquisition and Analysis
DMI was used to measure longitudinal LV myocardial velocity, strain, and strain rate. Narrow-sector views for each LV wall in apical 4-chamber, long-axis, and 2-chamber standard views were acquired as previously described.5 Color 2D digital data from 3 cardiac cycles were analyzed offline using dedicated software (EchoPAC; GE Vingmed Ultrasound AS). Sample volumes were placed on basal, middle, and apical LV segments of the anterolateral, inferoseptal, inferolateral, anteroseptal, inferior, and anterior walls to assess longitudinal DMI.
Longitudinal peak values were determined for systolic myocardial velocity (sMV), systolic strain rate (sSR), and systolic strain (sS). Analysis was performed considering all 16 LV segments individually (data not shown) and also combining them in clusters according to LV levels and according to LV walls. DMI values (sMV, sSR, and sS) were averaged for the 6 basal segments (basal mean), for the 6 middle segments (middle mean), and for the 4 apical segments (apical mean). Values of sSR and sS were averaged for the anterolateral, inferoseptal, inferolateral, anteroseptal, inferior, and anterior walls. Longitudinal early (dMV-E and dSR-E) and late (dMV-A and dSR-A) diastolic peaks were also measured from myocardial velocity imaging and strain rate imaging for each of the 16 LV segments. Clusters of single segments, by level and by wall, were determined using the same strategy used for the systolic measurements.
Statistical Analysis
Statistical analyses were performed using commercially available software (SAS version 8.2; SAS Institute Inc, Cary, NC). The natural logs of BNP, NT-proBNP, creatinine, 24-hour proteinuria, alkaline phosphatase, and clonal free light chain were used in the construction of univariate and multivariate survival models to reduce skewness. Covariate information (clinical data, electrocardiographic findings, biomarkers, and echocardiographic variables) was collected at the time of the echocardiographic examinations in all enrolled patients. Observations with missing values for any of the covariates were excluded from the analysis.
Many of the patients in the study were first referred to the Mayo Clinic some months after their initial diagnoses, a condition known as left truncation. For these cases, a naive computation of the survival curve for time from diagnosis will be biased upward. Left truncation was appropriately taken into account for the survival curves and Cox regression analysis by not considering a subject to be in the risk set until the time of echocardiography.8 Univariate and multivariate analyses of the time to events were performed using Cox proportional-hazard models with demographic, clinical, electrocardiographic, standard echocardiographic, and DMI variables as independent variables. Multivariate models were created for each group of variables sequentially (clinical and electrocardiographic findings, biomarkers, standard echocardiographic findings, systolic DMI measures, and diastolic DMI measures) using a bootstrap approach. Candidate variables for the bootstrap selection were those with univariate P values < .20. One thousand bootstrap samples of size n = 249 were selected with replacement from the data set. For each bootstrap sample, a stepwise model selection technique with a P value for selection and retention of .05 was applied, and the number of times each candidate variable appeared in the final model was tallied. Those variables that appeared in the greatest percentage of models were then placed into the model together. This was repeated for each group of variables sequentially, with those variables from the previous group being retained in subsequent models even if they lost significance as additional variables were added. Nested model tests were performed to see if there was an incremental gain in information at each model step.
The final model was constructed with clinical, electrocardiographic, biomarker, and echocardiographic variables in addition to DMI measures, and it was intended to see if DMI measures added information to the model. We used the survival C-statistic, a measure of concordance between observed and predicted survival from Cox proportional-hazards models, to evaluate the discriminatory ability of the model.9 This measure is similar to the area under the curve for binary end points, but the survival C-statistic is interpreted as the probability of correctly ordering event times using covariate risk score. Standard errors for C-statistics were obtained from 1000 bootstrap samples and used to construct 95% confidence intervals (CIs). A confirmatory analysis was then performed by fitting the final multivariate model obtained in the overall analysis on the subgroup of patients who had diagnoses of AL amyloidosis within 3 months of echocardiography (n =106).
Cut-point values for independent predictors in the final model were determined by the method of Contal and O'Quigley10 using log-rank statistics. This method essentially calculates all possible splits and finds the one that maximizes the log-rank statistic. Those authors also proposed a test statistic that allows one to obtain a P value that adjusts for this maximization. This method of finding cut points has been shown to be similar to approaches based on smoothed residuals from the Cox model, but it is less subjective. Cox regression analysis adjusted for the delayed entry was then performed between the groups defined by the cut point for each predictor.
We created a risk stratification score, initially including all 8 of the independent predictors of survival that were defined by the final model. Those 6 independent predictors that are easiest to measure were then subselected to build a scoring system that is more practical from a clinical standpoint. Continuous variables were dichotomized at their optimal cut points, and a Cox model was fit with only dichotomous variables. The parameter estimates from this model were then used as a basis to assign a score to each variable. The distribution of the sum of these scores for each patient was then examined, and patients were classified into 4 groups on the basis of their total scores. A Kaplan-Meier curve was then drawn to show the survival within each risk group.
We also wanted to determine whether DMI measures provide information on risk stratification even in the absence of abnormalities in independent or generally accepted risk factors, including clinical, standard echocardiographic, and biochemical markers. Therefore, we excluded from the analysis all those patients with altered values in such independent or commonly accepted predictors of mortality and compared the most significant DMI measurements obtained by Cox regression models in our population between survivors and non-survivors at the end of follow-up.
Intraobserver and Interobserver Variability
To examine intraobserver variability (repeatability), a sample of 10 echocardiographic examinations were randomly selected for masked review by the same investigator. To examine interobserver variability, a second investigator blinded to the clinical information and to the results of the first investigator examined 10 randomly selected echocardiographic exams. The number of the digital echocardiographic clip was provided to the repeat observer for the assessment of either intra-observer or interobserver variability. Intraclass correlation coefficients (ICCs) for the same observer and different observers were calculated using previously described formulas for single segments and for the global mean of each DMI modality. Data are presented as mean ± SD, as medians with interquartile ranges (for biomarkers), or as counts and percentages. A difference was considered statistically significant when the P value was <.05. In the multivariate model, a variable was considered a significant predictor of survival when the P value was <.10.
RESULTS
Baseline demographic and clinical variables as well as cardiac and hematologic biomarker levels are detailed in Table 1. Standard 2-dimensional and Doppler echocardiographic results are detailed in Table 2. Longitudinal systolic and diastolic DMI measurements for our study population are displayed in Tables 3 and 4, respectively.
Table 1.
Clinical variables and cardiovascular and hematologic biomarkers in patients with AL amyloidosis (n = 249)
| Variable | Value | Univariate HR (P) |
|---|---|---|
| Age (y) | 63 ± 10 | 1.03 (.005) |
| Men | 155 (62%) | 1.80 (.02) |
| Diagnosis to evaluation (mo) | 6 (24) | |
| Heart rate (beats/min) | 76 ± 13 | 1.02 (.01) |
| NYHA class III/IV | 50 (20%) | 3.00 (<.0001) |
| Pericardial effusion | 81 (33%) | 2.00 (.004) |
| Pleural effusion* | 30 (13%) | 3.50 (<.0001) |
| Low voltage on electrocardiography | 53 (22%) | NS |
| Atrial fibrillation | 10 (4%) | NS |
| Pacemaker/implantable cardioverter-defibrillator | 13 (5%) | NS |
| Stem cell transplantation | 129 (52%) | 0.50 (.009) |
| Biomarkers | ||
| BNP (pg/mL)† | 188.5 (413) | 1.30 (.004) |
| NT-proBNP (pg/mL) | 909 (3160) | 1.30 (.001) |
| Troponin T (ng/mL) | 0.01 (0.04) | 3.20 (<.0001) |
| Creatinine (mg/dL) | 1.2 (0.7) | NS |
| Glomerular filtration rate (mL/min/m2) | 62 (40.5) | NS |
| 24-h proteinuria (mg/24 h) | 1.518 (5.8225) | NS |
| Alkaline phosphatase (U/L) | 92 (55.5) | NS |
| Albumin (g/dL) | 3 (1.07) | NS |
| Uric acid (mg/dL) | 6.4 (2.9) | NS |
| Involved free light chains (mg/dL) | 12.4 (24.915) | NS |
| κ/λ | 0.2 (1.4) | NS |
| M spike (serum) | 0.4 (0.9) | NS |
Data are expressed as mean ± SD, as number (percentage), or as median (interquartile range).
There were 13 missing values for pleural effusion.
There were 34 missing values for BNP.
Table 2.
Two-dimensional and standard Doppler echocardiographic variables in patients with AL amyloidosis (n = 249)
| Variable | Value | Univariate HR (P) |
|---|---|---|
| LV thickness (mm) | 13 ± 3 | 1.10 (.0007) |
| LV mass (g/m2) | 118 ± 42 | NS |
| LV end-systolic diameter (mm) | 28 ± 5 | NS |
| LV end-diastolic diameter (mm) | 45 ± 6 | 0.90 (.003) |
| Left atrial volume (cm3/m2) | 39 ± 13 | NS |
| Ejection fraction (%) | 62 ± 10 | NS |
| Stroke volume (mL) | 80 ± 23 | 0.90 (.01) |
| Cardiac index (L/m2/min) | 3.09 ± 0.7 | NS |
| E-wave velocity (m/s) | 0.8 ± 0.2 | NS |
| E deceleration time (ms) | 197 ± 50 | 0.90 (.03) |
| A-wave velocity (m/s) | 0.7 ± 0.3 | NS |
| E/A ratio | 1.5 ± 1.1 | 1.70 (.007) |
| Pulmonary vein S-wave velocity (m/s) | 0.6 ± 0.6 | 0.20 (.007) |
| Pulmonary vein D-wave velocity (m/s) | 0.6 ± 0.6 | NS |
| Pulmonary vein A reversal velocity (m/s) | 0.3 ± 0.3 | 0.004 (.003) |
| Mitral A–pulmonary vein A reversal | 28 ± 55 | NS |
| Medial mitral annular S′ velocity (m/s) | 0.06 ± 0.01 | 0.80 (.004) |
| Medial mitral annular E′ velocity (m/s) | 0.06 ± 0.02 | 0.70 (.004) |
| Medial mitral annular A′ velocity (m/s) | 0.08 ± 0.02 | 0.80 (.0002) |
| E/E′ ratio | 16.0 ± 8.1 | 1.05 (.0007) |
| Diastolic dysfunction | ||
| Grade 1/1a | 69 (32%) | |
| Grade 2 | 67 (31 %) | |
| Grade 3/4 | 50 (23%) | 1.60 (<.0001) |
| Left index of myocardial performance | 0.52 ± 0.2 | NS |
| Ejection time (ms)* | 282.81 ± 41.1 | 0.90 (.0004) |
Data are expressed as mean ± SD or as number (percentage).
There were 13 missing values for ejection time.
Table 3.
Systolic longitudinal DMI measures in patients with AL amyloidosis (n = 249)
| Variable | Value | Univariate HR (P) |
|---|---|---|
| Myocardial velocity imaging (cm/s) | ||
| Lateral | 3.25 ± 1.4 | NS |
| Inferoseptal | 3.51 ± 1.2 | 0.70 (.002) |
| Posterior | 4.29 ± 1.7 | NS |
| Anteroseptal | 3.56 ± 1.2 | NS |
| Inferior | 3.79 ± 1.3 | NS |
| Anterior | 2.73 ± 1.2 | NS |
| Basal mean | 4.75 ± 1.3 | 0.80 (.01) |
| Middle mean | 3.26 ± 1 | NS |
| Apical mean | 1.85 ± 0.8 | NS |
| Global average | 3.47 ± 1 | 0.80 (.04) |
| Strain rate imaging (1/s) | ||
| Lateral | −0.78 ± 0.4 | NS |
| Inferoseptal | −0.96 ± 0.4 | 4.00 (<.0001) |
| Posterior | −0.81 ± 0.6 | NS |
| Anteroseptal | −0.98 ± 2.9 | 3.40 (<.0001) |
| Inferior | −0.95 ± 0.4 | 2.30 (.005) |
| Anterior | −0.82 ± 0.3 | 2.30 (.03) |
| Basal mean | −0.81 ± 0.5 | 3.90 (<.0001) |
| Middle mean | −0.92 ± 0.7 | 3.50(.001) |
| Apical mean | −0.93 ± 0.3 | NS |
| Global average | −0.88 ± 0.4 | 5.60 (<.0001) |
| Strain imaging (%) | ||
| Lateral | −10.96 ± 5.3 | 1.10 (.008) |
| Inferoseptal | −14.35 ± 6.5 | 1.10 (<.0001) |
| Posterior | −11.62 ± 7 | NS |
| Anteroseptal | −12.52 ± 6.1 | 1.10 (<.0001) |
| Inferior | −13.57 ± 6.3 | 1.10 (<.0001) |
| Anterior | −12 ± 4.7 | 1.10 (<.0001) |
| Basal mean | −11.06 ± 6 | 1.10 (<.0001) |
| Middle mean | −13.65 ± 5.3 | 1.10 (<.0001) |
| Apical mean | −13.7 ± 4.9 | 1.10 (.0002) |
| Global average | −12.71 ± 4.8 | 1.10 (<.0001) |
Data are expressed as mean ± SD. Only clusters of segments, by wall and by level, are reported.
Table 4.
Diastolic longitudinal DMI measures in patients with AL amyloidosis (n = 249)
| Variable | Value | Univariate HR (P) |
|---|---|---|
| Myocardial velocity imaging (cm/s) | ||
| Lateral E | 3.99 ± 1.7 | 0.80 (.01) |
| Lateral A | 3.71 ± 2 | 0.90 (.03) |
| Inferoseptal E | 3.78 ± 1.6 | 0.70 (<.0001) |
| Inferoseptal A | 4.3 ± 2 | 0.80 (.0002) |
| Posterior E | 4.8 ± 2.3 | 0.80 (.0006) |
| Posterior A | 5.01 ± 2.7 | 0.80 (.0009) |
| Anteroseptal E | 3.8 ± 1.6 | 0.70 (.0003) |
| Anteroseptal A | 4.28 ± 2.1 | 0.80 (.009) |
| Inferior E | 3.69 ± 1.7 | 0.80 (.02) |
| Inferior A | 4.61 ± 2.3 | 0.80 (.0002) |
| Anterior E | 3.42 ± 1.6 | NS |
| Anterior A | 3.06 ± 1.8 | 0.90 (.04) |
| Basal mean E | 4.89 ± 2 | 0.80 (<.0001) |
| Basal mean A | 5.46 ± 2.5 | 0.80 (.005) |
| Middle mean E | 3.85 ± 1.6 | 0.70 (.002) |
| Middle mean A | 4.02 ± 2 | 0.80 (.005) |
| Apex mean E | 2.2 ± 0.9 | NS |
| Apex mean A | 1.9 ± 1 | 0.70 (.02) |
| Global average E | 3.81 ± 1.5 | 0.70 (<.0001) |
| Global average A | 4.05 ± 1.8 | 0.80 (.001) |
| Strain rate imaging 1/s | ||
| Lateral E | 1.07 ± 0.5 | 0.50 (.007) |
| Lateral A | 0.96 ± 0.6 | 0.60 (.04) |
| Inferoseptal E | 1.06 ± 0.5 | 0.50 (.003) |
| Inferoseptal A | 1.14 ± 0.6 | 0.50 (.008) |
| Posterior E | 0.93 ± 0.8 | NS |
| Posterior A | 0.89 ± 0.7 | 0.70 (.03) |
| Anteroseptal E | 0.95 ± 0.5 | NS |
| Anteroseptal A | 1.12 ± 0.6 | NS |
| Inferior E | 0.88 ± 0.5 | 0.50 (.02) |
| Inferior A | 1.07 ± 0.6 | 0.60 (.02) |
| Anterior E | 1.10 ± 0.5 | NS |
| Anterior A | 1.06 ± 0.6 | NS |
| Basal mean E | 0.84 ± 0.5 | NS |
| Basal mean A | 0.97 ± 0.5 | 0.50 (.0019) |
| Middle mean E | 1.07 ± 0.5 | 0.50 (.007) |
| Middle mean A | 1.03 ± 0.5 | 0.50 (.007) |
| Apex mean E | 1.12 ± 0.5 | NS |
| Apex mean A | 1.08 ± 0.6 | NS |
| Global average E | 0.98 ± 0.4 | 0.40 (.009) |
| Global average A | 0.99 ± 0.5 | 0.40 (.001) |
Data are expressed as mean ± SD. Only clusters of segments, by wall and by level, are reported. Comparisons were made using t tests.
The mean age was 63 years, and 155 patients (68%) were men. The heart was the major organ involved in 93 patients (37%), and myocardial biopsy was performed in 37 patients (15%). The kidney was the major organ involved in 113 patients (45%), and within these two groups, 62 patients (24%) had major and equal involvement of both the heart and the kidney. The peripheral nervous system and gastrointestinal tract were primarily involved in 13 (5%) and 12 (5%) patients, respectively. High-dose chemotherapy (melphalan plus prednisone) followed by peripheral blood stem cell transplantation (PBSCT) was performed in 129 patients (52%).
Survival Analysis
Overall Analysis
The median follow-up time for censored patients was 21 months (interquartile range, 11–35 months), and the median follow-up time for patients who died was 5 months (interquartile range, 0.6–28 months). There were 75 deaths (30%) among these patients. Survival curves are shown in Figure 1. Hazard ratios [HRs] by univariate analysis are reported in Tables 1 to 4. The results of univariate survival analysis are not discussed further.
Figure 1.

Cumulative survival in an analysis of death according to (A) LV thickness, (B) BNP level, (C) ejection time, and (D) sS in the basal anteroseptum (groups are classified by the best cut point). Analysis time is expressed in years. The number of subjects (unadjusted) at risk per year is also listed.
The results of 4 multivariate models developed in stepwise fashion are detailed in Table 5. When all variables, including demographic and clinical information, electrocardiographic findings, cardiac and hematologic biomarkers, standard echocardiographic variables, and systolic and diastolic DMI, were considered together, the significant independent predictors of survival were age (HR, 1.03), New York Heart Association (NYHA) class III or IV (HR, 2.5), log BNP level (HR, 1.3), the presence of pleural effusion (HR, 1.8), LV ejection time (HR, 0.99), sS of the basal anteroseptal segment (HR, 1.05), sSR of the apical lateral segment (HR, 0.2), and sMVof the middle anteroseptal segment (HR, 0.7) (Table 5, model A). For the multivariate analysis, survival in patients with and without missing values was compared, and no differences were found. The global C-statistics obtained combining these variables was 0.78 (95% CI, 0.72–0.84).
Table 5.
Stepwise multivariate Cox proportional-hazard models (n = 249)
| Predictor | HR (95% CI) | P | Univariate C-statistic (95% CI) |
|---|---|---|---|
| Model A: clinical data and biomarkers* | |||
| Age | 1.04(1.01–1.07) | .004 | 0.60 (0.52–0.67) |
| NYHA class III/IV | 2.77(1.53–5.01) | .001 | 0.60 (0.54–0.66) |
| Log BNP | 1.34(1.08–1.66) | .007 | 0.60(0.51–0.69) |
| Model B: clinical data, biomarkers, and standard echocardiographic parameters† | |||
| Age | 1.05(1.02–1.08) | .001 | 0.60 (0.52–0.67) |
| NYHA class III/IV | 1.87(0.98–3.55) | .06 | 0.60 (0.54–0.66) |
| Pleural effusion | 2.07(1.11–3.86) | .01 | 0.57 (0.52–0.63) |
| Log BNP | 1.31 (1.06–1.62) | .02 | 0.60(0.51–0.69) |
| Ejection time | 0.99 (0.98–1.00) | .03 | 0.65 (0.58–0.73) |
| Model C: clinical data, biomarkers, standard echocardiographic parameters, and DM I parameters‡ | |||
| Age | 1.03(1.00–1.07) | .03 | 0.60 (0.52–0.67) |
| NYHA class III/IV | 2.47(1.23–4.96) | .01 | 0.60 (0.54–0.66) |
| Pleural effusion | 1.79(0.92–3.46) | .08 | 0.57 (0.52–0.63) |
| Log BNP | 1.30(1.05–1.60) | .02 | 0.60(0.51–0.69) |
| Ejection time | 0.99 (0.98–1.00) | .13 | 0.65 (0.58–0.73) |
| Apical lateral sSR | 0.24(0.11–0.50) | .0002 | 0.51 (0.43–0.58) |
| Basal anteroseptal sS | 1.05 (1.01–1.09) | .02 | 0.66 (0.59–0.73) |
| Middle anteroseptal sMV | 0.70 (0.54–0.91) | .009 | 0.55 (0.47–0.62) |
| Model D: independent predictors of survival, subgroup multivariate analysis for 106 patients with AL amyloid diagnosis <3 mo after echocardiography and other testing§ | |||
| Age | 1.09(1.02–1.16) | .008 | 0.62 (0.52–0.72) |
| NYHA class III/IV | 2.94 (0.92–9.41) | .07 | 0.64 (0.56–0.72) |
| Pleural effusion | 1.78(0.55–5.74) | .33 | 0.58 (0.50–0.65) |
| Log BNP | 1.24(0.89–1.72) | .21 | 0.57 (0.46–0.69) |
| Ejection time | 0.99 (0.97–1.00) | .03 | 0.74 (0.65–0.83) |
| Apical lateral sSR | 0.06(0.01–0.23) | <.0001 | 0.50(0.40–0.61) |
| Basal anteroseptal sS | 1.05(0.98–1.14) | .16 | 0.70(0.61–0.79) |
| Middle anteroseptal sMV | 0.53(0.31–0.90) | .02 | 0.57 (0.47–0.67) |
The end point was death from any cause. The models were built with a stepwise (backward) approach, initially considering all 249 patients together, and were validated using the bootstrap technique.
Clinical data and biomarkers were considered together. Excluding patients with missing values, 215 patients were included, with a total of 63 events. Model C-statistic = 0.72 (95% CI, 0.63–0.80).
Clinical data, biomarkers, and standard echocardiographic variables were considered together. Model C-statistic = 0.74 (95% CI, 0.66–0.81).
Clinical data, biomarkers, standard echocardiographic variables, and DMI variables were considered together. Excluding patients with missing values, 196 patients were included, with a total of 57 events. Model C-statistic = 0.78 (95% CI, 0.72–0.84).
Subgroup multivariate Cox proportional-hazards model. Model C was applied to the population of patients enrolled at the time of diagnosis (total n = 106). Excluding patients with missing values, 80 patients were included, with a total of 22 events. Model C-statistic = 0.87 (95% CI, 0.81–0.93).
Optimal cut points for the independent predictors of survival in the final model were a BNP level of 493 pg/mL, an ejection time of 273 ms, sS in the basal anteroseptal segment of −7.5%, sSR in the apical lateral segment of −0.75 s−1, and sMV in the middle anteroseptal segment of 3.8 cm/s, although sSR in the apical lateral segment and sMV in the middle anteroseptal segment were significant only after adjusting for sS in the basal anteroseptal segment. Survival curves stratified by such cut points are reported in Figures 1 A to 1C for BNP, ejection time, and basal anteroseptal sS.
When patients who died (n = 75) were excluded, 114 of the 174 patients (65%) alive at the end of follow-up were positive (over the cut points presented) for ≥1 of the 8 above-mentioned independent predictors. However, no surviving patient had abnormal values for all 8 of these predictors.
To further evaluate the incremental prognostic value of strain imaging for these patients, we sequentially excluded patients in NYHA class III or IV (n = 50), with pleural effusion (n = 16), with LV thickness ≥ 13 mm (n = 67), with BNP levels ≥60 pg/mL (n = 75), with diastolic dysfunction grade III or IV (n = 1), and with ejection times ≤ 270 ms (n = 2). Thirty-eight patients remained in the data set, with 6 events before the end of follow-up. Although the difference was not statistically significant (P = .26) in this small, underpowered subset, longitudinal sS of the basal anteroseptum was higher in the 32 patients alive at the end of follow-up compared with the 6 patients who had died (−16.2±1.3% vs−12.2±3.7%, respectively, P = .26).
Subgroup Analysis
In the group of patients enrolled at the time the diagnosis was ascertained who completed laboratory, standard echocardiographic, and DMI assessment within 3 months (n = 106), there were 25 events in a median follow-up period of 18 months. HRs and significant predictors in the multivariate survival analysis were similar for these patients diagnosed <3 months after echocardiography compared with the entire cohort (Table 5, model D), and the C-statistics of the model were not different (P = .17). When independent predictors of survival defined in the overall analysis, considering all the groups of variables together, were applied to this subgroup of patients, the presence of pleural effusion, log BNP level, and basal anteroseptal sS were no longer significant at the .15 level. However, HRs and their 95% CIs, as well as regression coefficients and their standard errors, were similar to those obtained in the overall analysis.
Risk-Scoring System
Initially, all 8 independent predictors were considered in the scoring system, with the results illustrated in Figure 2A. To develop a scoring system that is more clinically relevant, apical lateral sSR and middle anteroseptal sMV were excluded, reducing the risk stratification scoring system to 6 predictors as follows, with a starting point of 0: for age ≥ 67 years, add 3; for NYHA class III or IV, add 3; if pleural effusion is present, add 2; if BNP level is ≥ 493 pg/mL, add 3; if ejection time is ≤ 273 ms, add 2; and if basal anteroseptal sS is less negative than or equal to −7.5%, add 3. It was possible to differentiate 4 “groups” of risk: the low-risk group had a score of 0, the mild-risk group had a score between 1 and 6, the moderate-risk group had a score of 7 or 8, and the high-risk group had a score ≥ 9 (Figure 2B).
Figure 2.
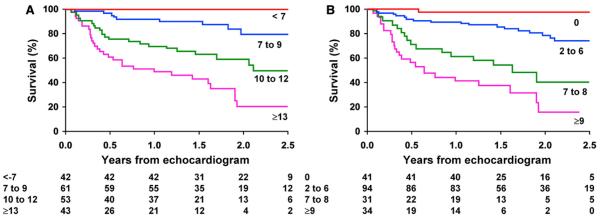
Cumulative survival in an analysis of death according to risk factor score with (A) all 8 independent predictors of mortality included and (B) longitudinal sSR in the apical lateral segment and sMV in the middle anteroseptal segment excluded. (A) Risk factor score was computed as the sum of scores for age ≥ 67 years (+3), NYHA class III or IV (+4), BNP ≥ 493 pg/mL (+3), pleural effusion (+2), ejection time ≤ 273 ms (+1), basal anteroseptal sS less negative than or equal to −7.5% (+3), apical lateral sSR more negative than or equal to −0.75 s−1 (+3), and middle anteroseptal sMV ≤ 3.8 (+4). Total score was used to classify patients into 4 risk groups (<7, 7–9, 10–12, and ≥13). (B) Risk factor score was computed as the sum of scores for age ≥ 67 years (+3), NYHA class III or IV (+4), BNP ≥ 493 pg/mL (+3), pleural effusion (+2), ejection time ≤ 273 ms (+1), basal anteroseptal sS less negative than or equal to −7.5% (+3). Total score was used to classify patients into 4 risk groups (0, 1–6, 7 or 8, and ≥9). Analysis time is expressed in years.
Interobserver and Intraobserver Variability
Considering the longitudinal systolic DMI mean of all 16 LV segments, the ICCs for intrareader reproducibility were very similar for sMV (ICC, 0.99; 95% CI, 0.99–0.99), sS (ICC, 0.99; 95% CI, 0.99–0.99, and sSR (ICC, 0.98; 95% CI, 0.93–0.99). The ICCs for inter-reader reproducibility were similarly high for sMV (ICC, 0.99; 95% CI, 0.98–0.99), sS (ICC, 0.99; 95% CI, 0.99–0.99), and sSR (ICC, 0.99; 95% CI, 0.97–0.99).
Regarding diastolic DMI measures, the ICCs for intrareader variability were higher for dMV-E (ICC, 0.96; 95% CI, 0.98–1) and dMV-A (ICC, 0.99; 95% CI, 0.87–1) than for dSR-E (ICC, 0.83; 95% CI, 0.85–1) and dSR-A (ICC, 0.96; 95% CI, 0.86–1). The ICCs for interreader variability were high for all measurements but were better for dMV-E (ICC, 0.99; 95% CI, 0.92–1) and dMV-A (ICC, 0.94; 95% CI, 0.98–1) than for dSR-E (ICC, 0.93; 95% CI, 0.63–1) and dSR-A (ICC, 0.94; 95% CI, 0.92–1).
DISCUSSION
The main findings of the current investigation are as follows: (1) in patients with AL amyloid, clinical variables, biomarkers, and DMI echocardiography were predictive of mortality; (2) ejection time was confirmed as an essential independent predictor of survival; and (3) longitudinal systolic DMI measurements, specifically sSR and sS, were among the most significant independent predictors of survival in multivariate analysis.
Different studies have demonstrated the prognostic usefulness of cardiovascular functional assessment in patients with systemic amyloidosis,11 and the value of longitudinal DMI measures for the early detection of cardiac involvement has been proven.4,5 However, no data exist on a direct comparison between globally accepted cardiovascular and hematologic prognostic factors, including standard 2-dimensional and Doppler echocardiography, and newer techniques, including strain imaging.
Consistent with a recent study by Austin et al,12 our multivariate analysis shows that NYHA class III or IV is an independent predictor of poor outcome among clinical variables. The only other clinical variables we found to be independently related to mortality were age and pleural effusion. Berk et al13 previously reported that pleural effusion affects 6% to 18% of patients with AL amyloidosis and that its presence significantly reduces life expectancy. Although most patients with large pleural effusions also have manifestations of AL cardiomyopathy, the formation and persistence of these effusions appear to be due predominantly to amyloid infiltration of the pleura, with a lesser contribution from heart failure.
Consistent with previous studies,2 BNP and troponin T levels were significant predictors of outcome in the univariate analysis (BNP was slightly more significant than NT-proBNP). However, only BNP was still significant after controlling for clinical, electrocardiographic, echocardiographic, and DMI variables. Troponin T levels were no longer significant in the multivariate analysis, mainly because they correlated with NYHA class, ejection time, and sS of the basal anteroseptal segment, which were all slightly better predictors of mortality than troponin T.
Klein et al14 first demonstrated the usefulness of Doppler diastolic functional measures to predict outcomes in patients with cardiac amyloid, and in the current cohort, we found that several parameters of diastolic performance were significant predictors of poor outcomes in the univariate analysis. However, measurements of transmitral flow by Doppler, including E/A and E/E′ ratios and E-wave deceleration time, as well as diastolic dysfunction grade, were not significant predictors of mortality in the multivariate survival analysis that included clinical information, biochemical markers, and DMI values. This observation is consistent with a recent study by Rapezzi et al,15 who recruited a similar study population but with a median follow-up period of about 9 years. Diastolic dysfunction grade is associated with both NYHA class16 and BNP level,16 both of which are independent predictors of mortality in our study population. For this reason, we still believe that indentifying diastolic dysfunction is useful for risk stratifying patients with AL amyloid, even though the standard measures of diastolic dysfunction are not independent predictors of survival for these patients.
In the present study, we were also able to confirm our previous observation that ejection time is an important prognostic measure in patients with AL amyloidosis.7 This observation is similar to that of Migrino et al,17 who used a longer follow-up period (median, 29 months) and a multivariate survival analysis that included biomarkers as well as clinical and standard echocardiographic variables. Ejection time ≤ 240 ms, NYHA class III or IV, and alkaline phosphatase levels were the only independent predictors of mortality in their group of patients with AL amyloidosis. It is noteworthy that the cutoff value for ejection time identified as the most accurate for risk stratification was slightly different in their study compared with ours, likely because we included patients in very early stages of cardiac involvement.
We recently showed that DMI provides sensitive measures of LV functional impairment in patients with AL amyloidosis in both early and advanced stages.5,18,19 In particular, longitudinal sS and sSR of the LV basal segments are highly accurate in detecting early myocardial dysfunction, even in patients with apparently normal 2-dimensional and Doppler echocardiographic findings. Therefore, it is not surprising that longitudinal sS of the basal anteroseptal segment reached highest significance as an independent predictor of poor outcomes in the current multivariate analysis. This underscores the importance of cardiac involvement in determining overall mortality in this population.
At first glance, it may be surprising that sSR of the apical lateral segment was also highly significant in predicting mortality for this group of patients with AL amyloid. However, it is important to note that longitudinal sS of the basal anteroseptum and longitudinal sSR measured at the apex of the lateral wall had opposite HRs. In other words, once controlling for a low longitudinal sS, the higher (ie, more negative) the sSR of the apical lateral segment, the higher the risk for death. We interpret the “improvement” in sSR as an inefficient attempt of the myocardium to compensate for the marked impairment of first basal and then middle LV segments: patients with the most advanced dysfunction of the longitudinal fibers at the basal and middle ventricular levels develop compensatory increase in longitudinal systolic function at the apex. Because this compensatory mechanism is temporary and ineffective, these patients with increased apical sSR have worse prognoses, while patients with somewhat preserved longitudinal LV function of the basal and middle segments, who do not demonstrate increased longitudinal sSR at the apex (no need to compensate), have better prognoses.
We have also shown that although many patients alive at the end of follow-up had abnormal values of ≥1 of the 8 independent predictors, none of the survivors were abnormal for all 8 of the predictors. To clarify whether DMI measures can be useful for risk stratification even in patients with normal values of the other independent predictors identified here, including generally accepted standard echocardiographic or biochemical prognostic factors, we compared sS of the basal anteroseptum between patients alive at the end of follow-up and those who died. Even when considering patients with normal clinical, standard echocardiographic, or biochemical values at enrollment, longitudinal systolic DMI was still lower in patients who died compared with patients alive at the end of follow-up. Although the difference was not statistically different, given the small number of patients in this subset, it is our opinion that this analysis supports DMI (specifically longitudinal sS of basal anteroseptum) as providing prognostic information, even in patients with normal clinical findings, biochemical markers, standard echocardiographic measures, and ejection times. In an attempt to most meaningfully translate our findings to clinical practice, we have defined a practical risk stratification scoring system using 6 of the independent risk factors (Figure 2B).
Limitations
Many of the patients (n = 144) in this study were first referred to the Mayo Clinic some months after their initial diagnoses. This could lead to upward bias in the survival curves, so we applied appropriate methods to correct for the left truncation for the entire cohort. Because the subgroup of patients enrolled around the time of diagnosis (n = 106) is likely most representative of patients being encountered by clinicians and cardiologists working at primary or secondary referral centers, we tested the generalizability of the final multivariate model by applying the same predictors to this subgroup. HRs, regression coefficients, and overall C-statistics were similar for this subgroup, compared with the entire cohort, suggesting that patients enrolled around the time of diagnosis do not behave differently compared with the whole study population and that the same criteria can be used to stratify their risk for death. However, statistical power in this relatively small subset was limited. Although we excluded patients with missing values from the multivariate analysis, we tested the effect of this exclusion, and no differences in survival were found for patients with and without missing values. Therefore, we chose a conservative strategy of only reporting results for patients without missing values, at the expense of reducing statistical power for this analysis.
Literally dozens of variables have been tested in this investigation for their potential role as prognostic factors, in a follow-up period during which there were only 75 events. For this reason, some of the predictors that were omitted from our multivariate analysis could still be useful, as has been reported by other researchers.12,15,17 Cut points are subjected to the same variability, which might result in different institutions finding different cut points on a similar study population. We accounted for the high variability intrinsic to our specific study design by setting a higher level of significance for keeping a predictor in the model (P = .10 instead of P = .05). We made this decision so as to include the presence of pleural effusion and ejection time in the model. Although these are only marginally significant from a statistical standpoint, they are easily identified and measured, and they are highly statistically significant when the more sophisticated DMI measures are not considered.
It is noteworthy that PBSCT was a protective factor in the univariate analysis but did not retain its significance in the final model. Teasing out the relative contributions of diagnostic variables from treatment variables in predicting outcomes is extremely difficult. In accordance with previous recommendations,20,21 most patients referred for PBSCT at our institution for AL amyloidosis are in early stages of disease, with relatively mild abnormalities of clinical and serologic markers and with no signs of cardiac involvement on standard echocardiography. This approach necessarily excludes patients with the worst echocardiographic and clinical variables from PBSCT. Studies of different designs are necessary to determine whether or not PBSCT is truly a protective factor.
For this investigation, LV strain and strain rate were measured by DMI. Preliminary studies indicate that newer 2D techniques for measuring strain and strain rate can be performed more rapidly than DMI and are associated with less interobserver and intraobserver variability. Nevertheless, our investigation demonstrates the prognostic value of longitudinal Doppler myocardial strain and strain rate measurements for patients with systemic amyloid, and we anticipate that studies that use 2D strain methods will provide similar conclusions. The one exception is that the cutoff values we have herein established for longitudinal strain and strain rate measured by DMI may not be the same cutoffs when these parameters are measured by 2D techniques.
CONCLUSION
We compared for the first time clinical, laboratory, and extensive echocardiographic variables to define the most significant independent predictors of survival for patients with AL amyloid, and the cut points for NYHA class III or IV, presence of pleural effusion, BNP level > 493 pg/mL, and LV ejection time < 273 ms identified patients with the worst prognoses. Similarly, longitudinal sS in the basal anteroseptal segment less negative than −7.5% was a powerful predictor of poor clinical outcomes in this patient population. For patients with basal anteroseptal sS below the cut point of −7.5%, both sSR apical lateral more negative than −0.75 s−1 and middle anteroseptal sMV < 3.8 cm/s were independent predictors of mortality.
We developed our scoring system from a referral population at our tertiary care center. Further studies enrolling larger patient populations and with longer follow-up are warranted to confirm the usefulness of the independent predictors we have identified and to validate the risk stratification scoring system we have developed in clinical settings in which patients are seen by their primary physicians or cardiologists. In particular, we encourage larger studies with longer follow-up to determine the role of these risk factors and our scoring system in selecting patients for PBSCT compared with melphalan and prednisone chemotherapy alone.
Abbreviations
- BNP
Brain natriuretic peptide
- CI
Confidence interval
- DMI
Doppler myocardial imaging
- dMV
Diastolic myocardial velocity
- dMV-A
Late diastolic myocardial velocity
- dMV-E
Early diastolic myocardial velocity
- dSR-A
Late diastolic strain rate
- dSR-E
Early diastolic strain rate
- HR
Hazard ratio
- ICC
Intraclass correlation coefficients
- LV
Left ventricular
- NT-proBNP
N-terminal pro-BNP
- NYHA
New York Heart Association
- PBSCT
Peripheral blood stem cell transplantation
- sMV
Systolic myocardial velocity
- sS
Systolic strain
- sSr
Systolic strain rate
- 2D
Two-dimensional
REFERENCES
- 1.Wright JR, Calkins E. Clinical-pathologic differentiation of common amyloid syndromes. Medicine (Baltimore) 1981;60:429–48. doi: 10.1097/00005792-198111000-00004. [DOI] [PubMed] [Google Scholar]
- 2.Dispenzieri A, Gertz MA, Kyle RA, Lacy MQ, Burritt MF, Therneau TM, et al. Prognostication of survival using cardiac troponins and N-terminal pro-brain natriuretic peptide in patients with primary systemic amyloidosis undergoing peripheral blood stem cell transplantation. Blood. 2004;104:1881–7. doi: 10.1182/blood-2004-01-0390. [DOI] [PubMed] [Google Scholar]
- 3.Dispenzieri A, Lacy MQ, Katzmann JA, Rajkumar SV, Abraham RS, Hayman SR, et al. Absolute values of immunoglobulin free light chains are prognostic in patients with primary systemic amyloidosis undergoing peripheral blood stem cell transplantation. Blood. 2006;107:3378–83. doi: 10.1182/blood-2005-07-2922. [DOI] [PMC free article] [PubMed] [Google Scholar]
- 4.Koyama J, Ray-Sequin PA, Falk RH. Longitudinal myocardial function assessed by tissue velocity, strain, and strain rate tissue Doppler echocardiography in patients with AL (primary) cardiac amyloidosis. Circulation. 2003;107:2446–52. doi: 10.1161/01.CIR.0000068313.67758.4F. [DOI] [PubMed] [Google Scholar]
- 5.Bellavia D, Pellikka PA, Abraham TP, Al-Zahrani GB, Dispenzieri A, Oh JK, et al. Evidence of impaired left ventricular systolic function by Doppler myocardial imaging in patients with systemic amyloidosis and no evidence of cardiac involvement by standard two-dimensional and Doppler echocardiography. Am J Cardiol. 2008;101:1039–45. doi: 10.1016/j.amjcard.2007.11.047. [DOI] [PubMed] [Google Scholar]
- 6.Gertz MA, Comenzo R, Falk RH, Fermand JP, Hazenberg BP, Hawkins PN, et al. Definition of organ involvement and treatment response in immunoglobulin light chain amyloidosis (AL): a consensus opinion from the 10th International Symposium on Amyloid and Amyloidosis, Tours, France, 18–22 April 2004. Am J Hematol. 2005;79:319–28. doi: 10.1002/ajh.20381. [DOI] [PubMed] [Google Scholar]
- 7.Bellavia D, Pellikka PA, Abraham TP, Al-Zahrani G, Dispenzieri A, Oh J, et al. “Hypersynchronization” by tissue velocity imaging in patients with cardiac amyloidosis. Heart. 2009;95:234–40. doi: 10.1136/hrt.2007.140343. [DOI] [PubMed] [Google Scholar]
- 8.Andersen PK, Gill RD. Cox's regression model counting process: a large sample study. Ann Stat. 1982;10:1100–20. [Google Scholar]
- 9.Harrell FEJ, Lee KL, Mark DB. Multivariable prognostic models: issues in developing models, evaluating assumptions and adequacy, and measuring and reducing errors. Stat Med. 1996;15:361–87. doi: 10.1002/(SICI)1097-0258(19960229)15:4<361::AID-SIM168>3.0.CO;2-4. [DOI] [PubMed] [Google Scholar]
- 10.Contal C, O'Quigley J. An application of changepoint methods in studying the effect of age on survival in breast cancer. Comput Stat Data Anal. 1999;30:253–70. [Google Scholar]
- 11.Skinner M, Sanchorawala V, Seldin DC, Dember LM, Falk RH, Berk JL, et al. High-dose melphalan and autologous stem-cell transplantation in patients with AL amyloidosis: an 8-year study. Ann Intern Med. 2004;140:85–93. doi: 10.7326/0003-4819-140-2-200401200-00008. [DOI] [PubMed] [Google Scholar]
- 12.Austin BA, Duffy B, Tan C, Rodriguez ER, Starling RC, Desai MY. Comparison of functional status, electrocardiographic, and echocardiographic parameters to mortality in endomyocardial-biopsy proven cardiac amyloidosis. Am J Cardiol. 2009;103:1429–33. doi: 10.1016/j.amjcard.2009.01.361. [DOI] [PubMed] [Google Scholar]
- 13.Berk JL, Keane J, Seldin DC, Sanchorawala V, Koyama J, Dember LM, et al. Persistent pleural effusions in primary systemic amyloidosis: etiology and prognosis. Chest. 2003;124:969–77. doi: 10.1378/chest.124.3.969. [DOI] [PubMed] [Google Scholar]
- 14.Klein AL, Hatle LK, Taliercio CP, Oh JK, Kyle RA, Gertz MA, et al. Prognostic significance of Doppler measures of diastolic function in cardiac amyloidosis. A Doppler echocardiography study. Circulation. 1991;83:808–16. doi: 10.1161/01.cir.83.3.808. [DOI] [PubMed] [Google Scholar]
- 15.Rapezzi C, Merlini G, Quarta CC, Riva L, Longhi S, Leone O, et al. Systemic cardiac amyloidoses: disease profiles and clinical courses of the 3 main types. Circulation. 2009;120:1203–12. doi: 10.1161/CIRCULATIONAHA.108.843334. [DOI] [PubMed] [Google Scholar]
- 16.Bursi F, Weston SA, Redfield MM, Jacobsen SJ, Pakhomov S, Nkomo VT, et al. Systolic and diastolic heart failure in the community. JAMA. 2006;296:2209–16. doi: 10.1001/jama.296.18.2209. [DOI] [PubMed] [Google Scholar]
- 17.Migrino RQ, Mareedu RK, Eastwood D, Bowers M, Harmann L, Hari P. Left ventricular ejection time on echocardiography predicts long-term mortality in light chain amyloidosis. J Am Soc Echocardiogr. 2009;22:1396–402. doi: 10.1016/j.echo.2009.09.012. [DOI] [PMC free article] [PubMed] [Google Scholar]
- 18.Al-Zahrani GB, Bellavia D, Pellikka PA, Dispenzieri A, Hayman SR, Oh JK, et al. Doppler myocardial imaging compared to standard two-dimensional and Doppler echocardiography for assessment of diastolic function in patients with systemic amyloidosis. J Am Soc Echocardiogr. 2009;22:290–8. doi: 10.1016/j.echo.2008.11.013. [DOI] [PubMed] [Google Scholar]
- 19.Bellavia D, Abraham TP, Pellikka PA, Al-Zahrani GB, Dispenzieri A, Oh JK, et al. Detection of left ventricular systolic dysfunction in cardiac amyloidosis with strain rate echocardiography. J Am Soc Echocardiogr. 2007;20:1194–202. doi: 10.1016/j.echo.2007.02.025. [DOI] [PubMed] [Google Scholar]
- 20.Comenzo RL, Vosburgh E, Falk RH, Sanchorawala V, Reisinger J, Dubrey S, et al. Dose-intensive melphalan with blood stem-cell support for the treatment of AL (amyloid light-chain) amyloidosis: survival and responses in 25 patients. Blood. 1998;91:3662–70. [PubMed] [Google Scholar]
- 21.Dispenzieri A, Lacy MQ, Kyle RA, Therneau TM, Larson DR, Rajkumar SV, et al. Eligibility for hematopoietic stem-cell transplantation for primary systemic amyloidosis is a favorable prognostic factor for survival. J Clin Oncol. 2001;19:3350–6. doi: 10.1200/JCO.2001.19.14.3350. [DOI] [PubMed] [Google Scholar]