

Summary
Infectious disease models are important tools for understanding epidemiology and supporting policy decisions for disease control. In the case of tuberculosis (TB), such models have informed our understanding and control strategies for over 40 years, but the primary assumptions of these models – and their most urgent data needs – remain obscure to many TB researchers and control officers. The structure and parameter values of TB models are informed by observational studies and experiments, but the evidence base in support of these models remains incomplete. Speaking from the perspective of infectious disease modelers addressing the broader TB research and control communities, we describe the basic structure common to most TB models and present a “wish list” that would improve the evidence foundation upon which these models are built. As a comprehensive TB research agenda is formulated, we argue that the data needs of infectious disease models – our primary long-term decision-making tools – should figure prominently.
Keywords: Tuberculosis, Infectious Disease Transmission, Theoretical Models
Introduction
Tuberculosis (TB) is a curable disease, yet kills 1.7 million people every year.1 In response to this unacceptable disease burden, leaders of the TB research community are formulating a coordinated research agenda.2, 3 Meanwhile, policymakers and health officials at all levels must make decisions about how best to develop, implement, and scale up TB control measures. These individuals often rely on mathematical models that estimate the population-level impact of interventions on TB transmission.4 The first models to use assumptions about the natural history and transmission dynamics of TB in order to project the population-level impact of control strategies were developed in the 1960s.5–7 Since that time, TB models have provided support for the implementation of many policies such as Directly Observed Therapy, Short-Course (DOTS)8 and have informed the research agenda for new interventions including drugs, diagnostics, and vaccines.9
Global disease control programs face the task of identifying which interventional strategies offer the highest probability of improving population health. For example, in the coming five years, many national policymakers will decide whether to scale-up novel TB diagnostics (e.g., Xpert MTB/RIF) that have demonstrated impressive operational characteristics (e.g. sensitivity/specificity) but are not known to reduce TB incidence or mortality on the population level. Studies of such population-level outcomes (e.g. cluster-randomized trials) are expensive and time-consuming, can only address a limited number of questions, and are often difficult to generalize. When such experimental evidence is not feasible or not yet available, infectious disease models provide a quantitative framework to project population-level effects (e.g., reduced TB incidence) from evidence at the individual level (e.g., operating characteristics of a diagnostic test).
Published descriptions of infectious disease models typically describe the impact of various assumptions encoded in the model. These analyses (e.g. sensitivity and uncertainty analyses10) are often described in technical language and, for space limitations, placed in supplementary appendices. As such, readers may not be fully aware of which modeling assumptions most strongly influence model behavior. Many assumptions shared across TB models are both highly influential to model behavior and based on limited empirical data. Our goal here is to highlight these assumptions as priority areas where additional research can directly lead to improved models, and thereby to better decision-making for TB control.
To advance this goal, we first provide an introduction to the basic structure and simplifying assumptions of many TB models. We then present a simple infectious disease model, calibrated to global estimates of TB incidence and prevalence, that we use to identify the most influential modeling assumptions and the corresponding gaps in evidence. Finally, we use this model to generate a “wish list” of data elements that would bridge these gaps and increase both the usefulness of TB models and our confidence in their results.
TB Models: Basic Structure
Since infectious disease models are developed to answer specific questions, each model’s structure will reflect unique aspects of the question posed. For example, a model focusing on drug-resistant TB must consider processes related to the acquisition and transmission of drug resistance and may therefore address HIV/TB in simplistic fashion, whereas a model of HIV/TB co-dynamics may do the opposite. Nevertheless, most TB models share common structural elements, which form the basis of our discussion here.
A common and relatively simple modeling approach is the compartmental model, which describes a population divided into mutually exclusive health states (compartments) and uses differential equations to represent the mechanisms of transition between these health states. A prototypical TB model might include five compartments with respect to TB disease status: uninfected, latently infected (recent), latently infected (remote), active TB, and recovered (Figure 1). Such a model could be used to simulate a TB epidemic under different sets of assumptions to project the effects of alternative decisions (e.g., TB control interventions).11 An advantage of infectious disease models for decision-making is that the current state of the model (e.g., size of the “active TB” compartment) influences rates of flow between compartments (e.g., size of the “infection” arrow in Figure 1). This allows infectious disease models to capture the feedback loops and non-linear dynamics (e.g., immediate reductions in disease duration leading to future reductions in transmission) typical of infectious disease epidemics. While other dynamic modeling approaches (e.g., individual-based models12) also exist, we focus here on compartmental models as they have been used most commonly to guide policy decisions.
Figure 1. Simplified TB Model.
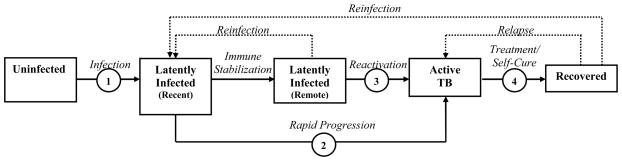
The basic structure that is common to many compartmental transmission models of TB. Health states are represented by boxes and transitions are indicated by arrows. We highlight assumptions necessary to estimate rates associated with four basic processes (in circles): infection, rapid progression, reactivation, and treatment/recovery. Mortality (not shown) also occurs from each box.
TB Models: Assumptions
When building infectious disease models, modelers typically must make two different types of choices.4 First, they must specify the model structure: the number of compartments and how they relate to each other. Additional complexity can be built around a simple structure (e.g., the five compartments in Figure 1) to answer policy questions of interest. However, increased model complexity comes at a substantial cost. For example, dividing the model population into two sub-populations (e.g., HIV-positive vs. HIV-negative) may double the number of compartments, and thus the number of parameters required. Unnecessarily complex models often lack the transparency and interpretability needed to inform appropriate decision-making by policymakers. As a result, the simplest model that can adequately represent relevant phenomena is generally preferred.13 Testing the effects of adding model complexity (i.e., structural assumptions) is difficult, often requiring the construction of parallel models with different structures14–16 or incorporating more advanced modeling techniques (e.g., Bayesian networks17). To date, such analyses have been infrequently performed, and there is no standardized way to include them in traditional sensitivity analyses; thus, while addressing “structural” uncertainty is an important consideration for building better TB models, we do not discuss this challenge in further detail here.
Once the compartmental structure of a model is developed, modelers must specify the parameters that determine the flows between model compartments. For example, the rate at which infected individuals develop active TB depends on a rate of progression during latency; this rate must be introduced as a parameter in the model. Where possible, parameter values should be well-supported by data obtained through either observation or experimental study. This is most important for parameters with strong effects on model behavior. In order to identify the most pressing data needs for building better TB models, therefore, we created a simple model (basic structure in Figure 1, mathematical description in Box 1) to identify and quantify parameters that (a) strongly influence model behavior and (b) carry substantial uncertainty as to their appropriate contemporary value.
Box 1. Simplified Model of TB Transmission.
We used differential equations to develop a simplified model of TB transmission, as shown in Figure 1. The differential equations used were:
- Susceptibles, S:
- Latently infected (recent), L1:
- Latently infected (remote), L2:
- Actively infected, A:
- Recovered, R:
For these equations, each capital letter represents the number of people in the compartment (per 100,000), and “dX/dt” denotes the change in compartment size X per unit time.
We used the following quantities:
birth = sum of all mortality (to maintain a stable population)
-
infection = (transmission rate)*A
The transmission rate is calibrated to give an annual steady-state TB incidence of 128 per 100,000/year, the global average.1
mortality = 1/70 (life expectancy of 70 years)
protection = 0.50 (50% efficacy against reinfection if latently infected or recovered)40, 42
progression = 0.03 per year (primary progression after recent infection)42
stabilization = 0.2 per year (“recent” infection period of 5 years)42
reactivation = 0.0005 per year (reactivation after remote infection)68
relapse = rate of relapse after recovery, calibrated such that 11% of incident TB is retreatment1 (final value = 0.0034/year)
treatment = rate of successful diagnosis and treatment, calibrated to give steady-state TB prevalence of 178 per 100,000, the global average1
self-cure = 0.167 per year (spontaneous recovery without treatment, 50% case-fatality103)
TB mortality = 0.167 per year (mortality rate of untreated TB)103
Reproduction Numbers and the TB Transmission Chain
As a framework for identifying target parameters, we used a key composite measure which governs the spread of a pathogen in a population: the basic reproduction number (R0). R0 is defined as “the average number of secondary [cases] produced when one [active case] is introduced into a host population where everyone is susceptible,”18 and it provides a threshold effectiveness of disease control needed to achieve elimination (i.e., R0 <1) For an endemic disease like TB where entirely uninfected populations are not encountered, the effective reproduction number Re describes the expected number of secondary cases generated by each infectious source case in an existing population. Both R0 and Re depend on three quantities: the average number of secondary infections caused per unit of infectious time, the source case’s duration of infectiousness, and the probability that a secondary infection will progress to active infectious TB. These quantities can be envisioned as processes in a TB transmission chain (Figure 2). Parameters that directly influence one of these three processes will modify the reproduction number and thereby affect TB transmission. We therefore classify parameters according to their effects on these three processes. We designed the model to be globally representative but also fit a low-incidence scenario (incidence 5 per 100,000/year) to evaluate differences based on underlying incidence. For each parameter, we describe the relevant process, detail existing data (and limitations) for informing its value, and quantify the degree to which changes in that value alter the parent model’s estimate of TB incidence (Figure 3).
Figure 2. The Effective Reproduction Number (Re) and the Transmission Chain of TB.
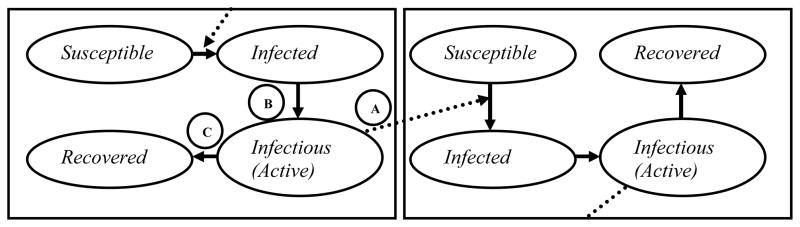
Each box represents a person in the TB transmission chain. Parameters that have the greatest influence on Re, and thus on projected TB incidence and mortality, in mathematical models typically affect either the rate of TB transmission per infectious person-year (A), probability of developing infectious TB (B), or duration of infectiousness (C).
Figure 3. Sensitivity and Uncertainty of Model Outcomes with Parameter Variation.

Bars represent the change in steady-state TB incidence in a simplified model of TB transmission (Figure 1) that would occur with specified increases (black bars) and decreases (white bars) in model parameters. The model is calibrated to globally representative TB incidence and prevalence rates (Box 1). Panel A shows sensitivity of the model to a one-way 25% change in each parameter value given in Box 1. Panel B shows corresponding changes in steady-state incidence when parameters are varied across a reasonable uncertainty range, as specified (100% reduction corresponds to Re<1 or eventual elimination, and rightward-pointing arrows denote changes greater than 150%). In both analyses, the 7 most influential parameters describe either the probability of progression to active TB, the rate of TB transmission per infectious person-year, or the duration of TB infectiousness. In a low-incidence scenario (incidence 5 per 100,000/year), the rate of endogenous reactivation was proportionally more important (ranked fourth in panel B), and the degree of protection afforded by latent infection was less important (ranked last), but other findings were similar. Within existing levels of uncertainty or heterogeneity, the TB transmission rate, probability of rapid progression, and diagnosis/treatment rate could each generate steady-state TB incidence rates across all reasonable values, demonstrating the importance of appropriately specifying these parameters in setting-specific models. The 2 least influential parameters describe non-TB mortality and relapse, and were not included in the “wish list” (Box 2).
ARTI, annual risk of TB infection; CDR, case detection rate (defined as the proportion of all patients with TB who are detected)
The TB Modeler’s “Wish List”
A. Parameters Affecting the Rate of Transmission per Infectious Person-Year (Figure 1, Process 1)
Description
The rate of TB transmission depends on the frequency of infectious contacts and probability of transmission during each contact event.19
Existing Approaches and Limitations
Classically, based on analysis of data from the Netherlands and India between 1920–1970, individuals with smear-positive TB were assumed to generate 8–12 secondary infections per year,20 and most models that fit TB incidence to transmission rates in high-burden settings have obtained similar results,21, 22 but more recent data suggest that this estimate may be 50% (or more) too high.23, 24 However, TB transmission is quite heterogeneous25: areas with hyperendemic transmission (e.g., South African townships26, 27) likely have per-case transmission rates over 10 times as high as in modern industrialized countries,28 though similar transmission rates were seen historically.29 Rates of TB transmission may also differ by strain16, 30, 31 and prevalence of social or other determinants of risk.32 The TB transmission rate is among the most important determinants of epidemic severity,33 and by extension, effectiveness of control interventions (e.g., active case finding, improved diagnostics) which aim to reduce the duration of transmission. Thus, appropriate estimation of TB transmission rates across different geographic settings and times is as critical as it is difficult.
Another important consideration is the rate of TB transmission at different times in an individual’s disease course. Largely because the primary existing diagnostic test (sputum smear microscopy) correlates with infectiousness, most TB models assume that transmission is constant over a given individual’s disease course. In other words, TB is assumed to be either infectious/smear-positive pulmonary or non-infectious,8 with some models incorporating smear-negative pulmonary TB at a lower infectiousness, usually 20–25% that of smear-positive TB (based on molecular epidemiology tracing of patients with known smear status34, 35). However, all smear-positive TB develops through a period of smear-negativity, and smear status is itself dependent on laboratory characteristics.36 If symptoms, infectiousness, health seeking behavior, and smear positivity (or ability to diagnose TB with other tests) all occur simultaneously, then passive smear microscopy is expected to have substantial impact on TB transmission. However, to the extent that TB transmission occurs before development of symptoms or sputum smear positivity, or cases remain persistently smear-negative, alternative diagnostic strategies (e.g., active case finding with culture or molecular methods) would be necessary to curb transmission.
B. Parameters Affecting the Probability of Progression to Active/Infectious TB
Rapid Progression (Figure 1, Process 2)
Description
Although it is undisputed that individuals can develop active TB many years after their initial infection, the physiology of latent TB infection (LTBI) remains a poorly-understood process at the cellular level, likely representing a spectrum of persistent immune responses.37, 38 The risk of progression to active infectious disease declines with time since infection, but since the pattern of this decline is not precisely known, TB models often simplify LTBI into a set of compartments based on time since infection. Since 1969, a cutoff of five years has frequently been used to distinguish “rapidly progressive” tuberculosis from “endogenous reactivation,”39–41 although other cutoffs may be equally reasonable from a biological perspective. Since rapid progression and endogenous reactivation are clinically similar, it is impossible to directly measure the proportion of incident TB that results from these two respective processes. Furthermore, since time of infection is generally unknown, it is likewise difficult to assess the time from infection to disease.
Existing Approaches and Limitations
Currently, we rely primarily on modeling studies that fit population-level data to the annual risk of TB infection over time in historical datasets (e.g., the Netherlands40,8 and England and Wales42), results from large population-based trials of interventions (e.g., BCG vaccine43), and molecular epidemiology studies that attempt to determine the proportion of incident TB that can be linked to other recent cases.44–46 These studies suggest that the risk of rapid TB progression is greater in adults than in children and declines over a period of 5 years after infection,42 with up to 45% of all disease occurring in the first year after infection.47 No study to our knowledge has comprehensively evaluated the risk of rapid progression after infection in modern high-burden settings, which may differ dramatically from historical cohorts48–50 in intensity of exposure, degree of natural protection against progressive disease in the host, and propensity of the pathogen to induce rapid progression.51, 52 Furthermore, these dynamics remain almost completely unspecified among people living with HIV, limited mostly to small outbreak investigations before the availability of antiretroviral therapy.19, 53–56 These studies suggest that 75% or more of TB infections progress rapidly to active disease among people living with HIV, but this proportion is likely much lower in individuals on antiretroviral therapy57 or with higher CD4 T-cell counts.56, 58 Other determinants of susceptibility,59 including diabetes mellitus,60, 61 nutritional status,62 and smoking,63 also affect progression from infection to active TB, although it remains unknown whether this is better modeled as a change in the proportion of individuals progressing rapidly after initial infection or the rate at which that progression occurs. These effects may have important implications for the effectiveness of TB control interventions such as isoniazid preventive therapy (IPT)64, 65 and contact investigation66 that depend on detecting TB infection before progression to active disease.
Endogenous Reactivation (Figure 1, Process 3)
Description
Individuals with latent TB infection remain at risk for reactivation for prolonged periods of time; TB models must incorporate a rate of progression to active TB that persists for extended periods from the time of infection.
Existing Approaches and Limitations
Compared to rates of progression from recent infection, rates of reactivation after remote infection are relatively well-characterized (through population-based studies where reinfection rates are low) and have less influence on model projections. Although estimates of the reactivation rate vary by almost an order of magnitude, from 0.0342 to 0.167 per 100 person-years, the most recent population-based estimate (0.05 per 100 person-years)68 falls in the middle of this range. However, far more important than the background rate of reactivation is the influence of other TB determinants32 on this rate. For example, while the rate of TB reactivation among people living with HIV – a primary driver of TB epidemics in HIV-endemic settings69 – is frequently quoted as 10% per year,28, 70, 71 many empiric studies have estimated a lower rate.72, 73 TB reactivation rates vary with degree of immunosuppression (e.g., CD4 count),58,74 and antiretroviral therapy dramatically reduces reactivation rates.19,74 The relative influence of other TB risk factors on reactivation and reinfection is even less well-characterized. Age is of particular importance; if reactivation rates increase with age,75–77 tuberculosis may become harder to eliminate as populations become older. Such considerations are also relevant when projecting the impact of interventions (e.g., IPT for HIV/TB-coinfected patients78) that differentially affect reactivation and recent infection.
Protection Afforded by Latent TB Infection
Description
Latent TB infection likely provides some protection against developing primary progressive TB after a subsequent infectious contact, whether by prevention of reinfection or prevention of disease progression after reinfection.
Existing Approaches and Limitations
The relative contributions of (“endogenous”) reactivation of remote latent infection versus (“exogenous”) reinfection in propagating TB epidemics have been discussed for decades79–81 and are have been investigated using numerous TB models.40, 42, 82 Reinfection with a second strain after remote infection with a first has been clearly demonstrated,83, 84 and multiple strains have even been found in the same sputum.85 The relative proportion of active TB among remotely-infected individuals caused by reinfection versus reactivation depends on the community risk of TB infection (which is often geographically heterogeneous.86) Thus, in areas with higher annual risk of TB infection, the contribution of reinfection is expected to be greater.87–89 However, this balance between reinfection and reactivation is also influenced by the degree of protection against progressive disease progression afforded by prior TB infection – a parameter value that is poorly understood.81 Estimates of this “protective efficacy” are based on modeling studies that fit historical European data to alternative assumptions about the effect of latent infection; estimated values range from 16%42 to 81%.40 A recent review using data from pre-isoniazid studies estimates this value at 79% (95% confidence interval, CI: 70–86%).90 Both the impact of HIV infection on this parameter value, and the mechanism of protection (i.e., prevention of reinfection versus prevention of rapid progression after reinfection42) are not completely understood. Protection afforded by infection with one TB strain against either reinfection or progressive disease with another affects the projected impact of IPT (which may be more effective if protection is high and long-lasting64) and vaccines (which seek to evoke similar immunologic phenomena16), as well as the rate of TB decline over time.91
C. Parameters Affecting Duration of Infectiousness (Figure 1, Process 4)
Care-Seeking, Diagnosis, and Successful Treatment
Description
Tuberculosis programs are often assessed in terms of the proportion of TB cases detected and successfully treated, with goals of 70% and 85%, respectively.92 These proportions depend on the overall rate of seeking care, appropriate diagnosis, and successful treatment.
Existing Approaches and Limitations
Since the number of incident TB cases (including undiagnosed cases) is not directly measurable, case detection is difficult to specify accurately.93, 94 More importantly, impact on TB transmission depends on the speed at which cases are detected and treated – detecting the same number of cases, but earlier in their infectious course, can dramatically reduce TB incidence,95, 96 However, the rate of detection and treatment depends on delays in diagnosis and treatment, which are difficult to measure and vary widely according to such factors as access to care and comorbid conditions.97 Unknown relationships between onset of symptoms and infectivity are also important considerations. For example, the impact of improved clinic-based diagnosis in areas where a substantial fraction of the population lacks any access to care98 will be smaller than in areas where most people with active TB do access care but whose diagnosis is missed or simply too late (as is suggested by autopsy studies in South Africa99–101). Furthermore, diagnostic sensitivity of existing algorithms may be the most important determinant of the incremental impact or cost-effectiveness of new diagnostics.102
Spontaneous Recovery
Description
A poorly-characterized, but often critical, parameter in TB models is the rate of spontaneous recovery or “self cure.” This parameter corresponds to a transition from active, infectious TB to a non-infectious, asymptomatic state in the absence of treatment.
Existing Approaches and Limitations
Studies from the pre-antibiotic era demonstrate that the 10-year case-fatality rate of untreated, smear-positive TB is about 70%, and of culture-positive smear-negative TB may have been as low as 20%.103 Thus, a substantial proportion of patients with active TB will not die, even in the absence of treatment. These individuals’ average duration of infectiousness has been estimated at 3 years103 but may be very heterogeneous, and the generalizability of this estimate to modern TB epidemics is unknown. Furthermore, most models assume that mortality, spontaneous recovery, and treatment operate as competing (and constant) rates. If diagnosis and treatment occur preferentially among those who would have otherwise recovered spontaneously, or toward the end of the infectious period in those who would have otherwise died, the impact of these interventions on TB mortality or transmission, respectively, may be blunted. Mortality continues between 5 and 10 years in these studies,103 suggesting the existence of “superspreaders”104 who remain persistently (or intermittently) infectious without experiencing spontaneous recovery. The relative importance of such “chronic” cases in modern TB epidemics requires further study.
TB Mortality
Description
Individuals with active TB who are not detected either die or recover spontaneously. Mortality rates of people with untreated active TB in modern epidemics remain uncertain.
Existing Approaches and Limitations
TB mortality rates are exceedingly high (i.e., in excess of 5% per month) early in the course of TB treatment105 and (among HIV/TB-coinfected patients) initiation of antiretroviral therapy,106 suggesting that mortality rates are not constant over time, but rather peak around the time of diagnosis and treatment initiation. Thus, reducing time to diagnosis by one or two months may have disproportionate impact on TB mortality. Mortality rates of untreated HIV/TB-coinfected patients are particularly poorly-characterized, as no data from the pre-antibiotic era exist to inform these estimates. Most empirical observations suggest a case-fatality ratio near 1.0,107, 108 but the duration of disease has not been measured. Prior analyses28 have used nosocomial outbreaks of MDR-TB109 to assume a disease duration of 0.5 years, whereas a combined incidence/prevalence survey of South African gold miners estimated this duration at 0.8 years (95% CI: 0.42–1.35),110 an estimate that is replicated in models fit to population-level mortality data.19, 22
TB Control Interventions
As described above, most TB models evaluate specific aspects of natural history or disease control; a single model is unlikely to be appropriate for answering all questions. Since a wide array of TB control interventions (e.g., improved diagnosis, shorter treatment courses, active case-finding, isoniazid preventive therapy, novel vaccines) are available or under development, and most TB models will not include all available interventions, we have not included specific TB control interventions on our “wish list” of parameters for TB models in general. However, it is important to recognize that, for any specific model of TB control, the parameters governing the modeled intervention(s) will be critical to the duration of infectiousness (or probability of progression, in the case of preventive therapy), and will thus have strong effects on R0 and projected incidence.
Discussion and Synthesis
We have used a simple model to enumerate and describe the influential assumptions universal to many TB models that incorporate similar structure. This process of designing a simplified model and using it to identify and compare the most influential parameters (shown in Figure 3) may serve as a paradigm for priority-setting in other infectious diseases as well. Combining this knowledge with an understanding of the gaps in the existing literature, we have created a “wish list” of 11 priority data elements that could inform the development of better infectious disease models for data-driven decision-making. We do not intend this as an exhaustive list. Specifically, we have not addressed structural model uncertainty or assumptions relevant to several other key issues (e.g., drug-resistant TB or HIV/TB), both of which need to be investigated more closely if TB models are to be optimized. Rather, we intend this “wish list” as a tool to inform a rational research agenda.
In deciding how to prioritize this agenda, consensus must be built around:
Defining which data elements to collect;
The relative importance to the model of specifying each element correctly (i.e., some parameters may have minimal influence on model output);
The generalizability of elements across diverse epidemiological conditions (e.g., specifying the natural history of TB – which may remain relatively consistent from one context to another – may be more important for global estimates than context-specific elements such as treatment success); and
The logistical difficulty, time, and resources required for adequate specification of each element.
This “wish list” (numbered below according to the designations provided in Box 2) speaks to the first two points. Upon developing this list and seeking to organize it further, three broad recommendations emerged:
Box 2. A TB Modeler’s “Wish List”: Data Needs for TB Transmission Models.
A. Rate of TB Transmission Per Infectious Person-Year (Process 1, Figure 1)
-
1
TB transmission rate in geographically diverse settings
Comprehensive population-based surveillance, description of geographic heterogeneity
-
2
TB transmission rate according to TB risk factors/social determinants
Understanding of key risk factors’ individual and joint effects on transmission of TB and acquisition of TB infection
-
3
TB transmission rate at different times during the TB disease course
Description of when, during an infectious individual’s disease course, transmission events occur – including development of an assay for recent TB transmission
B. Probability of Developing Active TB Following Infection
Rapid Progression (Process 2, Figure 1)
-
4
Rate of rapid progression in modern, high-burden settings
Extension of existing knowledge about progression rates in historical and low-burden settings to the epidemiology and microbiology typical of high-burden settings
-
5
Rate of rapid progression among people with TB risk factors/social determinants
Evaluation of progression rates according to HIV and other determinants of susceptibility (age, smoking, nutritional status, diabetes, alcohol, etc.)
Reactivation (Process 3, Figure 1)
-
6
Rate of reactivation among people with TB risk factors, particularly HIV and age
More complete characterization of the risk of progression to active TB, according to time since infection
-
7
Population-level correlation between prevalence of latent TB infection and TB risk factors
Description of the degree to which populations with high prevalence of TB risk factors also carry high prevalence of latent TB infection
Protection Afforded by Latent TB Infection
-
8
Degree of protection afforded by remote TB infection
Understanding of the mechanism of protection (i.e., prevention of reinfection, rapid progression, or reactivation)
C. Duration of Infectiousness (Process 4, Figure 1)
-
9
Care-seeking: relationship to infectiousness and heterogeneity across risk groups
Characterization of when, in the natural disease course, diagnosis is sought and treatment administered; understanding of how care-seeking patterns vary across populations
-
10
Diagnostic sensitivity and treatment success in geographically diverse settings
Description of actual and achievable speed and effectiveness in diagnosing infectious individuals and placing them on treatment
-
11
Rate (or probability) of spontaneous recovery in modern high-burden settings
Understanding the natural history of untreated TB in the post-chemotherapy era
1. Understanding Heterogeneity (“Wish List” Items 1, 4, 9, 10, 11)
We need to better understand heterogeneity: the diverse patterns of TB infection, progression, and diagnosis/treatment across both space and time. Many of our existing model assumptions derive from studies undertaken in the pre-chemotherapy era. While the underlying organism is the same, the settings in which M. tuberculosis causes human disease are dramatically different. Population-based prevalence surveys110–114 coupled with detailed care-seeking questionnaires and long-term individual follow-up of clinical outcomes in a variety of locations could provide data of tremendous value to future models. As existing TB prevalence surveys are carried out, additional data (e.g., household structure, geocoding, duration of symptoms) or samples (e.g., for molecular epidemiology) could be simultaneously collected that could greatly inform our understanding of TB dynamics, even in the absence of long-term follow-up.
2. Specifying Modulators of TB Disease (“Wish List” Items 2, 5, 6, 7, 9)
We also need to learn more about key modulators – including biological risk factors (e.g., HIV), social determinants (e.g., crowding), and latent infection (i.e., protective efficacy). This understanding should include both the strength of each association and the point(s) in the TB disease cycle (i.e., infection, progression, and/or transmission) at which each modulator acts. Furthermore, we should not limit our thinking about disease modulation to host factors; heterogeneity across different strains of M. tuberculosis (including drug-resistant strains) is also a key consideration.30, 115 In vitro and animal models can provide some insight into strain fitness and within-host dynamics. Population-based studies (e.g., prevalence surveys) that include prospective follow-up of close contacts to identified TB cases (e.g.,116, 117) may facilitate better understanding about the disease stage and strength at which each modulator exerts its primary effect.
3. Describing Time Courses of TB Progression and Transmission (“Wish List” Items 3, 8, 9, 11)
Third, we need to know when in patients’ disease course the burden of TB transmission occurs. The relationships between duration of disease, symptom burden, contact networks, diagnosis/treatment, and patients’ infectiousness remain obscure. Numerous studies have demonstrated that positive TB cultures can be obtained from asymptomatic individuals, particularly those with immune suppression,118, 119 and while most studies of diagnostic delay suggest that patients seek treatment within weeks to months of developing symptoms,97, 120 global estimates (based on the prevalence/incidence ratio) suggest an infectious period of more than one year.1 Since the TB transmission rate from a given individual depends not only on intrinsic infectiousness (e.g., bacillary burden) but also on the frequency of contacts and structure of transmission networks,82, 121 understanding how these vary over the infectious period is key. As individuals with active TB are identified in community-based prevalence surveys, assessing those individuals’ symptom duration and severity, patterns of seeking care, and infectiousness (either through contact investigation with molecular epidemiology or using experimental designs [e.g., guinea pig infection122, 123]) could be very informative. Ultimately, we are limited in our ability to characterize TB time courses by the fact that current diagnostics can only identify TB disease, not transmission events. Successful development of a diagnostic assay that could identify recent infection (or superinfection) would truly revolutionize our understanding of these complex interactions.
As with any priority-setting exercise, our approach has limitations. As mentioned above, in trying to capture data needs relevant to virtually all TB models in a simple framework, we ignore complexity that, while appropriately ignored by some transmission models, is nonetheless critical to TB control as a whole. Prime examples include HIV/TB coinfection and drug-resistant TB. We do not intend to suggest that these topic areas should be de-prioritized; rather, we argue that it is important to understand each of the above concepts (heterogeneity, modulators, and transmission timing) across different strata of immune suppression and TB drug resistance. In this analysis, we have focused on population-level (epidemiological) models of TB; similar models of within-host dynamics (e.g., 124) also play an important role in our understanding of TB and may provide additional insights. We acknowledge that our broad-based approach using a simple model may not appropriately capture priorities for unique epidemiological situations (e.g., Eastern European prisons125). Finally, our “wish list” is admittedly long and does not seek to rank-order items within the list; we intend this exercise as a method for bringing modeling concerns into a broader discussion of research priorities, rather than for suggesting that specific parameters should be prioritized based only on their potential influence over model outputs.
Conclusion
Infectious disease models simplify complex dynamics to inform decision-making when data on population-level effects are otherwise unavailable. If we are to create models that are appropriate and accurate enough to answer the specific questions that will be most pressing to TB decision-makers, future studies that increase our knowledge of (1) heterogeneity in TB dynamics across space and time, (2) modulators of TB natural history, and (3) the timing of secondary infections from source cases will be particularly important. Success in the fight against TB depends on the quality of our decisions about which interventions to implement, and how to implement them – and models are essential tools in that decision-making process. By targeting research to better inform those models’ assumptions, we can ensure that future decisions result in better health not just for individual patients, but for populations as a whole.
References
- 1.World Health Organization. Global tuberculosis control: WHO Report 2011. Geneva: WHO Press; 2011. [Google Scholar]
- 2.Lienhardt C, Espinal M, Pai M, Maher D, Raviglione MC. What research is needed to stop TB? introducing the TB research movement. PLoS Med. 2011;8(11):e1001135. doi: 10.1371/journal.pmed.1001135. [DOI] [PMC free article] [PubMed] [Google Scholar]
- 3.Rylance J, Pai M, Lienhardt C, Garner P. Priorities for tuberculosis research: A systematic review. Lancet Infect Dis. 2010;10(12):886–892. doi: 10.1016/S1473-3099(10)70201-2. [DOI] [PMC free article] [PubMed] [Google Scholar]
- 4.Garnett GP, Cousens S, Hallett TB, Steketee R, Walker N. Mathematical models in the evaluation of health programmes. The Lancet. 2011;378(9790):515–525. doi: 10.1016/S0140-6736(10)61505-X. [DOI] [PubMed] [Google Scholar]
- 5.Waaler HT, Piot MA. The use of an epidemiological model for estimating the effectiveness of tuberculosis control measures. sensitivity of the effectiveness of tuberculosis control measures to the coverage of the population. Bull World Health Organ. 1969;41(1):75–93. [PMC free article] [PubMed] [Google Scholar]
- 6.Brogger S. Systems analysis in tuberculosis control: A model. Am Rev Respir Dis. 1967;95(3):419–434. doi: 10.1164/arrd.1967.95.3.419. [DOI] [PubMed] [Google Scholar]
- 7.Styblo K. Progress report from the tuberculosis surveillance research unit. Bull Int Union Tuberc. 1968;41:255–264. [PubMed] [Google Scholar]
- 8.Dye C, Garnett GP, Sleeman K, Williams BG. Prospects for worldwide tuberculosis control under the WHO DOTS strategy. Lancet. 1998;352(9144):1886–1891. doi: 10.1016/s0140-6736(98)03199-7. [DOI] [PubMed] [Google Scholar]
- 9.Abu-Raddad LJ, Sabatelli L, Achterberg JT, et al. Epidemiological benefits of more-effective tuberculosis vaccines, drugs, and diagnostics. Proc Natl Acad Sci U S A. 2009;106(33):13980–13985. doi: 10.1073/pnas.0901720106. [DOI] [PMC free article] [PubMed] [Google Scholar]
- 10.Sanchez MA, Blower SM. Uncertainty and sensitivity analysis of the basic reproductive rate. tuberculosis as an example. Am J Epidemiol. 1997;145(12):1127–1137. doi: 10.1093/oxfordjournals.aje.a009076. [DOI] [PubMed] [Google Scholar]
- 11.Vynnycky E, White R. An introduction to infectious disease modelling. Oxford: Oxford University Press; 2010. [Google Scholar]
- 12.Mills HL, Cohen T, Colijn C. Modelling the performance of isoniazid preventive therapy for reducing tuberculosis in HIV endemic settings: The effects of network structure. J R Soc Interface. 2011;8(63):1510–1520. doi: 10.1098/rsif.2011.0160. [DOI] [PMC free article] [PubMed] [Google Scholar]
- 13.May RM. Uses and abuses of mathematics in biology. Science. 2004;303(5659):790–793. doi: 10.1126/science.1094442. [DOI] [PubMed] [Google Scholar]
- 14.Choi YH, Jit M, Gay N, Cox A, Garnett GP, Edmunds WJ. Transmission dynamic modelling of the impact of human papillomavirus vaccination in the United Kingdom. Vaccine. 2010;28(24):4091–4102. doi: 10.1016/j.vaccine.2009.09.125. [DOI] [PubMed] [Google Scholar]
- 15.Foss AM, Vickerman PT, Chalabi Z, Mayaud P, Alary M, Watts CH. Dynamic modeling of herpes simplex virus type-2 (HSV-2) transmission: Issues in structural uncertainty. Bull Math Biol. 2009;71(3):720–749. doi: 10.1007/s11538-008-9379-1. [DOI] [PubMed] [Google Scholar]
- 16.Cohen T, Colijn C, Murray M. Modeling the effects of strain diversity and mechanisms of strain competition on the potential performance of new tuberculosis vaccines. Proc Natl Acad Sci U S A. 2008;105(42):16302–16307. doi: 10.1073/pnas.0808746105. [DOI] [PMC free article] [PubMed] [Google Scholar]
- 17.Heckerman D. A tutorial on learning with bayesian networks. In: Holmes DE, Jain LC, editors. Innovations in Bayesian Networks. Berlin: Springer-Verlag; 2008. pp. 33–82. [Google Scholar]
- 18.Anderson RM, May RM. Infectious Diseases of Humans: Dynamics and Control. New York: Oxford University Press; 1991. [Google Scholar]
- 19.Williams BG, Granich R, De Cock KM, Glaziou P, Sharma A, Dye C. Antiretroviral therapy for tuberculosis control in nine African countries. Proc Natl Acad Sci U S A. 2010;107(45):19485–19489. doi: 10.1073/pnas.1005660107. [DOI] [PMC free article] [PubMed] [Google Scholar]
- 20.Styblo K. The relationship between the risk of tuberculosis infection and the risk of developing infectious tuberculosis. Bull Int Union Tuberc Lung Dis. 1985;60:117–119. [Google Scholar]
- 21.Dye C, Williams BG. Slow elimination of multidrug-resistant tuberculosis. Sci Transl Med. 2009;1(3):3ra8. doi: 10.1126/scitranslmed.3000346. [DOI] [PubMed] [Google Scholar]
- 22.Dowdy DW, Chaisson RE, Maartens G, Corbett EL, Dorman SE. Impact of enhanced tuberculosis diagnosis in South Africa: A mathematical model of expanded culture and drug susceptibility testing. Proc Natl Acad Sci U S A. 2008;105(32):11293–11298. doi: 10.1073/pnas.0800965105. [DOI] [PMC free article] [PubMed] [Google Scholar]
- 23.van Leth F, van der Werf MJ, Borgdorff MW. Prevalence of tuberculous infection and incidence of tuberculosis: A re-assessment of the Styblo rule. Bull World Health Organ. 2008;86(1):20–26. doi: 10.2471/BLT.06.037804. [DOI] [PMC free article] [PubMed] [Google Scholar]
- 24.Trunz BB, Fine P, Dye C. Effect of BCG vaccination on childhood tuberculous meningitis and miliary tuberculosis worldwide: A meta-analysis and assessment of cost-effectiveness. Lancet. 2006;367(9517):1173–1180. doi: 10.1016/S0140-6736(06)68507-3. [DOI] [PubMed] [Google Scholar]
- 25.Murphy BM, Singer BH, Anderson S, Kirschner D. Comparing epidemic tuberculosis in demographically distinct heterogeneous populations. Math Biosci. 2002;180:161–185. doi: 10.1016/s0025-5564(02)00133-5. [DOI] [PubMed] [Google Scholar]
- 26.Bacaer N, Ouifki R, Pretorius C, Wood R, Williams B. Modeling the joint epidemics of TB and HIV in a South African township. J Math Biol. 2008;57(4):557–593. doi: 10.1007/s00285-008-0177-z. [DOI] [PubMed] [Google Scholar]
- 27.Verver S, Warren RM, Munch Z, et al. Transmission of tuberculosis in a high incidence urban community in South Africa. Int J Epidemiol. 2004;33(2):351–357. doi: 10.1093/ije/dyh021. [DOI] [PubMed] [Google Scholar]
- 28.Corbett EL, Watt CJ, Walker N, et al. The growing burden of tuberculosis: Global trends and interactions with the HIV epidemic. Arch Intern Med. 2003;163(9):1009–1021. doi: 10.1001/archinte.163.9.1009. [DOI] [PubMed] [Google Scholar]
- 29.Sutherland I, Styblo K, Sampalik M, Bleiker MA. Annual risks of tuberculosis infection in 14 countries according to the results of tuberculosis surveys from 1948 to 1952. Bull Int Union Tuberc. 1971;45:80–122. [PubMed] [Google Scholar]
- 30.O’Sullivan DM, McHugh TD, Gillespie SH. Mapping the fitness of Mycobacterium tuberculosis strains: A complex picture. J Med Microbiol. 2010;59(Pt 12):1533–1535. doi: 10.1099/jmm.0.019091-0. [DOI] [PubMed] [Google Scholar]
- 31.Glynn JR, Crampin AC, Traore H, et al. Determinants of cluster size in large, population-based molecular epidemiology study of tuberculosis, northern Malawi. Emerg Infect Dis. 2008;14(7):1060–1066. doi: 10.3201/eid1407.060468. [DOI] [PMC free article] [PubMed] [Google Scholar]
- 32.Lonnroth K, Jaramillo E, Williams BG, Dye C, Raviglione M. Drivers of tuberculosis epidemics: The role of risk factors and social determinants. Soc Sci Med. 2009;68(12):2240–2246. doi: 10.1016/j.socscimed.2009.03.041. [DOI] [PubMed] [Google Scholar]
- 33.Porco TC, Blower SM. Quantifying the intrinsic transmission dynamics of tuberculosis. Theor Popul Biol. 1998;54(2):117–132. doi: 10.1006/tpbi.1998.1366. [DOI] [PubMed] [Google Scholar]
- 34.Behr MA, Warren SA, Salamon H, et al. Transmission of mycobacterium tuberculosis from patients smear-negative for acid-fast bacilli. Lancet. 1999;353(9151):444–449. doi: 10.1016/s0140-6736(98)03406-0. [DOI] [PubMed] [Google Scholar]
- 35.Tostmann A, Kik SV, Kalisvaart NA, et al. Tuberculosis transmission by patients with smear-negative pulmonary tuberculosis in a large cohort in the Netherlands. Clin Infect Dis. 2008;47(9):1135–1142. doi: 10.1086/591974. [DOI] [PubMed] [Google Scholar]
- 36.Martinez A, Balandrano S, Parissi A, et al. Evaluation of new external quality assessment guidelines involving random blinded rechecking of acid-fast bacilli smears in a pilot project setting in Mexico. Int J Tuberc Lung Dis. 2005;9(3):301–305. [PubMed] [Google Scholar]
- 37.Barry CE, 3rd, Boshoff HI, Dartois V, et al. The spectrum of latent tuberculosis: Rethinking the biology and intervention strategies. Nat Rev Microbiol. 2009;7(12):845–855. doi: 10.1038/nrmicro2236. [DOI] [PMC free article] [PubMed] [Google Scholar]
- 38.Mack U, Migliori GB, Sester M, et al. LTBI: Latent tuberculosis infection or lasting immune responses to M. tuberculosis? A TBNET consensus statement. Eur Respir J. 2009;33(5):956–973. doi: 10.1183/09031936.00120908. [DOI] [PubMed] [Google Scholar]
- 39.Holm J. TSRU progress report. The Hague, The Netherlands: Royal Netherlands Tuberculosis Association; 1969. Development from tuberculosis infection to tuberculosis disease. [Google Scholar]
- 40.Sutherland I, Svandová E, Radhakrishna S. The development of clinical tuberculosis following infection with tubercle bacilli:: 1. A theoretical model for the development of clinical tuberculosis following infection, linking from data on the risk of tuberculous infection and the incidence of clinical tuberculosis in the Netherlands. Tubercle. 1982;63(4):255–268. doi: 10.1016/s0041-3879(82)80013-5. [DOI] [PubMed] [Google Scholar]
- 41.Stead WW, Kerby GR, Schlueter DP, Jordahl CW. The clinical spectrum of primary tuberculosis in adults. confusion with reinfection in the pathogenesis of chronic tuberculosis. Ann Intern Med. 1968;68(4):731–745. doi: 10.7326/0003-4819-68-4-731. [DOI] [PubMed] [Google Scholar]
- 42.Vynnycky E, Fine PEM. The natural history of tuberculosis: The implications of age-dependent risks of disease and the role of reinfection. Epidemiol Infect. 1997;119(02):183–201. doi: 10.1017/s0950268897007917. [DOI] [PMC free article] [PubMed] [Google Scholar]
- 43.Comstock GW. Frost revisited: The modern epidemiology of tuberculosis: The third Wade Hampton Frost lecture. Am J Epidemiol. 2008;168(7):692–711. doi: 10.1093/aje/kwn268. [DOI] [PubMed] [Google Scholar]
- 44.Barnes PF, Cave MD. Molecular epidemiology of tuberculosis. N Engl J Med. 2003;349(12):1149–1156. doi: 10.1056/NEJMra021964. [DOI] [PubMed] [Google Scholar]
- 45.Godfrey-Faussett P, Sonnenberg P, Shearer SC, et al. Tuberculosis control and molecular epidemiology in a South African gold-mining community. Lancet. 2000;356(9235):1066–1071. doi: 10.1016/s0140-6736(00)02730-6. [DOI] [PubMed] [Google Scholar]
- 46.Vynnycky E, Nagelkerke N, Borgdorff MW, van Soolingen D, van Embden JD, Fine PE. The effect of age and study duration on the relationship between ‘clustering’ of DNA fingerprint patterns and the proportion of tuberculosis disease attributable to recent transmission. Epidemiol Infect. 2001;126(1):43–62. [PMC free article] [PubMed] [Google Scholar]
- 47.Borgdorff MW, Sebek M, Geskus RB, Kremer K, Kalisvaart N, van Soolingen D. The incubation period distribution of tuberculosis estimated with a molecular epidemiological approach. Int J Epidemiol. 2011;40(4):964–970. doi: 10.1093/ije/dyr058. [DOI] [PubMed] [Google Scholar]
- 48.Comstock GW, Baum C, Snider DE., Jr Isoniazid prophylaxis among Alaskan Eskimos: A final report of the Bethel isoniazid studies. Am Rev Respir Dis. 1979;119(5):827–830. doi: 10.1164/arrd.1979.119.5.827. [DOI] [PubMed] [Google Scholar]
- 49.Horwitz O. Long-term results of the chemoprophylactic trial in Greenland. Bull Int Union Tuberc. 1968;41:167–168. [PubMed] [Google Scholar]
- 50.Sutherland I. 2550 Individuals Aged 14 to 19 Years. TSRU Progress Report. The Hague, Netherlands: KNCV; 1968. The Ten-Year Incidence of Clinical Tuberculosis Following “conversion”. [Google Scholar]
- 51.Basu S, Galvani AP. The evolution of tuberculosis virulence. Bull Math Biol. 2009;71(5):1073–1088. doi: 10.1007/s11538-009-9394-x. [DOI] [PubMed] [Google Scholar]
- 52.Cohen T, Murray M. Modeling epidemics of multidrug-resistant M. tuberculosis of heterogeneous fitness. Nat Med. 2004;10(10):1117–1121. doi: 10.1038/nm1110. [DOI] [PMC free article] [PubMed] [Google Scholar]
- 53.Daley CL, Small PM, Schecter GF, et al. An outbreak of tuberculosis with accelerated progression among persons infected with the human immunodeficiency virus. an analysis using restriction-fragment-length polymorphisms. N Engl J Med. 1992;326(4):231–235. doi: 10.1056/NEJM199201233260404. [DOI] [PubMed] [Google Scholar]
- 54.Di Perri G, Cruciani M, Danzi MC, et al. Nosocomial epidemic of active tuberculosis among HIV-infected patients. Lancet. 1989;2(8678–8679):1502–1504. [PubMed] [Google Scholar]
- 55.Williams BG, Dye C. Antiretroviral drugs for tuberculosis control in the era of HIV/AIDS. Science. 2003;301(5639):1535–1537. doi: 10.1126/science.1086845. [DOI] [PubMed] [Google Scholar]
- 56.Lawn SD, Myer L, Edwards D, Bekker LG, Wood R. Short-term and long-term risk of tuberculosis associated with CD4 cell recovery during antiretroviral therapy in South Africa. AIDS. 2009;23(13):1717–1725. doi: 10.1097/QAD.0b013e32832d3b6d. [DOI] [PMC free article] [PubMed] [Google Scholar]
- 57.Golub JE, Durovni B, King BS, et al. Recurrent tuberculosis in HIV-infected patients in Rio de Janeiro, Brazil. AIDS. 2008;22(18):2527–2533. doi: 10.1097/QAD.0b013e328311ac4e. [DOI] [PMC free article] [PubMed] [Google Scholar]
- 58.Holmes CB, Wood R, Badri M, et al. CD4 decline and incidence of opportunistic infections in Cape Town, South Africa: Implications for prophylaxis and treatment. J Acquir Immune Defic Syndr. 2006;42(4):464–469. doi: 10.1097/01.qai.0000225729.79610.b7. [DOI] [PubMed] [Google Scholar]
- 59.Murray M, Oxlade O, Lin HH. Modeling social, environmental and biological determinants of tuberculosis. Int J Tuberc Lung Dis. 2011;15 (Suppl 2):S64–70. doi: 10.5588/ijtld.10.0535. [DOI] [PubMed] [Google Scholar]
- 60.Jeon CY, Murray MB. Diabetes mellitus increases the risk of active tuberculosis: A systematic review of 13 observational studies. PLoS Med. 2008;5(7):e152. doi: 10.1371/journal.pmed.0050152. [DOI] [PMC free article] [PubMed] [Google Scholar]
- 61.Dooley KE, Chaisson RE. Tuberculosis and diabetes mellitus: Convergence of two epidemics. Lancet Infect Dis. 2009;9(12):737–746. doi: 10.1016/S1473-3099(09)70282-8. [DOI] [PMC free article] [PubMed] [Google Scholar]
- 62.Cegielski JP, McMurray DN. The relationship between malnutrition and tuberculosis: Evidence from studies in humans and experimental animals. Int J Tuberc Lung Dis. 2004;8(3):286–298. [PubMed] [Google Scholar]
- 63.Lin HH, Ezzati M, Murray M. Tobacco smoke, indoor air pollution and tuberculosis: A systematic review and meta-analysis. PLoS Med. 2007;4(1):e20. doi: 10.1371/journal.pmed.0040020. [DOI] [PMC free article] [PubMed] [Google Scholar]
- 64.Cohen T, Lipsitch M, Walensky RP, Murray M. Beneficial and perverse effects of isoniazid preventive therapy for latent tuberculosis infection in HIV–tuberculosis coinfected populations. Proc Natl Acad Sci U S A. 2006;103(18):7042–7047. doi: 10.1073/pnas.0600349103. [DOI] [PMC free article] [PubMed] [Google Scholar]
- 65.Samandari T, Agizew TB, Nyirenda S, et al. 6-month versus 36-month isoniazid preventive treatment for tuberculosis in adults with HIV infection in Botswana: A randomised, double-blind, placebo-controlled trial. Lancet. 2011;377(9777):1588–1598. doi: 10.1016/S0140-6736(11)60204-3. [DOI] [PubMed] [Google Scholar]
- 66.Hwang TJ, Ottmani S, Uplekar M. A rapid assessment of prevailing policies on tuberculosis contact investigation. Int J Tuberc Lung Dis. 2011;15(12):1620–1623. doi: 10.5588/ijtld.11.0222. [DOI] [PubMed] [Google Scholar]
- 67.Ferebee SH. Controlled chemoprophylaxis trials in tuberculosis. A general review. Bibl Tuberc. 1970;26:28–106. [PubMed] [Google Scholar]
- 68.Horsburgh CR, Jr, O’Donnell M, Chamblee S, et al. Revisiting rates of reactivation tuberculosis: A population-based approach. Am J Respir Crit Care Med. 2010;182(3):420–425. doi: 10.1164/rccm.200909-1355OC. [DOI] [PMC free article] [PubMed] [Google Scholar]
- 69.Roeger LI, Feng Z, Castillo-Chavez C. Modeling TB and HIV co-infections. Math Biosci Eng. 2009;6(4):815–837. doi: 10.3934/mbe.2009.6.815. [DOI] [PubMed] [Google Scholar]
- 70.Rieder HL. Epidemiologic basis of tuberculosis control. Paris: International Union against Tuberculosis and Lung Disease; 1999. [Google Scholar]
- 71.Bucher HC, Griffith LE, Guyatt GH, et al. Isoniazid prophylaxis for tuberculosis in HIV infection: A meta-analysis of randomized controlled trials. AIDS. 1999;13(4):501–507. doi: 10.1097/00002030-199903110-00009. [DOI] [PubMed] [Google Scholar]
- 72.Antonucci G, Girardi E, Raviglione MC, Ippolito G. Risk factors for tuberculosis in HIV-infected persons. A prospective cohort study. the Gruppo Italiano di Studio Tubercolosi e AIDS (GISTA) JAMA. 1995;274(2):143–148. doi: 10.1001/jama.274.2.143. [DOI] [PubMed] [Google Scholar]
- 73.Badri M, Wilson D, Wood R. Effect of highly active antiretroviral therapy on incidence of tuberculosis in South Africa: A cohort study. Lancet. 2002;359(9323):2059–2064. doi: 10.1016/S0140-6736(02)08904-3. [DOI] [PubMed] [Google Scholar]
- 74.Granich R, Gupta S, Suthar AB, et al. Antiretroviral therapy in prevention of HIV and TB: Update on current research efforts. Curr HIV Res. 2011;9(6):446–469. doi: 10.2174/157016211798038597. [DOI] [PMC free article] [PubMed] [Google Scholar]
- 75.Vynnycky E, Borgdorff MW, Leung CC, Tam CM, Fine PE. Limited impact of tuberculosis control in Hong Kong: Attributable to high risks of reactivation disease. Epidemiol Infect. 2008;136(7):943–952. doi: 10.1017/S0950268807008552. [DOI] [PMC free article] [PubMed] [Google Scholar]
- 76.Ricks PM, Cain KP, Oeltmann JE, Kammerer JS, Moonan PK. Estimating the burden of tuberculosis among foreign-born persons acquired prior to entering the U.S., 2005–2009. PLoS One. 2011;6(11):e27405. doi: 10.1371/journal.pone.0027405. [DOI] [PMC free article] [PubMed] [Google Scholar]
- 77.Zuber PL, McKenna MT, Binkin NJ, Onorato IM, Castro KG. Long-term risk of tuberculosis among foreign-born persons in the United States. JAMA. 1997;278(4):304–307. [PubMed] [Google Scholar]
- 78.WHO Department of HIV/AIDS, Stop TB Department. Guidelines for intensified tuberculosis case-finding and isoniazid preventive therapy for people living with HIV in resource-constrained settings. Geneva: World Health Organization; 2011. [Google Scholar]
- 79.Stead WW. Pathogenesis of a first episode of chronic pulmonary tuberculosis in man: Recrudescence of residuals of the primary infection or exogenous reinfection? Am Rev Respir Dis. 1967;95(5):729–745. doi: 10.1164/arrd.1967.95.5.729. [DOI] [PubMed] [Google Scholar]
- 80.Romeyn JA. Exogenous reinfection in tuberculosis. Am Rev Respir Dis. 1970;101(6):923–927. doi: 10.1164/arrd.1970.101.6.923. [DOI] [PubMed] [Google Scholar]
- 81.Chiang CY, Riley LW. Exogenous reinfection in tuberculosis. Lancet Infect Dis. 2005;5(10):629–636. doi: 10.1016/S1473-3099(05)70240-1. [DOI] [PubMed] [Google Scholar]
- 82.Cohen T, Colijn C, Finklea B, Murray M. Exogenous re-infection and the dynamics of tuberculosis epidemics: Local effects in a network model of transmission. J R Soc Interface. 2007;4(14):523–531. doi: 10.1098/rsif.2006.0193. [DOI] [PMC free article] [PubMed] [Google Scholar]
- 83.Caminero JA, Pena MJ, Campos-Herrero MI, et al. Exogenous reinfection with tuberculosis on a European island with a moderate incidence of disease. Am J Respir Crit Care Med. 2001;163(3 Pt 1):717–720. doi: 10.1164/ajrccm.163.3.2003070. [DOI] [PubMed] [Google Scholar]
- 84.van Rie A, Warren R, Richardson M, et al. Exogenous reinfection as a cause of recurrent tuberculosis after curative treatment. N Engl J Med. 1999;341(16):1174–1179. doi: 10.1056/NEJM199910143411602. [DOI] [PubMed] [Google Scholar]
- 85.Warren RM, Victor TC, Streicher EM, et al. Patients with active tuberculosis often have different strains in the same sputum specimen. Am J Respir Crit Care Med. 2004;169(5):610–614. doi: 10.1164/rccm.200305-714OC. [DOI] [PubMed] [Google Scholar]
- 86.Colijn C, Cohen T, Murray M. Emergent heterogeneity in declining tuberculosis epidemics. J Theor Biol. 2007;247(4):765–774. doi: 10.1016/j.jtbi.2007.04.015. [DOI] [PMC free article] [PubMed] [Google Scholar]
- 87.Nardell E, Churchyard G. What is thwarting tuberculosis prevention in high-burden settings? N Engl J Med. 2011;365(1):79–81. doi: 10.1056/NEJMe1105555. [DOI] [PubMed] [Google Scholar]
- 88.Uys PW, van Helden PD, Hargrove JW. Tuberculosis reinfection rate as a proportion of total infection rate correlates with the logarithm of the incidence rate: A mathematical model. J R Soc Interface. 2009;6(30):11–15. doi: 10.1098/rsif.2008.0184. [DOI] [PMC free article] [PubMed] [Google Scholar]
- 89.Verver S, Warren RM, Beyers N, et al. Rate of reinfection tuberculosis after successful treatment is higher than rate of new tuberculosis. Am J Respir Crit Care Med. 2005;171(12):1430–1435. doi: 10.1164/rccm.200409-1200OC. [DOI] [PubMed] [Google Scholar]
- 90.Andrews JR, Noubary F, Walensky RP, Cerda R, Losina E, Horsburgh CR. Risk of progression to active tuberculosis following reinfection with Mycobacterium tuberculosis. Clin Infect Dis. 2012;54(6):784–91. doi: 10.1093/cid/cir951. [DOI] [PMC free article] [PubMed] [Google Scholar]
- 91.Dye C, Lonnroth K, Jaramillo E, Williams BG, Raviglione M. Trends in tuberculosis incidence and their determinants in 134 countries. Bull World Health Organ. 2009;87(9):683–691. doi: 10.2471/BLT.08.058453. [DOI] [PMC free article] [PubMed] [Google Scholar]
- 92.Dye C, Hosseini M, Watt C. Did we reach the 2005 targets for tuberculosis control? Bull World Health Organ. 2007;85(5):364–369. doi: 10.2471/06.037580. [DOI] [PMC free article] [PubMed] [Google Scholar]
- 93.Bassili A, Grant AD, El-Mohgazy E, et al. Estimating tuberculosis case detection rate in resource-limited countries: A capture-recapture study in egypt. Int J Tuberc Lung Dis. 2010;14(6):727–732. [PubMed] [Google Scholar]
- 94.Dunbar R, van Hest R, Lawrence K, et al. Capture-recapture to estimate completeness of tuberculosis surveillance in two communities in South Africa. Int J Tuberc Lung Dis. 2011;15(8):1038–1043. doi: 10.5588/ijtld.10.0695. [DOI] [PubMed] [Google Scholar]
- 95.Blower SM, McLean AR, Porco TC, et al. The intrinsic transmission dynamics of tuberculosis epidemics. Nat Med. 1995;1(8):815–821. doi: 10.1038/nm0895-815. [DOI] [PubMed] [Google Scholar]
- 96.Blower SM, Small PM, Hopewell PC. Control strategies for tuberculosis epidemics: New models for old problems. Science. 1996;273(5274):497–500. doi: 10.1126/science.273.5274.497. [DOI] [PubMed] [Google Scholar]
- 97.Storla DG, Yimer S, Bjune GA. A systematic review of delay in the diagnosis and treatment of tuberculosis. BMC Public Health. 2008;8:15. doi: 10.1186/1471-2458-8-15. [DOI] [PMC free article] [PubMed] [Google Scholar]
- 98.Dowdy DW, Chaisson RE, Moulton LH, Dorman SE. The potential impact of enhanced diagnostic techniques for tuberculosis driven by HIV: A mathematical model. AIDS. 2006;20(5):751–762. doi: 10.1097/01.aids.0000216376.07185.cc. [DOI] [PubMed] [Google Scholar]
- 99.Field N, Murray J, Wong ML, et al. Missed opportunities in TB diagnosis: A TB process-based performance review tool to evaluate and improve clinical care. BMC Public Health. 2011;11:127. doi: 10.1186/1471-2458-11-127. [DOI] [PMC free article] [PubMed] [Google Scholar]
- 100.Cohen T, Murray M, Wallengren K, Alvarez GG, Samuel EY, Wilson D. The prevalence and drug sensitivity of tuberculosis among patients dying in hospital in KwaZulu-Natal, South Africa: A postmortem study. PLoS Med. 2010;7(6):e1000296. doi: 10.1371/journal.pmed.1000296. [DOI] [PMC free article] [PubMed] [Google Scholar]
- 101.Pronyk PM, Kahn K, Hargreaves JR, et al. Undiagnosed pulmonary tuberculosis deaths in rural South Africa. Int J Tuberc Lung Dis. 2004;8(6):796–799. [PubMed] [Google Scholar]
- 102.Dowdy DW, OBrien MA, Bishai D. Cost-effectiveness of novel diagnostic tools for the diagnosis of tuberculosis. Int J Tuberc Lung Dis. 2008;12(9):1021–1029. [PubMed] [Google Scholar]
- 103.Tiemersma EW, van der Werf MJ, Borgdorff MW, Williams BG, Nagelkerke NJ. Natural history of tuberculosis: Duration and fatality of untreated pulmonary tuberculosis in HIV negative patients: A systematic review. PLoS One. 2011;6(4):e17601. doi: 10.1371/journal.pone.0017601. [DOI] [PMC free article] [PubMed] [Google Scholar]
- 104.Gardy JL, Johnston JC, Ho Sui SJ, et al. Whole-genome sequencing and social-network analysis of a tuberculosis outbreak. N Engl J Med. 2011;364(8):730–739. doi: 10.1056/NEJMoa1003176. [DOI] [PubMed] [Google Scholar]
- 105.Harries AD, Hargreaves NJ, Gausi F, Kwanjana JH, Salaniponi FM. High early death rate in tuberculosis patients in Malawi. Int J Tuberc Lung Dis. 2001;5(11):1000–1005. [PubMed] [Google Scholar]
- 106.Lawn SD, Harries AD, Anglaret X, Myer L, Wood R. Early mortality among adults accessing antiretroviral treatment programmes in sub-Saharan Africa. AIDS. 2008;22(15):1897–1908. doi: 10.1097/QAD.0b013e32830007cd. [DOI] [PMC free article] [PubMed] [Google Scholar]
- 107.Pablos-Mendez A, Sterling TR, Frieden TR. The relationship between delayed or incomplete treatment and all-cause mortality in patients with tuberculosis. JAMA. 1996;276(15):1223–1228. doi: 10.1001/jama.1996.03540150025026. [DOI] [PubMed] [Google Scholar]
- 108.Frieden TR, Sherman LF, Maw KL, et al. A multi-institutional outbreak of highly drug-resistant tuberculosis: Epidemiology and clinical outcomes. JAMA. 1996;276(15):1229–1235. [PubMed] [Google Scholar]
- 109.Centers for Disease Control (CDC) Nosocomial transmission of multidrug-resistant tuberculosis among HIV-infected persons--Florida and New York, 1988–1991. MMWR Morb Mortal Wkly Rep. 1991;40(34):585–591. [PubMed] [Google Scholar]
- 110.Corbett EL, Charalambous S, Moloi VM, et al. Human immunodeficiency virus and the prevalence of undiagnosed tuberculosis in African gold miners. Am J Respir Crit Care Med. 2004;170(6):673–679. doi: 10.1164/rccm.200405-590OC. [DOI] [PubMed] [Google Scholar]
- 111.Corbett EL, Bandason T, Duong T, et al. Comparison of two active case-finding strategies for community-based diagnosis of symptomatic smear-positive tuberculosis and control of infectious tuberculosis in Harare, Zimbabwe (DETECTB): A cluster-randomised trial. Lancet. 2010;376(9748):1244–1253. doi: 10.1016/S0140-6736(10)61425-0. [DOI] [PMC free article] [PubMed] [Google Scholar]
- 112.Ayles H, Schaap A, Nota A, et al. Prevalence of tuberculosis, HIV and respiratory symptoms in two Zambian communities: Implications for tuberculosis control in the era of HIV. PLoS ONE. 2009;4(5):e5602. doi: 10.1371/journal.pone.0005602. [DOI] [PMC free article] [PubMed] [Google Scholar]
- 113.Tupasi TE, Radhakrishna S, Chua JA, et al. Significant decline in the tuberculosis burden in the Philippines ten years after initiating DOTS. Int J Tuberc Lung Dis. 2009;13(10):1224–1230. [PubMed] [Google Scholar]
- 114.Wood R, Middelkoop K, Myer L, et al. Undiagnosed tuberculosis in a community with high HIV prevalence: Implications for tuberculosis control. Am J Respir Crit Care Med. 2007;175(1):87–93. doi: 10.1164/rccm.200606-759OC. [DOI] [PMC free article] [PubMed] [Google Scholar]
- 115.Gagneux S, Long CD, Small PM, Van T, Schoolnik GK, Bohannan BJM. The competitive cost of antibiotic resistance in mycobacterium tuberculosis. Science. 2006;312(5782):1944–1946. doi: 10.1126/science.1124410. [DOI] [PubMed] [Google Scholar]
- 116.Selwyn PA, Hartel D, Lewis VA, et al. A prospective study of the risk of tuberculosis among intravenous drug users with human immunodeficiency virus infection. N Engl J Med. 1989;320(9):545–550. doi: 10.1056/NEJM198903023200901. [DOI] [PubMed] [Google Scholar]
- 117.Aissa K, Madhi F, Ronsin N, et al. Evaluation of a model for efficient screening of tuberculosis contact subjects. Am J Respir Crit Care Med. 2008;177(9):1041–1047. doi: 10.1164/rccm.200711-1756OC. [DOI] [PubMed] [Google Scholar]
- 118.Lawn SD, Kerkhoff AD, Wood R. Progression of subclinical culture-positive tuberculosis to symptomatic disease in HIV-infected individuals. AIDS. 2011;25(17):2190–2191. doi: 10.1097/QAD.0b013e32834cda4e. [DOI] [PubMed] [Google Scholar]
- 119.Mtei L, Matee M, Herfort O, et al. High rates of clinical and subclinical tuberculosis among HIV-infected ambulatory subjects in Tanzania. Clin Infect Dis. 2005;40(10):1500–1507. doi: 10.1086/429825. [DOI] [PubMed] [Google Scholar]
- 120.Sreeramareddy CT, Panduru KV, Menten J, Van den Ende J. Time delays in diagnosis of pulmonary tuberculosis: A systematic review of literature. BMC Infect Dis. 2009;9:91. doi: 10.1186/1471-2334-9-91. [DOI] [PMC free article] [PubMed] [Google Scholar]
- 121.Classen CN, Warren R, Richardson M, et al. Impact of social interactions in the community on the transmission of tuberculosis in a high incidence area. Thorax. 1999;54(2):136–140. doi: 10.1136/thx.54.2.136. [DOI] [PMC free article] [PubMed] [Google Scholar]
- 122.Dharmadhikari AS, Mphahlele M, Stoltz A, et al. Surgical face masks worn by multidrug-resistant tuberculosis patients: Impact on infectivity of air on a hospital ward. Am J Respir Crit Care Med. 2012 doi: 10.1164/rccm.201107-1190OC. in press. [DOI] [PMC free article] [PubMed] [Google Scholar]
- 123.Escombe AR, Oeser C, Gilman RH, et al. The detection of airborne transmission of tuberculosis from HIV-infected patients, using an in vivo air sampling model. Clin Infect Dis. 2007;44(10):1349–1357. doi: 10.1086/515397. [DOI] [PMC free article] [PubMed] [Google Scholar]
- 124.Alavez-Ramirez J, Castellanos JR, Esteva L, et al. Within-host population dynamics of antibiotic-resistant M. tuberculosis. Math Med Biol. 2007;24(1):35–56. doi: 10.1093/imammb/dql026. [DOI] [PubMed] [Google Scholar]
- 125.Shilova MV, Dye C. The resurgence of tuberculosis in Russia. Philos Trans R Soc Lond B Biol Sci. 2001;356(1411):1069–1075. doi: 10.1098/rstb.2001.0895. [DOI] [PMC free article] [PubMed] [Google Scholar]