

Abstract
Numerous clinical cohorts are exposed to reduced skeletal loading and associated bone loss, including surgical patients, stroke and spinal cord injury victims, and women on bed rest during pregnancy. In this context, understanding disuse-related bone loss is critical to developing interventions to prevent fractures and the associated morbidity, mortality, and cost to the health care system. The aim of this pilot study was to use high-resolution peripheral QCT (HR-pQCT) to examine changes in trabecular and cortical microstructure and biomechanics during a period of non weight bearing (WB) and during recovery following return to normal WB. Surgical patients requiring a 6-week non-WB period (n = 12, 34.8 ± 7.7 yrs) were scanned at the affected and contralateral tibia prior to surgery, after the 6-week non-WB period, and 6 and 13 weeks after returning to full-WB.
At the affected ultradistal tibia, integral vBMD (including both trabecular and cortical compartments) decreased with respect to baseline (−1.2%), trabecular number increased (+5.6%), while trabecular thickness (−5.4%), separation (−4.6%), and heterogeneity (−7.2%) decreased (all p<0.05). Six weeks after return to full-WB, trabecular structure measures reverted to baseline levels. In contrast, integral vBMD continued to decrease after 6 (−2.0%, p < 0.05) and 13 weeks (−2.5%, p = 0.07) of full-WB. At the affected distal site, the disuse period resulted in increased porosity (+16.1%, p < 0.005), which remained elevated after 6 weeks (+16.8%, p < 0.01) and after 13 weeks (+16.2%, p < 0.05). A novel topological analysis applied to the distal tibia cortex demonstrated increased number of canals with surface topology (“slabs” +21.7%, p < 0.01) and curve topology (“tubes” +15.0%, p < 0.05) as well as increased number of canal junctions (+21.4%, p < 0.05) following the disuse period. Porosity increased uniformly through increases in both pore size and number. Finite element analysis at the ultradistal tibia showed decreased stiffness and failure load (−2.8% and −2.4%, p < 0.01) following non-WB. These biomechanical predictions remained depressed following 6 and 13 weeks of full-WB. Finite element analysis at the distal site followed similar trends.
Our results suggest that detectable microstructural and biomechanical degradation occurs – particularly within the cortical compartment – as a result of non-WB and persists following return to normal loading. A better understanding of these microstructural changes and their short- and long-term influence on biomechanics may have clinical relevance in the context of disuse-related fracture prevention.
Keywords: HR-pQCT, disuse, bone structure, cortical porosity, biomechanics
1 Introduction
The skeleton is highly responsive to its mechanical environment, adjusting both macro- and microstructure in response to altered loading patterns. Surgical patients, stroke and spinal cord injury victims, women on bed rest during pregnancy, and astronauts are all exposed to reduced skeletal loading and associated bone loss. Space-flight literature has documented average decreases in areal BMD (aBMD) and volumetric BMD (vBMD) of 1–3% per month under exposure to microgravity [1, 2], resulting in an estimated 2% per month decline in bone strength as reported at the proximal femur. [3] Significant reductions in aBMD, vBMD, and bone mineral content have also been reported under conditions of immobilization [4, 5], wheel chair use [6, 7], paralysis [8, 9], and bed rest [10–15]. Restricted weight-bearing (WB) in hip surgery patients has been shown to induce a 7% decrease in vBMD within the trabecular compartment at the tibia over an 8-week period. [6] Further, studies of reloading following spaceflight have established that low vBMD persists once full WB is reinstated. [16, 17] In lower extremity injuries requiring a period of immobilization, aBMD decrement persists for 10 years or longer [18, 19] and results in a 37% increased fracture incidence compared to the unaffected limb [20]. Thus, bone loss due to a period of reduced loading is a risk factor for subsequent fractures. Understanding the mechanisms associated with disuse-related bone loss is critical to developing interventions to prevent fractures and the associated morbidity, mortality, and cost to the health care system.
Bone loss and fracture risk following disuse have been assessed primarily by aBMD and vBMD derived from dual energy x-ray absorptiometry (DXA) and quantitative computed tomography (QCT). To fully understand the impact of disuse-related bone loss, it is important to characterize bone microstructure. Trabecular bone microstructure alterations are associated with fracture risk independent of aBMD. [21–27] Cortical bone microstructure – specifically porosity – is a major determinant of strength, stiffness, and fracture toughness of cortical tissue [28–30] and may contribute to the aBMD-independent effect of age on bone fragility and fracture risk. [31, 32]
High-resolution peripheral quantitative computed tomography (HR-pQCT) provides quantitative characterization of bone density, geometry, and microstructure within both trabecular and cortical compartments [33–36]. Combined with finite element (FE) analysis [37–41], HR-pQCT is capable of estimating the effect of disuse-related deterioration of bone density, geometry, and microstructure on bone strength. The first reports of HR-pQCT data in disuse were published recently. [42, 43] These two bed-rest studies documented small changes in geometry and vBMD (0.5–2% following 60 days bed rest), but did not investigate cortical porosity, nor other metrics of cortical microstructure. However, based on densitometry results, Belavy et al. implicate the cortex as the region of strongest and most enduring bone loss, and explicitly state the necessity for more detailed investigation of cortical microstructure changes.
The goal of this work was to quantify the structural and biomechanical changes occurring in response to a period of disuse and during the subsequent return to normal loading. Specifically, we applied HR-pQCT imaging and advanced image analysis techniques to evaluate microstructural changes in both the trabecular and cortical compartments of the distal tibia, and FE analysis to estimate associated changes in bone biomechanics. In subjects undergoing lower limb surgery requiring a 6-week non WB period, HR-pQCT was performed prior to surgery (baseline), after 6 weeks of non WB, and at two recovery time-points following return to full WB. We hypothesized that significant microstructural deterioration and reduction in biomechanical competence would be detected in the affected tibia following the non WB period, would be more pronounced and enduring in the cortical compartment than in the trabecular compartment, and would persist following return to normal WB.
2 Methods
2.1 Subjects
Individuals undergoing surgery requiring them to be on crutches for six weeks post-procedure were recruited for the study. Patients undergoing the following procedures were considered for inclusion: anterior cruciate ligament (ACL) reconstruction with meniscus repair, high tibial osteotomy, femoral trochanteric osteotomy, Fulkerson osteotomy, Lapidus procedure (bunionectomy), and cartilage repair with microfracture. All procedures involving the tibia were localized to the most proximal aspect of the tibia. All subjects were WB without restrictions for at least 6 weeks prior to study enrollment. All subjects were instructed to remain non WB on the affected leg for the six week duration of crutch use. The following conditions were criteria for exclusion: 1) history of or evidence for metabolic bone disease; 2) evidence of alcoholism, chronic drug use, chronic gastrointestinal disease, or renal or hepatic impairment; 3) any treatment that influenced bone turn over in the 12 months prior to enrollment; 4) any supplement that influenced bone turn over in the six months prior to enrollment; 5) a history of ankle trauma in the six months prior to enrollment; 6) perimenopausal as indicated by cessation of menses within 5 years prior to enrollment; and 7) failure to meet x-ray safety guidelines. The study protocol was approved by the UCSF Committee on Human Research, and all subjects gave written informed consent before participation.
2.2 HR-pQCT Imaging
Subjects underwent HR-pQCT imaging at the following four time-points: 1) BASELINE prior to surgery (2.7 ± 2.7 days prior to surgery), 2) FOLLOW UP (F/U) #1 approximately six weeks after surgery (43.4 ± 1.8 days), 3) F/U #2 approximately six weeks after return to full WB (44.4 ± 5.0 days), and 4) F/U #3 approximately 13 weeks after return to full WB (97.0 ± 15.6 days). Subjects were contacted twice per week to determine the date of return to full WB (time between initiation of partial WB and return to full WB: 10.3 ± 12.7 days).
Subjects were imaged using a clinical HR-pQCT scanner (XtremeCT, Scanco Medical AG, Brüttisellen, Switzerland) with X-ray source potential of 60 kVp and a current of 900 μA. In order to create images with an isotropic voxel size of 82 μm, 750 projections were acquired at a 100 ms integration time/projection. The 126 mm field of view (FOV) was then reconstructed across a 1,536 × 1,536 matrix, yielding the desired voxel size.
At each time-point, subjects were scanned at both the affected (disuse) and contralateral tibia. The ankle was immobilized in a carbon fiber cast and fixed within the gantry of the scanner. On each side, the tibia was scanned at two locations (Fig. 1): 1) the standard ultradistal site (for standard trabecular and cortical analysis) and 2) a distal site (for exploratory cortical analysis). The ultradistal site was defined starting 22.5 mm proximal to the distal endplate and included both cortical and trabecular bone, whereas the distal site was defined starting 37.5 mm proximal to the distal endplate and was primarily comprised of cortical bone. For both locations, the scan covered a distance of 9.02 mm proximal to the starting point, generating volumes consisting of 110 slices. The linear attenuation values generated from the reconstructions were converted to hydroxyapatite (HA) mineral densities using calibration data derived from a phantom provided by the manufacturer. Total effective dose was approximately 12 μSv per visit.
Figure 1.

Scout radiograph of the tibia illustrating the standard ultradistal and distal scan regions. A single scan slice is shown along with example output from the standard clinical evaluation, the extended cortical analysis, and the cortical pore topology analysis at the ultradistal tibia region.
2.3 Image Analysis
2.3.1 Standard Analysis
Analysis of the ultradistal site was performed using the standard clinical evaluation protocol in Image Processing Language (IPL v5.08b, Scanco Medical AG), as described in detail in previous publications [33, 44]. Contours identifying the periosteal perimeter of the bone were drawn semi-automatically using an edge-finding algorithm [45]. All contours were examined manually and modified as necessary to delineate the periosteal boundary. Integral vBMD, representing both trabecular and cortical compartments, was quantified based on the periosteal segmentation. A threshold-based process was used to segment cortical and trabecular regions for compartment-specific measurements of density and structure [45]. Trabecular bone volume fraction (BV/TV) was calculated based on trabecular vBMD (Tb.BMD) assuming a tissue mineral density of 1200 mg HA/cm3. Trabecular number (Tb.N) was calculated directly by a model-independent sphere fitting technique [46, 47]. Based on the calculated BV/TV and Tb.N values, trabecular separation (Tb.Sp) and trabecular thickness (Tb.Th) were derived using standard histomorphometric relations assuming a plate model [48, 49]. Trabecular heterogeneity (Tb.1/N.SD) was also calculated.
2.3.2 Cortical Analysis
Cortical parameters at both distal and ultradistal sites were assessed using an extended cortical bone analysis that provides direct calculation of cortical thickness as well as measures of porosity [34, 35]. Values for the following structural parameters were calculated: cortical vBMD (Ct.BMD) and tissue mineral density (Ct.TMD), cortical area (Ct.Ar) and thickness (Ct.Th), moment of inertia (MOI), cortical porosity (Ct.Po), and mean and standard deviation of cortical pore diameter (Ct.Po.Dm. and Ct.Po.Dm.SD, respectively). Ct.BMD was calculated as the mean value of all voxels within the cortical compartment, while Ct.TMD excluded void voxels. Both measures excluded 2 layers of pixels at the VOI and bone surface, respectively, to minimize bias from partial volume voxels. Both Ct.Th and Ct.Po.DM were determined using a 3D sphere filling technique [50]. Ct.Po was defined as the fraction of the segmented pore volume over the sum of the pore and cortical bone volume. The extended cortical bone analysis was performed in IPL.
2.3.3 Cortical Pore Topology Analysis
A novel skeletonization algorithm [51] was applied to the cortical porosity in order to define the topology of pore structures. Using this algorithm, the cortical pore network was deconstructed into individual elements (canals) with each pore voxel assigned a topological label, allowing for the classification of individual canals as either tubes (representing elements with curve topology, resolvable single canals) or slabs (representing elements with planar surface topology, possibly resulting from canal merging [52]). The skeletonization routine used in this study incorporated 3D thinning and decomposition techniques previously described elsewhere in the literature [53–55]. Following topological classification of each pore voxel (ie. surface, curve, junction) [53], the resulting labeled skeleton was propagated back to the original volume using a dilation algorithm [54]. From the labeled, propagated image the volume of individual canals was quantified. Mean slab and tube volume (Slab.Vol and Tube.Vol) were calculated for each sample. The ratio of integral (total) slab volume to integral tube volume (iSlab.Vol/iTube.Vol) was calculated. The total number of canals having surface topology (N.Slabs) and curve topology (N.Tubes), and total number of canal-canal junctions (N.Junctions) were calculated. The orientation of each slab and tube was defined as the angle between the individual element and the z-axis of the image coordinate system (approximately co-linear to the longitudinal axis of the tibia). Mean slab and tube orientation (Slab.θ and Tube.θ) were calculated for each sample. The entire skeletonization routine was performed using MATLAB (R2010b, The MathWorks, Inc.).
2.3.4 Regional Analysis
Cortical and trabecular analyses were also performed on individual sub-regions of bone. Regional variations in trabecular [56] and cortical [57] microstructure parameters at the tibia have been demonstrated, as has the capacity of regional analysis to improve sensitivity to longitudinal microstructural changes [58, 59].
Regional analysis was performed with respect to anatomic quadrants (anterior, posterior, medial, lateral) as well as radial layers (inner/outer in the trabecular compartment and endosteal, midcortical, periosteal in the cortical compartment). Regional masks were automatically created using Matlab and subsequently applied to the derivative images of the cortical and trabecular analyses described above. Anatomic quadrants were defined using the axis connecting the centroids of the tibia and fibula as a reference, as described in detail elsewhere [56]. The trabecular compartment was further partitioned into inner and outer layers based on a volume criterion [56]. Radial analysis of cortical compartment porosity is described in detail in the following section.
2.3.5 Laminar Cortical Porosity Analysis
The cortical compartment was subdivided into three concentric regions of equal width corresponding to endosteal, midcortical, and periosteal layers (Fig. 2). To achieve this we performed a series of operations on the cortical volume. First, endosteal and periosteal boundaries were discretized. Second, pairs of points on each boundary were identified. Third, the distance between each pair of points was determined and two points representing the inner and outer boundaries of the midcortical region were located. Fourth, each set of discrete points representing the inner and outer boundaries of the midcortical region were joined into a continuous boundary by a series of dilations followed by a thinning routine.
Figure 2.
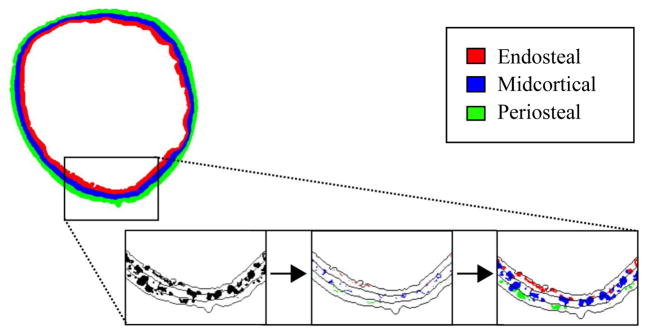
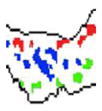
Depiction of the cortical laminar analysis procedure. A small section of a tibial cross-sectional slice is shown. Left: Pores (black) are shown in full with lines depicting boundaries between laminar regions. Center: Pore skeletons are assigned to a single layer (endosteal pores in red, midcortical pores in blue, periosteal pores in green). Right: Full pores are assigned to a layer according to the location of their skeletons.
Cortical pores were assigned to either the endosteal, midcortical, or periosteal layer based on the location of their centers, determined by the skeletonization process described in section 2.3.3 above. This approach ensures that: 1) any longitudinal expansion of an individual pore is attributed to the layer to which the pore was originally assigned, rather than being split between adjacent layers and 2) average pore area for each layer can be calculated accurately. Total pore area was calculated for each slice of the analyzed volume as the sum of the areas of all pores assigned to each layer. Total pore number was calculated for each slice as the number of skeleton elements assigned to each layer. Both total pore area and total pore number were normalized by the area of each layer, and reported as means over all slices in the analyzed volume. Average pore area was calculated for each slice as total pore area divided by total pore number, and reported as a mean over all slices. While normalized total pore area may bear similarity to the established measure Ct.Po, it must be noted that pores are not split between regions, and so total pore area includes portions of pores not located within the boundaries of the region to which they are assigned. All laminar cortical porosity analysis calculations were performed in MATLAB (R2010a Student Version, The MathWorks, Inc.).
2.4 μFE Analysis
Linear μFE analysis was performed on all ultradistal and distal tibia images to measure changes in apparent biomechanical properties. The binarized image created during the standard evaluation protocol was converted into a mesh of isotropic brick elements using a voxel conversion technique [60], with each element assigned an elastic modulus of 6.8 GPa and a Poisson ratio of 0.3 [39, 61]. The trabecular and cortical compartments were labeled as different materials with the same material properties in order to compare the load fraction carried by each. A uniaxial compression test in the axial direction with an applied strain of 1% was performed on all μFE models, and an iterative solver (Scanco FE Software Version 1.12, Scanco Medical AG) was used to calculate the reaction forces on the superior and inferior ends of the model based on the given boundary conditions.
Stiffness and cortical compartment load fraction (Ct.LF) were computed for each model. Failure load was estimated based on methods previously described in the literature [39], with a criterion that defined bone failure when 7.5% of the bone volume was strained above 0.7% effective strain.
2.5 Statistical Analysis
Means and standard deviations were calculated for all parameters at each analysis region and time-point. Parameter distributions were assessed and normality tested using Shapiro-Wilk tests. Repeated measures analysis of variance (ANOVA) was used to determine whether each parameter changed over time and whether there existed significant regional differences over time. Post-hoc paired t-tests were performed as indicated by the ANOVA. To compare responses on the affected and the contralateral side, paired t-test analysis was performed at each time-point between sides. Statistical significance was defined as p<0.05. Statistical tests were performed using JMP (Version 7.0, SAS Institute Inc., Cary, NC) and R (v.2.13.0, The R Foundation for Statistical Computing).
3 Results
3.1 Subjects
Twelve subjects (10 males/2 females) completed the study. One of these 12 was imaged only at the first three time-points. At baseline, subjects were 34.8 ± 7.7 years, with a range of 22 to 46 years. Procedures included: ACL reconstruction with meniscus repair (5), high tibial osteotomy (4), femoral trochanteric osteotomy (1), Lapidus procedure (1), and cartilage repair with microfracture (1). Eight additional subjects (of the original 20 subjects recruited) were withdrawn from the study following the baseline scan due to either 1) determination at the time of surgery that meniscus repair (and therefore non WB) was not necessary or 2) a shortened duration of crutch use as reported by the subject.
3.2 Standard Analysis
Following the disuse period, small but statistically significant changes in trabecular microstructure at the ultradistal site were detected on both the affected and contralateral side (Fig. 3). For the affected limb, Tb.N increased significantly with respect to baseline (+5.6%, p < 0.05) whereas Tb.Th (−5.4%, p < 0.05), Tb.Sp (−4.6%, p < 0.05), and Tb.1/N SD (−7.2%, p < 0.05) decreased. A similar pattern was observed at the contralateral ultradistal site, with an increase in Tb.N (+3.8%, p < 0.01) coupled with decreases in Tb.Th (−4.6%, p < 0.01), Tb.Sp (−3.5%, p < 0.05), and Tb.1/N SD (−5.1%, p < 0.01). Changes in densitometric measures were significant only on the affected side, where integral vBMD decreased (−1.2%, p < 0.05). No significant changes in Tb.BMD or trabecular BV/TV were detected on either side immediately following disuse. None of the responses on the affected side were significantly different than those on the contralateral side.
Figure 3.
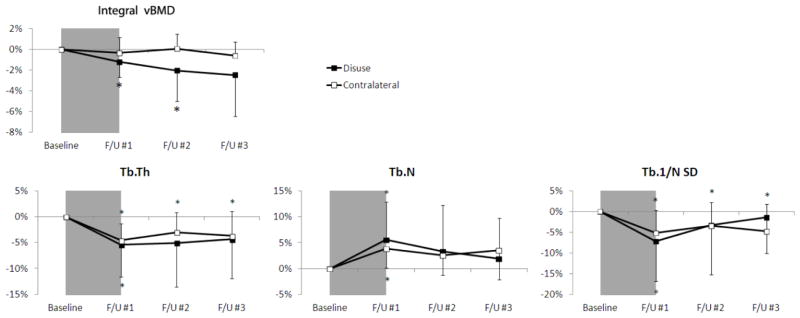
Time-series line plots of the percentage change in ultradistal tibia integral vBMD and trabecular structure parameters for the disuse limb (black square) and the contralateral limb (white square). The 6 week disuse period is represented by the grey shaded region between the baseline and F/U #1 time-points. Error lines represent standard deviations. *p<0.05 versus baseline.
Six weeks after return to full WB, each trabecular microstructure parameter on the affected side was indistinguishable from the baseline level. On the contralateral side, however, Tb.Th (−3.0%, p < 0.05), Tb.Sp (−2.3%, p < 0.05) and Tb.1/N SD (−3.5%, p < 0.05) remained depressed. It should be noted that these values are within the limits of reproducibility for these parameters. Integral vBMD on the affected side continued to decrease after 6 (−2.0%, p < 0.05) and 13 weeks (−2.5%, p = 0.07) of full WB. Tb.BMD (−3.0%, p < 0.05) on the affected side was significantly lower at the final time-point than at baseline.
3.3 Cortical Analysis
Figure 4 demonstrates visibly increased porosity in a representative distal tibia scan region from a single subject at baseline and after the 6-week disuse period. At the affected distal site, the disuse period resulted in a significant increase in Ct.Po (+16.1%, p < 0.005; Fig. 5). This increase was significantly greater than the corresponding change on the contralateral side. A non-significant trend towards decreased Ct.BMD (−0.4%, p=0.16) was observed following the disuse period. No changes in Ct.Po.Dm, Ct.Po.Dm.SD, Ct.TMD, Ct.Ar, Ct.Th, or MOI were observed at the distal site. Upon return to full WB, Ct.Po remained elevated after 6 weeks (+16.8%, p < 0.01) and after 13 weeks (+16.2%, p < 0.05). All changes in the other cortical parameters remained non-significant through the final time-point on both the affected and contralateral side.
Figure 4.
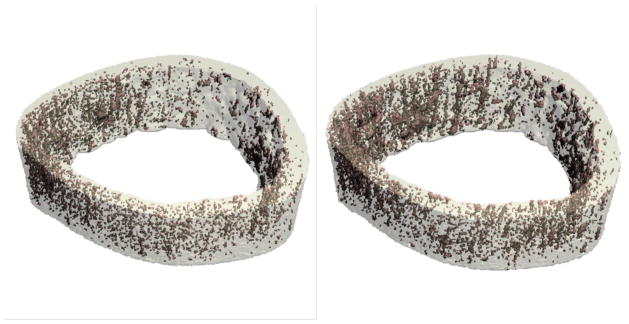
Porosity (in red) at the distal tibia in a single representative subject at baseline (left) and after 6 weeks of disuse (right). Visible changes in porosity and pore structure are evident.
Figure 5.
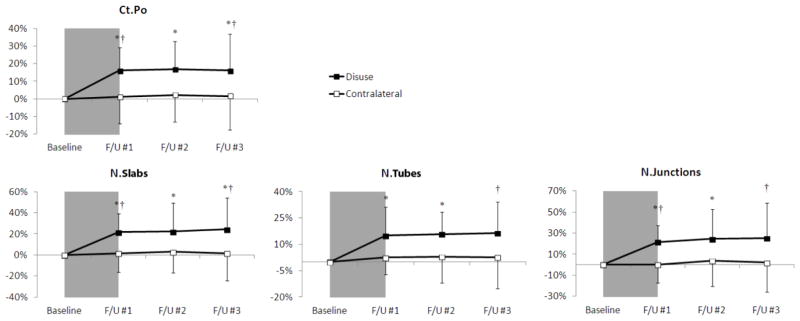
Time-series line plots of the percentage change in distal tibia cortical porosity and pore structure parameters for the disuse limb (black square) and the contralateral limb (white square). The 6 week disuse period is represented by the grey shaded region between the baseline and F/U #1 time-points. Error lines represent standard deviations. *p<0.05 versus baseline; †p<0.05 disuse versus contralateral limb at same time-point.
Trends observed at the affected distal site were mirrored at the ultradistal site. After disuse, Ct.Po increased significantly (+14.8%, p < 0.01); additionally, increases in Ct.Po.Dm (+3.7%, p < 0.05) and Ct.Po.Dm.SD (+7.6%, p<0.05) were observed. Each of these changes was significantly greater than that observed on the contralateral side. This increased porosity was coupled with a decrease in Ct.BMD (−0.8%, p < 0.05). Changes in the porosity and density measures persisted after return to weight bearing. After twelve weeks of full WB, Ct.Po remained elevated (+16.1%, p < 0.05) and the decrease in Ct.BMD (−0.9%, p = 0.08) approached significance.
3.4 Cortical Pore Topology Analysis
Results from the pore topology analysis demonstrated significant changes in the cortical pore network as a result of disuse (Fig. 5). At the affected distal site, increased N.Slabs (+21.7%, p < 0.01) and N.Tubes (+15.0%, p < 0.05) were detected after the disuse period, consistent with the increase in Ct.Po. N.Junctions also increased after the disuse period (+21.4%, p < 0.05). Changes in N.Slabs and N.Junctions on the affected side were significantly greater than those on the contralateral side (p < 0.05). No changes in iSlab.Vol/iTube.Vol, Tube.θ, or Slab.θ were detected at the distal site. After 6 weeks full WB, N.Slabs (+22.2%, p < 0.05), N.Tubes (+15.8%, p < 0.05), and N.Junctions (+24.5%, p < 0.05) remained elevated. After 13 weeks full WB, all three parameters remained significantly elevated compared to the contralateral side.
At the affected ultradistal site, the disuse period resulted in a significant increase in N.Junctions (+18.6%, p < 0.05). Increases in N.Slabs (+14.3%, p = 0.08) and N.Tubes (+11.0%, p = 0.05) approached significance. Similarly, changes in Slab.Vol (+17.0%, p = 0.07) and iSlab.Vol/iTube.Vol (+19.5%, p = 0.08) both approached significance, and both of these changes were significantly higher than the corresponding contralateral responses (p < 0.05). After 6 weeks of full WB, N.Junctions remained elevated (+16.4%, p < 0.05).
3.5 Regional Analysis
Results from the regional trabecular analysis mirrored the trends observed in the global analysis, with greater % change values in particular regions. The greatest changes were observed in the inner subregion. Following the disuse period, the inner region of the affected site exhibited changes that were larger in magnitude than those detected by global analysis Tb.N (+7.6%, p < 0.05), Tb.Th (−6.8%, p < 0.05), Tb.Sp (−6.5%, p < 0.05) and Tb.1/N.SD (−7.6%, p<0.05). Similar trends were observed in the corresponding contralateral site, with the largest changes occurring in the inner subregion of the trabecular compartment. No differences in response to disuse were detected among the quadrants (anterior, posterior, medial, lateral) of the trabecular compartment. Regional analysis of the cortical compartment also reflected global trends. At the affected distal site, increases in Ct.Po after disuse were largest in the anterior (+21.4%, p < 0.05) and lateral (+20.6%, p < 0.05) subregions. This regional distribution of increased Ct.Po remained consistent throughout all follow-ups. For the skeletonization parameters, the anterior subregion displayed the greatest change in N.Slabs (+44.7%, p < 0.05), N.Tubes (+20.3%, p< 0.05), and N.Junctions (+43.4%, p < 0.05). This spatial trend persisted throughout all time-points.
At the ultradistal site, the largest changes in Ct.Po resulting from disuse were observed in the anterior (+25.9%, p < 0.05) and medial (+21.5%, p < 0.05) subregions. This spatial trend was consistent throughout all timepoints. Mean slab volume increased significantly in the posterior subregion (+25.2%, p < 0.05) following disuse and continued to increase after full WB. This increase in mean slab volume was significantly higher (p<0.05) than the corresponding response on the contralateral side. Additionally, iSlab.Vol/iTube.Vol in the posterior subregion was significantly elevated after 6 and 13 weeks of full WB (6 wks: +65.1%, 13 wks: +46.6%; p < 0.05).
The results of the laminar cortical porosity analysis at the distal tibia are summarized in Table 1. Following the disuse period, all regions at the affected distal site showed an increase in total pore area and total pore number. A significant increase in average pore area was seen in both the midcortical and periosteal layers, though not in the endosteal layer. Six and 13 weeks after return to full WB, all measures remained elevated with respect to baseline. In the contralateral leg, no significant changes were detected over the study period. Results of laminar cortical porosity analysis at the ultradistal site also reflected these patterns, though changes were more modest at the ultradistal site.
Table 1.
Regional and topological analysis applied to the affected distal tibia indicates increased porosity throughout the cortex over the 6 week disuse period, by a mechanism of both increased pore size and increased pore number. All longitudinal changes significant unless noted (NS p≥0.05). No significant changes were found in the contralateral tibia.
|
|
||||
|---|---|---|---|---|
| total pore area | average pore area | total pore number | ||
|
|
||||
|
endosteal | +11%** | NS | +12%** |
| midcortical | +32%** | +6%* | +23%* | |
| periosteal | +32%** | +11%* | +24%** | |
|
|
||||
p < 0.01
p < 0.05
3.6 μFE Analysis
Biomechanical properties of the tibia were altered significantly after the disuse period (Fig. 6). After 6 weeks of disuse, decreased stiffness (−2.8%; p < 0.01) and estimated failure load (−2.4%, p < 0.01) were detected at the affected ultradistal site. Lesser decreases in these parameters were found at the corresponding contralateral site (stiffness: −2.2%, failure load: −1.6%, p < 0.05). Changes persisted following return to full WB. After 13 weeks of full WB, stiffness (−4.8%, p < 0.05) and failure load (−4.6%, p < 0.05) remained significantly lower than baseline at the affected ultradistal site. This pattern was mirrored at the corresponding contralateral site, though at a lesser magnitude (stiffness: −2.6%, failure load, −2.2%; p < 0.05). Side-to-side differences in these measures were not detected at any time-point. No significant changes in Ct.LF were found at any timepoint. Results at the distal site reflected these trends; however, the magnitude of changes were lower and fewer significant changes were found at the contralateral site.
Figure 6.
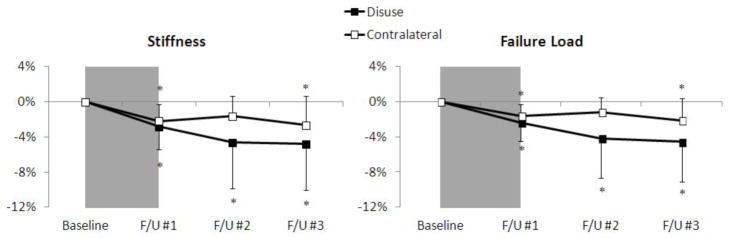
Time-series line plots of the percentage change in ultradistal tibia biomechanical parameters for the disuse limb (black square) and the contralateral limb (white square). The 6 week disuse period is represented by the grey shaded region between the baseline and F/U #1 time-points. Error lines represent standard deviations. *p<0.05 versus baseline.
4 Discussion
This study is the first to quantify longitudinal changes of both trabecular and cortical microstructure in response to reduced WB in humans. Ct.Po increased dramatically during the 6-week non WB period, and remained elevated after 13 weeks of full WB. Integral vBMD reflected the Ct.Po changes, decreasing significantly following the non WB period and remaining depressed following return to full WB. Small alterations in trabecular parameters describing number, thickness, separation, and heterogeneity were also evident following the 6-week non WB period; however, these parameters were indistinguishable from baseline levels six weeks after return to full WB. Finite element analysis revealed significant changes in biomechanics following the non WB period, including decreased stiffness and estimated failure load. These biomechanical measures remained depressed following 13 weeks of full WB, mirroring the time-course of integral vBMD and Ct.Po changes. Our results demonstrate that detectable and biomechanically significant microstructural deterioration occurs in response to disuse and persists following return to normal loading. This deterioration is most pronounced and enduring within the cortical compartment, suggesting that the development of therapeutic interventions be focused on the prevention or reversal of cortical porosity.
Of the microstructural features investigated, Ct.Po was found to have the greatest and most persistent response to non WB. For comparison, the magnitude of Ct.Po increase over the 6 week non WB period was greater than that seen over a decade (40–50 y) in men and on the order of changes over the peri-menopausal decade (40–50 y) in women. [37] While these results are striking, they raise questions as to the underlying mechanisms of increased cortical porosity and strength loss. For example, is porosity increasing through the enlargement of existing pores, or the formation of new pores? Are pores merging to create larger, wider pores that may act as stress-risers? More detailed data describing the microstructure of cortical pores may provide insight into the biomechanical environment within the cortex. A novel method for quantifying cortical pore topology was applied to this data set to address these questions. Topology analysis results suggest that porosity became more interconnected following disuse, quantified by an increase in canal junctions and both number and relative volume of slabs.
Regional and laminar analysis revealed sub-compartments of the tibia most sensitive to alterations in loading environment. In the evaluation of this data set, laminar analysis combined with topological analysis enabled the determination of the precise structural changes associated with increased porosity during the disuse phase. Total pore area was found to increase uniformly throughout the cortex, within the endosteal, midcortical, as well as periosteal layers. Further, increased porosity was found to occur through an increase in both pore size and pore number. In contrast to the data presented here, our observations in a longitudinal study of a postmenopausal cohort demonstrated increased porosity isolated to the endosteal layer of the cortex by a mechanism of increased pore size only (no increase in pore number) [62]. The specific pattern of porosity increase seen in this disuse cohort, therefore, may indicate a unique mechanism of increased porosity. Increased pore number suggests the development of new BMUs due to increased osteoclast activation. [63] Based on literature describing increased vascularity and hyperemia in disuse [63] and the link between vasoactors and increased osteoclast activity [64–66], our very preliminary hypothesis is that porosity increase in the disuse cohort could be influenced by the vascular system.
The increase in Tb.N and decrease in Tb.Sp and Tb.1/N SD during the disuse period are unexpected results considering the usual pattern of structure changes associated with aging or osteoporosis. [23, 26] However, a thorough examination of HR-pQCT quality grade by a blinded radiologist (all images were judged to be in the best quality group “no visible motion artifacts”) and evaluation of subject-by-subject data (each individual displayed the same pattern of structure changes) confirmed our results, suggesting that restricted loading of the lower limb may, at least in the short-term, induce bone loss by a mechanism of trabecular fenestration, increasing Tb.N and homogeneity through a conversion of plates to multiple rod-like trabeculae.
A unique feature of this study design was the use of post-surgical non WB as a model for disuse-related bone loss, which is logistically more accessible than bed rest [67], limb suspension [4], or space flight [17] studies of skeletal response to unloading. Additionally, subjects using crutches have reduced metabolic changes compared to those documented during bed rest and spaceflight [68], and are not subject to loss of skeletal muscle activity as in spinal cord injury studies [8, 69]. Most importantly, since these subjects are undergoing a period of non WB as per clinical standard of care for their condition, the known negative consequences of bed rest or limb suspension are not imposed on otherwise healthy volunteers.
However, the study of disuse in the setting of post-surgical non WB presents a number of challenges and limitations. First, it is likely that loading of the contralateral side was atypical during the crutch use period. Whether loading on the contralateral side was higher than pre-surgical levels due to shifted ground reaction force [70] or lower due to an overall decreased activity level is difficult to determine. Small but significant changes in trabecular structure and biomechanical parameters were seen for the contralateral side over the non WB period, which may have been initiated by a change in loading pattern due to crutch use. Therefore, the contralateral limb is not an ideal control. Second, since this pilot study did not include plantar pressure or accelerometer data capture, we cannot confirm the complete unloading of the surgical side during the non WB period. Patients were asked to self-report any WB episodes; one subject was withdrawn from the study due to reported non-compliance with non WB instructions. Significant changes consistent with disuse were seen despite any unreported WB on the surgical side. Third, because a range of surgical procedures were included in this study, there was likely much variation in the time-course and success of return to normal function following the non WB period. The final time-point of this study was 13 weeks after the discontinuation of crutch use; however, it is not known whether study participants returned to pre-surgical function or activity level during this follow-up period. In most cases, the first contact of study participant with the research team occurs after the initial injury, making definite comparisons to pre-injury and pre-surgery period impossible. Thorough activity questionnaires could aid in the interpretation of data in the follow-up period. Finally, subjects recruited for this study were of a narrow age range, limiting the applicability of our results to older cohorts.
Additional limitations of this pilot study that must be considered include a small and heterogeneous patient cohort and limited image resolution. Sample size was limited by recruitment logistics, as well as high subject attrition due to unforeseeable changes in surgical procedure and post-surgical care instruction. To increase the number of subjects included in the study, the inclusion criteria were expanded to include a multitude of surgical interventions. While this may certainly have an effect in the recovery period, we do not expect this to have much impact during the disuse phase. However, more modest associations may not be detectable with our sample size. The spatial resolution of the HR-pQCT is limited particularly with respect to the dimensions of cortical porosity. With a true spatial resolution (10% modulation transfer function) of 128 μm at 82 μm voxel size [44], HR-pQCT cannot resolve cortical porosity at the level of the smallest Haversian and Volkmann canals. However, correlations to higher resolution standards [44, 71], reproducibility [35], and discriminatory power [26, 71, 72] of HR-pQCT indices of cortical porosity have demonstrated its utility in evaluating resolvable microstructure. Our ex vivo comparison of HR-pQCT porosity quantification to higher-resolution μCT data showed high correlations between these modalities. [44] Regardless, this issue complicates the interpretation of our finding of increased pore number. It is possible that increased pore number may actually reflect an increase in size of the smallest pores to the minimum detectable diameter.
In summary, we have quantified longitudinal changes in the trabecular and cortical compartments of the distal tibia in a disuse cohort. Dramatic changes in cortical microstructure were accompanied by significant biomechanical deterioration in this cohort. An understanding of these microstructural changes and their short- and long-term influence on biomechanics may have clinical relevance in developing targeted countermeasures to prevent bone loss and reduce fracture risk in the context of disuse.
Supplementary Material
Highlights.
This study quantified longitudinal changes in trabecular and cortical microstructure at the distal tibia in a disuse cohort.
Dramatic changes in cortical microstructure were accompanied by significant biomechanical deterioration after a 6-week disuse period.
A novel method for quantifying cortical pore topology suggested that porosity became more interconnected following disuse.
Small alterations in trabecular parameters describing number, thickness, separation, and heterogeneity were also evident following the disuse period.
Regional and laminar analysis revealed sub-compartments of the tibia most sensitive to alterations in loading environment.
Acknowledgments
The authors acknowledge support from the following funding sources: NIH K01 AR056734 (GJK), UCSF Academic Senate Independent Investigator Award (GJK), NIH R01 AR060700 (AJB).
Footnotes
All authors state that they have no conflicts of interest.
Publisher's Disclaimer: This is a PDF file of an unedited manuscript that has been accepted for publication. As a service to our customers we are providing this early version of the manuscript. The manuscript will undergo copyediting, typesetting, and review of the resulting proof before it is published in its final citable form. Please note that during the production process errors may be discovered which could affect the content, and all legal disclaimers that apply to the journal pertain.
Contributor Information
Galateia J. Kazakia, Email: galateia.kazakia@ucsf.edu.
Willy Tjong, Email: wwtjong@gmail.com.
Jasmine A. Nirody, Email: jnirody@berkeley.edu.
Andrew J. Burghardt, Email: andrew.burghardt@ucsf.edu.
Julio Carballido-Gamio, Email: Julio.carballido-gamio@ucsf.edu.
Janina M. Patsch, Email: Janina.patsch@meduniwien.ac.at.
Thomas Link, Email: Thomas.link@ucsf.edu.
Brian T. Feeley, Email: FeeleyB@orthosurg.ucsf.edu.
C. Benjamin Ma, Email: MaBen@orthosurg.ucsf.edu.
References
- 1.Lang T, LeBlanc A, Evans H, Lu Y, Genant H, Yu A. Cortical and trabecular bone mineral loss from the spine and hip in long-duration spaceflight. J Bone and Mineral Res. 2004;19:1006–12. doi: 10.1359/JBMR.040307. [DOI] [PubMed] [Google Scholar]
- 2.Turner RT. Invited review: what do we know about the effects of spaceflight on bone? J Appl Physiol. 2000;89:840–7. doi: 10.1152/jappl.2000.89.2.840. [DOI] [PubMed] [Google Scholar]
- 3.Keyak JH, Koyama AK, LeBlanc A, Lu Y, Lang TF. Reduction in proximal femoral strength due to long-duration spaceflight. Bone. 2009;44:449–53. doi: 10.1016/j.bone.2008.11.014. [DOI] [PubMed] [Google Scholar]
- 4.Rittweger J, Winwood K, Seynnes O, de Boer M, Wilks D, Lea R, Rennie M, Narici M. Bone loss from the human distal tibia epiphysis during 24 days of unilateral lower limb suspension. J Physiol. 2006;577:331–7. doi: 10.1113/jphysiol.2006.115782. [DOI] [PMC free article] [PubMed] [Google Scholar]
- 5.Hastings MK, Sinacore DR, Fielder FA, Johnson JE. Bone mineral density during total contact cast immobilization for a patient with neuropathic (Charcot) arthropathy. Phys Ther. 2005;85:249–56. [PMC free article] [PubMed] [Google Scholar]
- 6.Ito M, Matsumoto T, Enomoto H, Tsurusaki K, Hayashi K. Effect of nonweight bearing on tibial bone density measured by QCT in patients with hip surgery. J Bone and Mineral Metab. 1999;17:45–50. doi: 10.1007/s007740050062. [DOI] [PubMed] [Google Scholar]
- 7.Jorgensen L, Jacobsen BK, Wilsgaard T, Magnus JH. Walking after stroke: does it matter? Changes in bone mineral density within the first 12 months after stroke. A longitudinal study. Osteoporos Int. 2000;11:381–7. doi: 10.1007/s001980070103. [DOI] [PubMed] [Google Scholar]
- 8.Modlesky CM, Majumdar S, Narasimhan A, Dudley GA. Trabecular bone microarchitecture is deteriorated in men with spinal cord injury. J Bone and Mineral Res. 2004;19:48–55. doi: 10.1359/JBMR.0301208. [DOI] [PubMed] [Google Scholar]
- 9.Wilmet E, Ismail AA, Heilporn A, Welraeds D, Bergmann P. Longitudinal study of the bone mineral content and of soft tissue composition after spinal cord section. Paraplegia. 1995;33:674–7. doi: 10.1038/sc.1995.141. [DOI] [PubMed] [Google Scholar]
- 10.Thomsen JS, Morukov BV, Vico L, Alexandre C, Saparin PI, Gowin W. Cancellous bone structure of iliac crest biopsies following 370 days of head-down bed rest. Aviat Space Environ Med. 2005;76:915–22. [PubMed] [Google Scholar]
- 11.Leblanc AD, Schneider VS, Evans HJ, Engelbretson DA, Krebs JM. Bone mineral loss and recovery after 17 weeks of bed rest. J Bone and Mineral Res. 1990;5:843–50. doi: 10.1002/jbmr.5650050807. [DOI] [PubMed] [Google Scholar]
- 12.Shackelford LC, LeBlanc AD, Driscoll TB, Evans HJ, Rianon NJ, Smith SM, Spector E, Feeback DL, Lai D. Resistance exercise as a countermeasure to disuse-induced bone loss. J Appl Physiol. 2004;97:119–29. doi: 10.1152/japplphysiol.00741.2003. [DOI] [PubMed] [Google Scholar]
- 13.Berg HE, Eiken O, Miklavcic L, Mekjavic IB. Hip, thigh and calf muscle atrophy and bone loss after 5-week bedrest inactivity. Eur J Appl Physiol. 2007;99:283–9. doi: 10.1007/s00421-006-0346-y. [DOI] [PubMed] [Google Scholar]
- 14.Hansson TH, Roos BO, Nachemson A. Development of osteopenia in the fourth lumbar vertebra during prolonged bed rest after operation for scoliosis. Acta Orthopaedica Scandinavica. 1975;46:621–30. doi: 10.3109/17453677508989244. [DOI] [PubMed] [Google Scholar]
- 15.Vico L, Chappard D, Alexandre C, Palle S, Minaire P, Riffat G, Morukov B, Rakhmanov S. Effects of a 120 day period of bed-rest on bone mass and bone cell activities in man: attempts at countermeasure. Bone Miner. 1987;2:383–94. [PubMed] [Google Scholar]
- 16.Lang TF, Leblanc AD, Evans HJ, Lu Y. Adaptation of the proximal femur to skeletal reloading after long-duration spaceflight. J Bone and Mineral Res. 2006;21:1224–30. doi: 10.1359/jbmr.060509. [DOI] [PubMed] [Google Scholar]
- 17.Vico L, Collet P, Guignandon A, Lafage-Proust MH, Thomas T, Rehaillia M, Alexandre C. Effects of long-term microgravity exposure on cancellous and cortical weight-bearing bones of cosmonauts. Lancet. 2000;355:1607–11. doi: 10.1016/s0140-6736(00)02217-0. [DOI] [PubMed] [Google Scholar]
- 18.Nyland J, Fisher B, Brand E, Krupp R, Caborn DN. Osseous deficits after anterior cruciate ligament injury and reconstruction: a systematic literature review with suggestions to improve osseous homeostasis. Arthroscopy. 2010;26:1248–57. doi: 10.1016/j.arthro.2010.03.017. [DOI] [PubMed] [Google Scholar]
- 19.Kannus P, Jarvinen M, Sievanen H, Oja P, Vuori I. Osteoporosis in men with a history of tibial fracture. J Bone and Mineral Res. 1994;9:423–9. doi: 10.1002/jbmr.5650090319. [DOI] [PubMed] [Google Scholar]
- 20.Jarvinen M, Kannus P. Injury of an extremity as a risk factor for the development of osteoporosis. J Bone Joint Surg Am. 1997;79:263–76. doi: 10.2106/00004623-199702000-00017. [DOI] [PubMed] [Google Scholar]
- 21.Riggs BL, Melton LJ., 3rd Bone turnover matters: the raloxifene treatment paradox of dramatic decreases in vertebral fractures without commensurate increases in bone density. Journal of Bone and Mineral Research. 2002;17:11–4. doi: 10.1359/jbmr.2002.17.1.11. [DOI] [PubMed] [Google Scholar]
- 22.Chesnut CH, 3rd, Rosen CJ. Reconsidering the effects of antiresorptive therapies in reducing osteoporotic fracture. Journal of Bone and Mineral Research. 2001;16:2163–72. doi: 10.1359/jbmr.2001.16.12.2163. [DOI] [PubMed] [Google Scholar]
- 23.Boutroy S, Bouxsein ML, Munoz F, Delmas PD. In vivo assessment of trabecular bone microarchitecture by high-resolution peripheral quantitative computed tomography. J Clin Endocrinol Metab. 2005;90:6508–15. doi: 10.1210/jc.2005-1258. [DOI] [PubMed] [Google Scholar]
- 24.Liu XS, Walker MD, McMahon DJ, Udesky J, Liu G, Bilezikian JP, Guo XE. Better skeletal microstructure confers greater mechanical advantages in Chinese-American women versus Caucasian women. J Bone Miner Res. 2011 doi: 10.1002/jbmr.378. [DOI] [PMC free article] [PubMed] [Google Scholar]
- 25.Sornay-Rendu E, Boutroy S, Munoz F, Delmas PD. Alterations of cortical and trabecular architecture are associated with fractures in postmenopausal women, partially independent of decreased BMD measured by DXA: the OFELY study. J Bone Miner Res. 2007;22:425–33. doi: 10.1359/jbmr.061206. [DOI] [PubMed] [Google Scholar]
- 26.Stein EM, Liu XS, Nickolas TL, Cohen A, Thomas V, McMahon DJ, Zhang C, Yin PT, Cosman F, Nieves J, Guo XE, Shane E. Abnormal microarchitecture and reduced stiffness at the radius and tibia in postmenopausal women with fractures. J Bone Miner Res. 2010;25:2572–81. doi: 10.1002/jbmr.152. [DOI] [PMC free article] [PubMed] [Google Scholar]
- 27.Vico L, Zouch M, Amirouche A, Frere D, Laroche N, Koller B, Laib A, Thomas T, Alexandre C. High-resolution pQCT analysis at the distal radius and tibia discriminates patients with recent wrist and femoral neck fractures. J Bone Miner Res. 2008;23:1741–50. doi: 10.1359/jbmr.080704. [DOI] [PubMed] [Google Scholar]
- 28.Currey JD. The effect of porosity and mineral content on the Young’s modulus of elasticity of compact bone. Journal of Biomechanics. 1988;21:131–9. doi: 10.1016/0021-9290(88)90006-1. [DOI] [PubMed] [Google Scholar]
- 29.Schaffler MB, Burr DB. Stiffness of compact bone: effects of porosity and density. Journal of Biomechanics. 1988;21:13–16. doi: 10.1016/0021-9290(88)90186-8. [DOI] [PubMed] [Google Scholar]
- 30.Ural A, Vashishth D. Effects of intracortical porosity on fracture toughness in aging human bone: a microCT-based cohesive finite element study. Journal of Biomechanics Eng. 2007;129:625–31. doi: 10.1115/1.2768377. [DOI] [PubMed] [Google Scholar]
- 31.Hui SL, Slemenda CW, Johnston CC., Jr Age and bone mass as predictors of fracture in a prospective study. J Clin Invest. 1988;81:1804–9. doi: 10.1172/JCI113523. [DOI] [PMC free article] [PubMed] [Google Scholar]
- 32.Nicks KM, Amin S, Atkinson EJ, Riggs BL, Melton JL, Khosla S. Relationship of age to bone microstructure independent of areal bone mineral density. J Bone Miner Res. 2012;27:637–644. doi: 10.1002/jbmr.1468. [DOI] [PMC free article] [PubMed] [Google Scholar]
- 33.Kazakia GJ, Hyun B, Burghardt AJ, Krug R, Newitt DC, de Papp AE, Link TM, Majumdar S. In vivo determination of bone structure in postmenopausal women: a comparison of HR-pQCT and high-field MR imaging. J Bone Miner Res. 2008;23:463–74. doi: 10.1359/jbmr.071116. [DOI] [PubMed] [Google Scholar]
- 34.Buie HR, Campbell GM, Klinck RJ, MacNeil JA, Boyd SK. Automatic segmentation of cortical and trabecular compartments based on a dual threshold technique for in vivo micro-CT bone analysis. Bone. 2007;41:505–15. doi: 10.1016/j.bone.2007.07.007. [DOI] [PubMed] [Google Scholar]
- 35.Burghardt AJ, Buie HR, Laib A, Majumdar S, Boyd SK. Reproducibility of direct quantitative measures of cortical bone microarchitecture of the distal radius and tibia by HR-pQCT. Bone. 2010;47:519–28. doi: 10.1016/j.bone.2010.05.034. [DOI] [PMC free article] [PubMed] [Google Scholar]
- 36.MacNeil JA, Boyd SK. Accuracy of high-resolution peripheral quantitative computed tomography for measurement of bone quality. Med Eng Phys. 2007;29:1096–105. doi: 10.1016/j.medengphy.2006.11.002. [DOI] [PubMed] [Google Scholar]
- 37.Burghardt AJ, Kazakia GJ, Ramachandran S, Link TM, Majumdar S. Age- and gender-related differences in the geometric properties and biomechanical significance of intracortical porosity in the distal radius and tibia. J Bone Miner Res. 2010;25:983–93. doi: 10.1359/jbmr.091104. [DOI] [PMC free article] [PubMed] [Google Scholar]
- 38.Davis KA, Burghardt AJ, Link TM, Majumdar S. The effects of geometric and threshold definitions on cortical bone metrics assessed by in vivo high-resolution peripheral quantitative computed tomography. Calcif Tissue Int. 2007;81:364–71. doi: 10.1007/s00223-007-9076-3. [DOI] [PubMed] [Google Scholar]
- 39.Mueller TL, Christen D, Sandercott S, Boyd SK, van Rietbergen B, Eckstein F, Lochmuller EM, Muller R, van Lenthe GH. Computational finite element bone mechanics accurately predicts mechanical competence in the human radius of an elderly population. Bone. 2011;48:1232–8. doi: 10.1016/j.bone.2011.02.022. [DOI] [PubMed] [Google Scholar]
- 40.Boutroy S, Van Rietbergen B, Sornay-Rendu E, Munoz F, Bouxsein ML, Delmas PD. Finite element analysis based on in vivo HR-pQCT images of the distal radius is associated with wrist fracture in postmenopausal women. J Bone Miner Res. 2008;23:392–9. doi: 10.1359/jbmr.071108. [DOI] [PubMed] [Google Scholar]
- 41.Liu XS, Zhang XH, Sekhon KK, Adams MF, McMahon DJ, Bilezikian JP, Shane E, Guo XE. High-resolution peripheral quantitative computed tomography can assess microstructural and mechanical properties of human distal tibial bone. J Bone Miner Res. 2010;25:746–56. doi: 10.1359/jbmr.090822. [DOI] [PMC free article] [PubMed] [Google Scholar]
- 42.Armbrecht G, Belavy DL, Backstrom M, Beller G, Alexandre C, Rizzoli R, Felsenberg D. Trabecular and cortical bone density and architecture in women after 60 days of bed rest using high-resolution pQCT: WISE 2005. J Bone Miner Res. 2011;26:2399–410. doi: 10.1002/jbmr.482. [DOI] [PubMed] [Google Scholar]
- 43.Belavy DL, Beller G, Ritter Z, Felsenberg D. Bone structure and density via HR-pQCT in 60d bed-rest, 2-years recovery with and without countermeasures. J Musculoskelet Neuronal Interact. 2011;11:215–26. [PubMed] [Google Scholar]
- 44.Tjong W, Kazakia GJ, Burghardt AJ, Majumdar S. The effect of voxel size on high-resolution peripheral computed tomography measurements of trabecular and cortical bone microstructure. Med Phys. 2012;39:1893–903. doi: 10.1118/1.3689813. [DOI] [PMC free article] [PubMed] [Google Scholar]
- 45.Laib A, Hauselmann HJ, Ruegsegger P. In vivo high resolution 3D-QCT of the human forearm. Technol Health Care. 1998;6:329–37. [PubMed] [Google Scholar]
- 46.Hildebrand T, Laib A, Müller R, Dequeker J, Rüegsegger P. Direct three-dimensional morphometric analysis of human cancellous bone: microstructural data from spine, femur, iliac crest, and calcaneus. Journal of Bone and Mineral Research. 1999;14:1167–74. doi: 10.1359/jbmr.1999.14.7.1167. [DOI] [PubMed] [Google Scholar]
- 47.Laib A, Hildebrand T, Häuselmann HJ, Rüegsegger P. Ridge number density: a new parameter for in vivo bone structure analysis. Bone. 1997;21:541–6. doi: 10.1016/s8756-3282(97)00205-6. [DOI] [PubMed] [Google Scholar]
- 48.Laib A, Ruegsegger P. Calibration of trabecular bone structure measurements of in vivo three-dimensional peripheral quantitative computed tomography with 28-microm-resolution microcomputed tomography. Bone. 1999;24:35–9. doi: 10.1016/s8756-3282(98)00159-8. [DOI] [PubMed] [Google Scholar]
- 49.Parfitt AM. The physiologic and clinical significance of bone histomorphometric data. In: Recker RR, editor. Bone histomorphometry: techniques and interpretation. Boca Raton, FL: CRC Press; 1983. pp. 143–223. [Google Scholar]
- 50.Hildebrand T, Rüegsegger P. A new method for the model-independent assessment of thickness in three-dimensional images. Journal of Microscopy. 1997;185:67–75. [Google Scholar]
- 51.Tjong W, Nirody J, Burghardt AJ, Carballido-Gamio J, Kazakia GJ. Structural analysis of cortical porosity applied to HR-pQCT data. Med Phys. 2014;41:013701. doi: 10.1118/1.4851575. [DOI] [PMC free article] [PubMed] [Google Scholar]
- 52.Jordan GR, Loveridge N, Bell KL, Power J, Rushton N, Reeve J. Spatial clustering of remodeling osteons in the femoral neck cortex: a cause of weakness in hip fracture? Bone. 2000;26:305–13. doi: 10.1016/s8756-3282(99)00272-0. [DOI] [PubMed] [Google Scholar]
- 53.Malandain G, Bertrand G, Ayache N. Topological Segmentation of Discrete Surfaces. International Journal of Computer Vision. 1993;10:183–197. [Google Scholar]
- 54.Stauber M, Muller R. Volumetric spatial decomposition of trabecular bone into rods and plates--a new method for local bone morphometry. Bone. 2006;38:475–84. doi: 10.1016/j.bone.2005.09.019. [DOI] [PubMed] [Google Scholar]
- 55.Manzanera A, Bernard TM, Preteux F, Longuet B. Medial faces from a concise 3D thinning algorithm. Proceeds of the 7th IEEE International Conference on Computer Vision; 1999. pp. 337–343. [Google Scholar]
- 56.Sode M, Burghardt AJ, Kazakia GJ, Link TM, Majumdar S. Regional variations of gender-specific and age-related differences in trabecular bone structure of the distal radius and tibia. Bone. 2010;46:1652–60. doi: 10.1016/j.bone.2010.02.021. [DOI] [PMC free article] [PubMed] [Google Scholar]
- 57.Kazakia GJ, Nirody JA, Bernstein G, Sode M, Burghardt AJ, Majumdar S. Age- and gender-related differences in cortical geometry and microstructure: Improved sensitivity by regional analysis. Bone. 2013;52:623–31. doi: 10.1016/j.bone.2012.10.031. [DOI] [PMC free article] [PubMed] [Google Scholar]
- 58.Burghardt AJ, Kazakia GJ, Sode M, de Papp AE, Link TM, Majumdar S. A longitudinal HR-pQCT study of alendronate treatment in postmenopausal women with low bone density: Relations among density, cortical and trabecular microarchitecture, biomechanics, and bone turnover. J Bone Miner Res. 2010;25:2558–71. doi: 10.1002/jbmr.157. [DOI] [PMC free article] [PubMed] [Google Scholar]
- 59.Cervinka T, Rittweger J, Hyttinen J, Felsenberg D, Sievanen H. Anatomical sector analysis of load-bearing tibial bone structure during 90-day bed rest and 1-year recovery. Clin Physiol Funct Imaging. 2011;31:249–57. doi: 10.1111/j.1475-097X.2011.01009.x. [DOI] [PubMed] [Google Scholar]
- 60.Müller R, Ruegsegger P. Three-dimensional finite element modelling of non-invasively assessed trabecular bone structures. Medical Engineering and Physics. 1995;17:126–33. doi: 10.1016/1350-4533(95)91884-j. [DOI] [PubMed] [Google Scholar]
- 61.Macneil JA, Boyd SK. Bone strength at the distal radius can be estimated from high-resolution peripheral quantitative computed tomography and the finite element method. Bone. 2008;42:1203–13. doi: 10.1016/j.bone.2008.01.017. [DOI] [PubMed] [Google Scholar]
- 62.Tjong W, Nirody J, Carballido-Gamio J, Burghardt A, Patsch JM, Majumdar S, Kazakia G. Longitudinal Analysis of Cortical Pore Structure Using HR-pQCT. American Society for Bone and Mineral Research; Minneapolis, MN: 2012. [Google Scholar]
- 63.Gross TS, Damji AA, Judex S, Bray RC, Zernicke RF. Bone hyperemia precedes disuse-induced intracortical bone resorption. J Appl Physiol. 1999;86:230–5. doi: 10.1152/jappl.1999.86.1.230. [DOI] [PubMed] [Google Scholar]
- 64.Alexandre C, Vico L. Pathophysiology of bone loss in disuse osteoporosis. Joint Bone Spine. 2011;78:572–6. doi: 10.1016/j.jbspin.2011.04.007. [DOI] [PubMed] [Google Scholar]
- 65.Jamal SA, Hamilton CJ. Nitric oxide donors for the treatment of osteoporosis. Curr Osteoporos Rep. 2012;10:86–92. doi: 10.1007/s11914-011-0087-7. [DOI] [PubMed] [Google Scholar]
- 66.Khosla S. Is nitroglycerin a novel and inexpensive treatment for osteoporosis? JAMA. 2011;305:826–7. doi: 10.1001/jama.2011.191. [DOI] [PMC free article] [PubMed] [Google Scholar]
- 67.Rittweger J, Felsenberg D. Recovery of muscle atrophy and bone loss from 90 days bed rest: results from a one-year follow-up. Bone. 2009;44:214–24. doi: 10.1016/j.bone.2008.10.044. [DOI] [PubMed] [Google Scholar]
- 68.Uebelhart D, Bernard J, Hartmann DJ, Moro L, Roth M, Uebelhart B, Rehailia M, Mauco G, Schmitt DA, Alexandre C, Vico L. Modifications of bone and connective tissue after orthostatic bedrest. Osteoporos Int. 2000;11:59–67. doi: 10.1007/s001980050007. [DOI] [PubMed] [Google Scholar]
- 69.Eser P, Frotzler A, Zehnder Y, Wick L, Knecht H, Denoth J, Schiessl H. Relationship between the duration of paralysis and bone structure: a pQCT study of spinal cord injured individuals. Bone. 2004;34:869–80. doi: 10.1016/j.bone.2004.01.001. [DOI] [PubMed] [Google Scholar]
- 70.Stallard J, Dounis E, Major RE, Rose GK. One leg swing through gait using two crutches. An analysis of the ground reaction forces and gait phases. Acta Orthop Scand. 1980;51:71–7. doi: 10.3109/17453678008990771. [DOI] [PubMed] [Google Scholar]
- 71.Nishiyama KK, Macdonald HM, Buie HR, Hanley DA, Boyd SK. Postmenopausal women with osteopenia have higher cortical porosity and thinner cortices at the distal radius and tibia than women with normal aBMD: an in vivo HR-pQCT study. J Bone Miner Res. 2010;25:882–90. doi: 10.1359/jbmr.091020. [DOI] [PubMed] [Google Scholar]
- 72.Macdonald HM, Nishiyama KK, Kang J, Hanley DA, Boyd SK. Age-related patterns of trabecular and cortical bone loss differ between sexes and skeletal sites: a population-based HR-pQCT study. J Bone Miner Res. 2011;26:50–62. doi: 10.1002/jbmr.171. [DOI] [PubMed] [Google Scholar]
Associated Data
This section collects any data citations, data availability statements, or supplementary materials included in this article.