Abstract
In this study, we developed a prototype animal PET by applying several novel technologies to use the solid-state photomultiplier (SSPM) arrays for measuring the depth-of-interaction (DOI) and improving imaging performance. Each PET detector has an 8×8 array of about 1.9×1.9×30.0 mm3 lutetium-yttrium-oxyorthosilicate (LYSO) scintillators, with each end optically connected to a SSPM array (16-channel in a 4×4 matrix) through a light guide to enable continuous DOI measurement. Each SSPM has an active area of about 3×3 mm2, and its output is read by a custom-developed application-specific-integrated-circuit (ASIC) to directly convert analog signals to digital timing pulses that encode the interaction information. These pulses are transferred to and be decoded by a field-programmable-gate-array (FPGA) based time-to-digital convertor for coincident event selection and data acquisition. The independent readout of each SSPM and the parallel signal process can significantly improve the signal-to-noise ratio and enable using flexible algorithms for different data processes. The prototype PET consists of two rotating detector panels on a portable gantry with four detectors in each panel to provide 16 mm axial and variable transaxial field-of-view (FOV) sizes. List-mode ordered-subset-expectation-maximization image reconstruction was implemented. The measured mean energy, coincidence timing, and DOI resolution for a crystal were about 17.6%, 2.8 ns, and 5.6 mm, respectively. The measured transaxial resolutions at the center of the FOV were 2.0 mm and 2.3 mm for images reconstructed with and without DOI, respectively. In addition, the resolutions across the FOV with DOI were substantially better than those without DOI. The quality of PET images of both a hot-rod phantom and mouse acquired with DOI was much higher than that of images obtained without DOI. This study demonstrates that SSPM arrays and advanced readout/processing electronics can be used to develop a practical DOI-measureable PET scanner.
Keywords: Positron emission tomography, Depth of interaction, Image resolution uniformity, Solid-state photomultiplier, Parallel readout electronics
1. Introduction
Measurement of depth-of-interaction (DOI) is critically important for a PET scanner with compact geometry to simultaneously achieve high, uniform resolution across the entire field-of-view (FOV) and high sensitivity (Cherry et al., 2003, Bailey et al., 2005). After 2 decades of investigation with different technologies and designs (Bartzakos and Thompson, 1991, Moses and Derenzo, 1994, MacDonald and Dahlbom, 1998, Miyaoka et al., 1998, Murayama et al., 1998, Yamamoto and Ishibashi, 1998, Seidel et al., 2003, Yang et al., 2006, Ling et al., 2007, Maas et al., 2009, Peng and Levin, 2010, van Dam et al., 2011, Yoshida et al., 2012, Yoshida et al., 2013), this remains an active research area, and development of a practical DOI-measurable PET with balanced performance in applications under normal operating conditions remains technically challenging.
A dual-ended scintillator (DES) readout measures DOI by coupling both ends of a pixilated scintillator array to a photon sensor and calculating the ratio of measured signals from the two ends to estimate the DOI position (Moses et al., 1995). This method has the benefits of continuous DOI measurement and increased total light output at the cost of reading both crystal ends. Researchers have made considerable progress with DES designs in developing prototype PET detectors and systems (Wang et al., 2004, Shao et al., 2002, Burr et al., 2004, Godinez et al., 2012, Yang et al., 2008), although they must be developed further for practical applications. One major technical challenge to DES design is the performance limit of available photon sensors. A conventional photomultiplier tube is bulky, has a large insensitive area, and nonuniform gains across the photocathode. Also, use of an avalanche photodiode (APD) requires sophisticated, expensive readout electronics owing to an intrinsically low signal-to-noise ratio (SNR) and relatively large insensitive area at the device edge (for both an APD array and a position-sensitive APD) (Zhang et al., 2007, Yang et al., 2009). These issues have posed challenges to use these photon sensors for developing a DOI-measureable PET.
Recent rapid development of solid-state photomultiplier (SSPM) arrays has provided another choice of photon sensors for DES design (Herbert et al., 2006, Shao et al., 2007, Schaart et al., 2009, Yamaya et al., 2011, Seifert et al., 2013). With their high amplification gain, compact size, small insensitive area at the device edge, stable performance, and low voltage bias, SSPM arrays can, in principle, perform much better than APD in DES design. However, an SSPM has a relatively high dark-count noise, which may severely worsen detector performance (in particular, the coincidence timing resolution) when signals of multiple SSPMs are summed together for event timing and energy measurement (Shao and Li, 2007, Downie et al., 2013, Goertzen et al., 2013). For development of an SSPM array-based, high-performance PET detector, suitable readout electronics that can minimize noise and thus enhance the SNR for improved performance is critical. Among different technical approaches, reading out each SSPM individually is the best because it not only has minimal noise, leading to an optimal SNR, but also enables parallel signal readout and processing that can provide flexible algorithms for adapting different detector configurations or applying different event signal-processing methods for different application needs. However, an electronics system capable of handling very large number of individual SSPM channels was not available previously, and it remains technically challenging to develop.
To overcome these existing technical challenges in using SSPM arrays for PET development, we have recently developed various technologies that include the development of compact PET detectors by coupling scintillator arrays to SSPM arrays with specially designed light guides, ASIC-based front-end electronics to read out each individual SSPM, and simplified system electronics with time-based signal processing and data acquisition. Herein we describe our design, development, and evaluation of a DOI-measureable small-animal prototype PET using these newly developed technologies.
2. Material and methods
2.1. Prototype PET with DOI-Measurement Capability
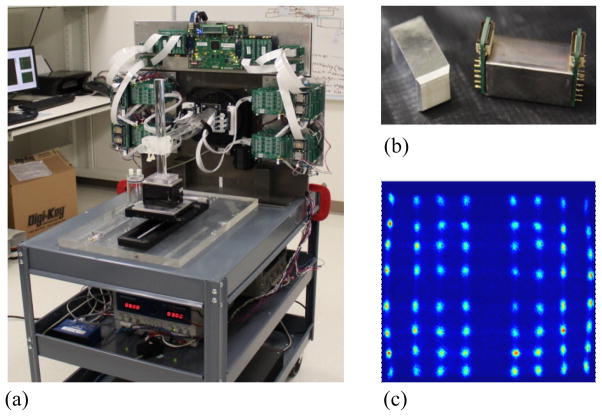
The design of the prototype PET scanner was based on the newly developed PET detectors that can measure DOI under normal operating conditions in a practical tomographic setting (figure 1a). At the center of each detector module in the prototype is an 8×8 array of lutetium-yttrium-oxyorthosilicate (LYSO) scintillators, each measuring about 1.9×1.9 ×30.0 mm3, with corresponding pitches of about 2 mm and an overall detection area of around 16×16 mm2. Each crystal has saw-cut surfaces along four 30-mm-long sides and polished at both ends. The inter-crystal reflectors (enhanced specular reflector, or ESR film; 3M) are 60 μm thick. These reflectors are glued to two sides of each crystal along the same direction to hold the crystals together but coupled with the other two sides of each crystal without glue (preserving an air gap between the reflector and crystal surface) to improve the DOI resolution. The LYSO arrays are read out at both crystal ends using a 4×4 array of SSPMs (SMPArray4; SensL) through a light guide (figure 1b). The overall size of each SSPM array is 15.3×15.8 mm2. Each SSPM has a physical size of 3.16×3.16 mm2 and an active area of 2.85×2.85 mm2. The inter-SSPM gap is 0.2 mm. A custom-made light guide with a specially designed geometry and pattern of grooves distributes the scintillation light from each individual LYSO crystal to the SSPM array with controlled light sharing to separate all of the crystals in a flood histogram without significant light loss (figure 1c). The LYSO array, light guides, and SSPM arrays are optically glued together and sealed inside thin black tape to form a light-tight detector module, allowing for operation of it at room temperature in an ambient environment.
Figure 1.
Images of (a) the prototype PET scanner, (b) a detector consisting of an LYSO array, light guide, and SSPM, and (c) the flood-source crystal map of a detector. A schematic view of detector and scanner is shown in figure 2.
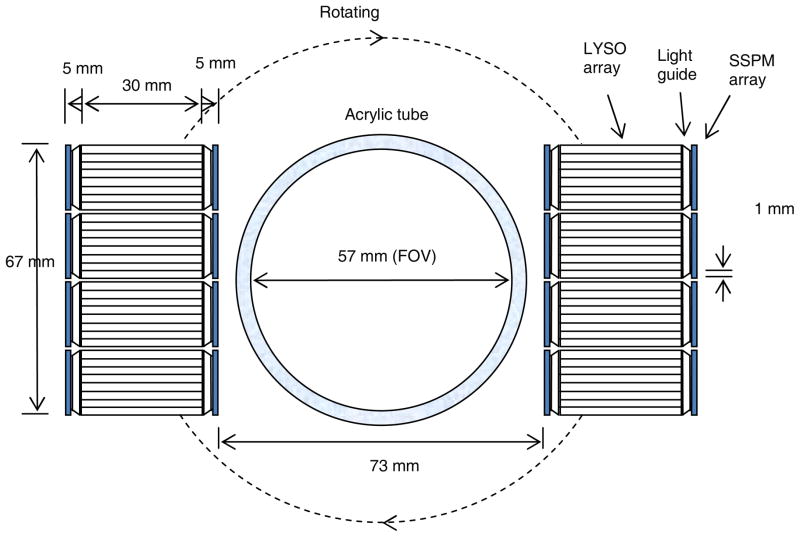
The scanner is installed on a portable cart that contains two detector panels mounted on a rotation table, acquisition electronics boards, an animal bed, and power supplies (figure 1a). Both detector panels comprise four detector modules linearly packed together with 1-mm inter-module gaps. The two detector panels are placed with their faces parallel to each other. The scanner also has 8 crystal planes (equivalent to crystal rings in cylindrical system geometry) along the axial direction and 64 crystals in each plane. The detector panel-to-panel distance is adjustable, with a transaxial FOV of up to about 60×60 mm2 (figure 2). The maximum axial FOV is 15 mm. The voltage supply to each SSPM array is individually adjustable to a nominal level of around 32.0 V to balance the amplification gains among the SSPM arrays. All electronics boards are mounted close to the detectors to minimize the noise resulting from signal transmissions between the detector and readout electronics boards through 16-inch flex cables. The animal bed can move axially for multi-bed acquisitions with a 0.1 mm precision.
Figure 2.
Schematic view of the prototype PET scanner configured with two rotating detector panels. Each detector panel consists of 4 detectors with dual-scintillator-end SSPM readout. The acrylic tube was used for animal imaging only.
2.2. ASIC-Based Parallel Readout Electronics and Data Acquisition
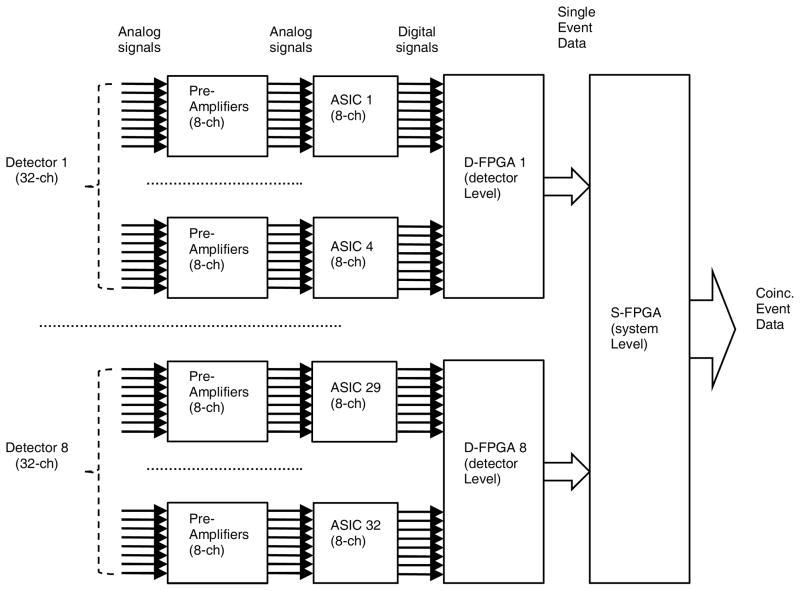
A challenging issue in using SSPM arrays in PET applications is the high-level noise dominated by dark counts, which may severely degrade the timing resolution and other aspects of detector performance. The best technical solution for this is a parallel signal readout/processing scheme that reads each SSPM individually and processes the corresponding signals independently without adding noise from other SSPMs, resulting in the best possible SNR. Dedicated Application-Specific-Integrated-Circuit (ASIC) electronics designed for this application was developed by our group (Deng et al., 2011). This eight-channel ASIC directly converts output analog signals from each SSPM to digital timing pulses that encode the gamma-interaction information of position, energy, and arrival timing. These pulses are transferred to Field-Programmable-Gate-Array (FPGA) based time-digital convertor (TDC) and are decoded to measure the signal energy and timing corresponding to each SSPM. In addition to minimizing noise, this parallel readout approach enables the use of different event-calculation algorithms in FPGA programming to enhance the detector performance or increase the flexibility for different detector configurations.
Each detector module has one detector-level FPGA (D-FPGA) for decoding of the digital timing pulses and processing of single-interaction events (singles). The intrinsic timing accuracy of the TDC is 312.5 ps as determined according to the effective clock frequency at 3.2 GHz. The coincident event is selected by a system-level FPGA (S-FPGA) that communicates with all D-FPGAs and acquires and transfers data (figure 3). All signals are transferred from the detectors to front-end readout electronics and the data-processing board via flat ribbon cables.
Figure 3.
Schematic view of signal processing and data acquisition of the prototype PET scanner.
2.3. System Calibration and Data Processing
The major instrumentation calibrations included standard detector uniformity and normalization, time alignment among different channels, and time-walk-error correction based on application of a predetermined time-energy relationship (Sun et al., 2011).
A 22Na point source (t1/2 = 2.61 years, Eavgβ+ = 216 keV) was used to irradiate each detector panel for detector normalization, with an average of 16 million accumulated total counts per detector. A uniform cylindrical phantom (45 mm diameter, 20 mm axial length) filled with 18F at an intensity of 13.1 MBq was imaged at the center of the FOV (CFOV) for system sensitivity normalization.
The data acquisition of the prototype PET scanner includes two steps. During the online acquisition, the scanner recorded all interaction energy and timing information of a coincident event from all involved SSPM channels in the list-mode. The timing of the event was approximated by the earliest trigged single-channel signal timing among all signal timings. A coarse 50 ns timing window was applied to acquire the online coincident events. After the online acquisition, data corrections were applied and more accurate event timing was calculated offline based on energy-weighted method as described in the following. A finer 6 ns timing window was applied to select final prompt coincident events. Random events were subtracted from these prompt coincident events based on the random event rate measured from a delayed timing window.
The event energy (E) is the sum of energies E1 and E2 measured using SSPM arrays 1 and 2 at the two ends of the LYSO array:
| (1) |
in which Ei is the energy of an individual SSPM measured with its signal amplitude greater than the signal acquisition threshold.
The event timing is calculated based on the energy-weighted sum of timings over all SSPMs:
| (2) |
in which ti is the timing of an individual SSPM measured in the same event. This energy-weighted event timing provided the best coincidence timing resolution in our initial studies.
The crystal of interaction is identified by calculating the energy-weighted event positions:
| (3) |
in which xi and yi are the positions of individual SSPMs along x and y directions, respectively.
The ratio of signals measured using SSPM arrays 1 and 2 for each event is calculated as follows:
| (4) |
The signal ratio R is then converted to DOI using a method based on LYSO scintillator background radiation developed in our laboratory (Shao et al., 2008, Bircher and Shao, 2012b).
A list-mode-based OSEM image reconstruction algorithm (Reader et al., 2002) was implemented. Each OSEM subset was simply an equal fraction of total accumulated events divided in sequential list-mode order without other constraints. An image-resolution smoothing (1.5 mm) was applied after each iteration to partially compensate for nonuniform image resolution from the flat-panel, rectangular system configuration. The image reconstruction was implemented on a graphics processing unit platform (CUDA; NVIDIA) to accelerate the reconstruction. Images obtained without use of DOI were also reconstructed for comparison. A simulation-generated three-dimensional sensitivity map was validated using premeasured phantom data and used in image reconstruction to compensate for sensitivity variations across the FOV.
2.4. Detector Performance Measurement
Crystal Identification and Energy Resolution
For each detector module, a flood-source crystal map was acquired from an external 137Cs source (mono-energy peak, 662 keV) and used to draw boundaries among crystals for initial crystal identification. A second flood-source crystal map was acquired from an external 22Na source and used to calibrate the energy scales associated with each crystal by applying both 511 and 662 keV peaks from the acquired energy spectra. After the energy-scale calibration, an energy window (400–650 keV) was applied to the second map to create the final crystal map for a crystal lookup table. The crystal of each interaction was selected from this crystal map, and the corresponding DOI position was calculated according to the signal ratio R measured from two SSPM arrays.
Coincidence Timing, Energy, and DOI Resolutions
These detector-level resolutions were measured using an external electronic collimation method to select interactions within a narrow DOI region (Moses et al., 1995, Shao et al., 2007). An extra single-channel detector consisting of a 1×1×10 mm3 LYSO crystal coupled with an SSPM was used to collimate the DOI of the detector module to be measured with a 22Na disk source (1 mm thickness, 5 mm diameter) placed between them. The small LYSO crystal was precisely aligned with its long axis within the disk-source plane to provide a thin fan beam to irradiate a narrow DOI region for several crystals inside the detector module. The extra detector and 22Na source were stepped together from one end of the detector module to the other end at different crystal depths, and the signals from the detector module were measured for the events they were coincident with both detectors. Measurements from different sides of the detector module were conducted to measure all of the crystals in the detector module. Each crystal was selected according to the crystal lookup table, and the energy, coincidence timing, and DOI resolutions were calculated from data obtained at different DOI positions.
The system-level timing resolution was measured by acquiring coincident events between the two detector modules in different detector panels with their front ends facing each other and a 22Na point source in the middle between them. A pair of crystals in the two detector modules was selected to measure the crystal-level coincidence timing spectrum and resolution.
2.5. Image Resolution
The spatial resolution of reconstructed images was measured using a 7.7 MBq 22Na point source that was about 1 mm in diameter and embedded in a polymethyl methacrylate (Lucite) disk measuring 25 mm in diameter and 5 mm in height (Eckert & Ziegler Isotope Products). The 22Na point source was suspended in air and stepped at 0.5 mm increments in the radial direction in the plane across the center of the rotating axis, with the radial offset from the CFOV ranging from 0 to 25 mm. The crystal-to-crystal distance between the two detector panels was fixed at 86.6 mm. Tomographic data were acquired in list mode at each point source position: two detector panels were rotated 18 equal views (angles) over 360°, data were acquired for 15 sec at each view, and events were selected with a 6-ns timing window and 400 to 650 keV energy window offline. A filtered back-projection (FBP) algorithm with ramp filter was used to reconstruct each image with DOI or without DOI (binning all interactions inside each crystal to a fixed DOI position). The DOI information was incorporated to a sinogram with an established method (Xia et al., 2011) to enable using the same FBP code for both with and without DOI image reconstructions. The radial, tangential, and axial resolutions of the reconstructed images were measured by fitting Gaussian functions to the respective profiles of projected images along the center of the mass of the reconstructed images, and quadratically subtracting the size of the point source from the fitted full-width at half-maximum (FWHM).
2.6. Initial Imaging Studies
Phantom Study
A hot-rod phantom (Ultra Micro Hot Spot Phantom; Data Spectrum Corporation) was filled with 9.3 MBq of 18F and imaged in 18 views over 360° with a 2-min acquisition time at each view and 7.6 million counts overall after all data selection and correction. The hot rod diameters were 0.75, 1.00, 1.35, 1.70, 2.00, and 2.40 mm, with a rod-to-rod distance twice the respective rod diameters.
Animal Study
The institutional and national guide for the care and use of laboratory animals was followed. The conducted animal imaging studies were approved by the Institutional Animal Care and Use and Committee. An acrylic tube was placed between the two opposing detector panels for shielding the animal from flex cables during detector rotations. The crystal-to-crystal distance between the two detector panels was increased to 83 mm. A 24-g nude mouse was intravenously injected through tail vein with about 17.5 MBq of 18F-FDG. The uptake time was 20 min before the imaging. The animal was placed in prone position for imaging, with isoflurane (0.5%–2.5%) in oxygen for anesthesia. Owing to a limited axial FOV, data were acquired for seven bed positions with a 10.25 mm inter-bed distance to cover the majority of the mouse body. Data were acquired at each bed position with 20 views over 360° and for 1 min at each view, and overall, 18 million counts were used in image reconstruction after selection and correction of all data. Immediately after imaging using the prototype PET scanner, the mouse was imaged for 15 min using a commercially available small animal PET scanner (Inveon, IAW 1.5; Siemens Healthcare), which has a 12.7 cm axial FOV and approximately 1.5 mm resolution at the CFOV. The data were subsequently reconstructed using a scanner’s three-dimensional OSEM reconstruction software. The images acquired using the prototype scanner were then compared qualitatively with the images acquired using the commercial small animal scanner to preliminarily validate the animal imaging capability of the prototype scanner.
For both phantom and animal studies, the energy and coincident timing windows of the prototype scanner were set at 400–650 keV and 6 ns, respectively. Also, changes in count rate owing to isotope decay over the acquisitions at different views and bed positions were corrected. Detector normalization, random event subtraction, and attenuation corrections were performed in both studies. During these studies, only ambient room temperature control was used to stabilize the system performance.
3. Results
3.1. Detector Performance
Crystal Identification
The flood-source crystal map created using signals measured from both SSPM arrays over the entire DOI region is shown in figure 1c. All 64 crystals are well separated, with an average peak-to-valley ratio greater than 3:1. The differences in the maps at different DOI positions (not shown) are negligible, demonstrating crystal identification was independent of crystal depth. This is one of the benefits of individual SSPM readouts without signal multiplexing.
Energy Resolution
The 22Na energy spectrum of a typical crystal is shown in figure 4a. The measured energy resolutions (FWHM) for all crystals in an LYSO array over different DOI positions ranged from 14.6% to 26.0%, with an average value of 17.6%. Results of energy resolutions over all of the crystals are summarized in Table 1.
Figure 4.
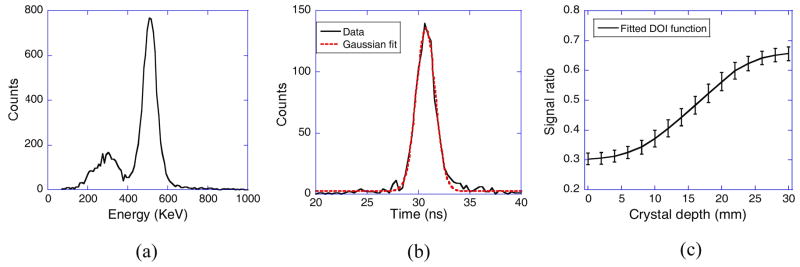
Measured single crystal (a) energy and (b) coincidence time spectra, and (c) DOI function with error bars related to DOI resolutions.
Table 1.
Crystal Energy Resolution (FWHM) Over All Crystals and Crystal Depths
| Depth (mm) | Energy resolution (%)
|
|||||
|---|---|---|---|---|---|---|
| All crystals | Central crystal | Edge crystal | Corner crystal | |||
|
| ||||||
| Average | Minimum | Maximum | Average | Average | Average | |
| 6 | 17.9 | 15.1 | 25.3 | 16.3 | 20.0 | 24.0 |
| 12 | 17.7 | 14.4 | 24.9 | 16.0 | 20.0 | 23.7 |
| 18 | 17.0 | 14.1 | 25.3 | 15.5 | 18.8 | 24.1 |
| 24 | 17.6 | 14.6 | 26.0 | 15.8 | 19.7 | 24.4 |
Coincidence Timing Resolution
figure 4b shows the coincidence timing spectra between a pair of crystals. The average crystal and system timing resolutions (FWHM) were 2.8 ns and 3.2 ns, respectively. Results of timing resolutions over all of the crystals and DOI positions in a detector module are summarized in Table 2. We calculated the timing resolutions using an energy-weighted event-timing method as illustrated in Eq. 2.
Table 2.
Coincidence timing resolution (FWHM) over all crystals and crystal depths
| Depth (mm) | Timing resolution (ns)
|
|||||
|---|---|---|---|---|---|---|
| All crystals | Central crystal | Edge crystal | Corner crystal | |||
|
| ||||||
| Average | Minimum | Maximum | Average | Average | Average | |
| 6 | 2.9 | 2.5 | 3.6 | 2.8 | 2.9 | 3.1 |
| 12 | 2.9 | 2.5 | 4.1 | 2.9 | 3.0 | 3.4 |
| 18 | 2.7 | 2.4 | 3.3 | 2.7 | 2.8 | 2.7 |
| 24 | 2.8 | 2.4 | 3.6 | 2.8 | 2.9 | 3.0 |
DOI Resolution
The measured DOI function and variations for a typical scintillator is shown in figure 4c. For crystals located at the central, edge, and corner regions of the LYSO array, the mean DOI resolutions over all DOI positions were 5.7 mm, 5.5 mm, and 5.0 mm, respectively. The DOI resolutions ranged from 3.6 mm to 7.2 mm for all crystals over all of their depths, with an average value of 5.6 mm. Results of DOI resolution measurements are summarized in Table 3.
Table 3.
DOI resolution over all crystals and crystal depths
| Depth (mm) | DOI resolution (mm)
|
|||||
|---|---|---|---|---|---|---|
| All crystals | Central crystal | Edge crystal | Corner crystal | |||
|
| ||||||
| Average | Minimum | Maximum | Average | Average | Average | |
| 6 | 4.5 | 3.6 | 5.5 | 4.4 | 4.8 | 4.4 |
| 12 | 5.5 | 4.3 | 6.8 | 5.8 | 5.1 | 4.9 |
| 18 | 6.2 | 5.2 | 7.2 | 6.3 | 6.2 | 5.4 |
| 24 | 6.1 | 4.7 | 7.1 | 6.4 | 5.8 | 5.4 |
3.2. Spatial Resolution and sensitivity
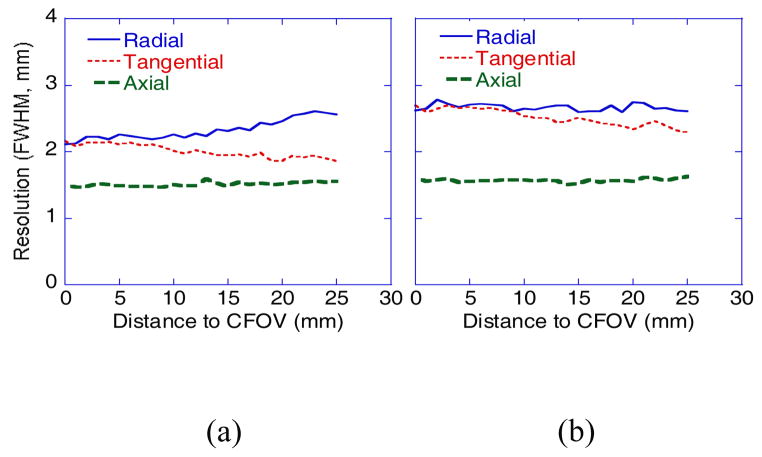
Figure 5 shows measured spatial resolutions (FWHM) of the 22Na point source measured along the radial, tangential and axial directions over different offsets across the FOV with images reconstructed with and without DOI information. With the DOI information, the radial resolution degraded slightly from the CFOV to the edge (2.1 mm to 2.6 mm), whereas the tangential resolution improved slightly (2.2 mm to 1.9 mm), and the axial resolution remained about the same (1.5 mm to 1.6 mm). In comparison, without the DOI information, the transaxial resolutions were worsened severely, with the radial resolutions remained around 2.6 mm, the tangential resolution changed from 2.7 mm to 2.3 mm, whereas the axial resolution remained about the same (1.6 mm to 1.7 mm). Overall, we observed resolution improvement along transaxial directions with the DOI information. Due to the small axial FOV, the DOI impact to the axial resolution was minor.
Figure 5.
Spatial resolutions measured with reconstructed images of a 22Na point source at different FOV offset positions (a) with and (b) without DOI.
The system sensitivities measured with the 22Na point source at different transaxial and axial positions are shown in figure 6. Peak sensitivities of 4.6% and 12.0% were achieved at the CFOV with or without applying a 400–650 keV energy window. The system sensitivity can be adjusted by have a different distance between the two detector panels.
Figure 6.
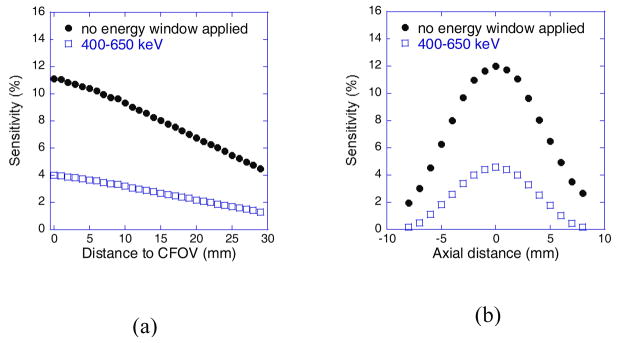
System sensitivity measured with a 22Na source at different (a) transaxial positions and (b) axial positions. The measured peak sensitivities in (a) were slightly lower than the ones in (b) due to the fact that the transaxial positions in the measurement were slightly off from the exact central axial plane.
3.3. Initial Imaging Studies
Phantom Study
Transverse images of the hot-rod phantom were reconstructed with and without DOI information from the same acquired data (figure 7). The image reconstructed with DOI information had no noticeable artifacts. As expected, we observed very little degradation of the resolution or image quality within the FOV that encompassed the hot rods. Rods with diameters as small as 1.7 mm can be visually resolved. In comparison, the quality of the image reconstructed without DOI information was severely deteriorated, including noticeable artifacts and reduced contrast at the central regions.
Figure 7.
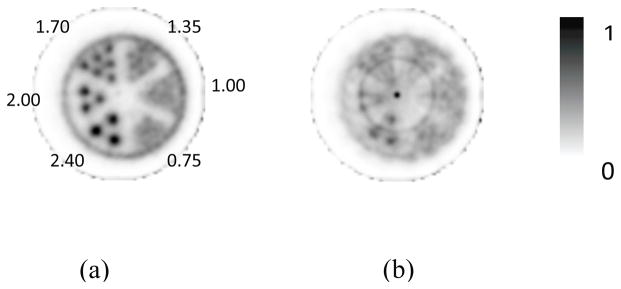
Images of a hot-rod phantom reconstructed (a) with and (b) without DOI information. Total 40 subsets and 1 iteration were used in the OSEM image reconstructions.
Animal Study
Figure 8 shows the images of the mouse acquired using the prototype PET scanner and reconstructed with and without DOI information. As expected, the quality of the images reconstructed with DOI information was superior to that of the images reconstructed without DOI information. The images reconstructed with DOI information clearly reveal myocardial uptake of the radiotracers without any of the distortions or artifacts in the images reconstructed without DOI information. Figure 9 shows the mouse images acquired using the prototype and commercial PET scanners, respectively, exhibiting similar image quality and validate qualitatively the animal image acquired from the prototype PET scanner.
Figure 8.

Images of a mouse acquired using the prototype PET scanner. Transverse, coronal, and sagittal slices are shown from left to right in each panel for images reconstructed (a) with and (b) without DOI. Total 16 subsets and 4 iterations were used in the OSEM image reconstructions.
Figure 9.

Images of a mouse acquired using the (a) prototype and (b) commercial animal PET scanners. Transverse, coronal, and sagittal slices are shown from left to right in each panel. Total 16 subsets and 4 iterations were used in the OSEM image reconstructions.
4. Discussion
The DOI resolution measured from a single LYSO scintillator was about 2 mm (Bircher and Shao, 2012a), which is much better than that measured from an LYSO scintillator inside the detector array, although both have the same crystal geometry and surface conditions. We believe this is because in the current process of scintillator-array assembly, scintillators and reflectors are glued together along two sides, which eliminates the air gaps between the scintillator/reflector surfaces along those edges and greatly alters the light reflection and propagation conditions necessary for good DOI resolution. Improving the detector DOI resolution to 2–3 mm by modifying the scintillator-array assembly process to preserve the air gaps between the reflectors and scintillators is feasible; a study of this is in progress. Nevertheless, our study shows that the current coarse DOI resolution can still improve imaging performance significantly.
Because of less light loss at the central crystals than at the corner and edge crystals in the detector module owing to the fact that light escaping from central crystals has a greater chance of being detected by neighboring SSPMs, the energy and coincidence timing resolutions for central crystals are better than those for corner and edge crystals. However, the light escaped from central crystals may undergo extra reflections at neighboring crystals that can degrade the DOI resolutions for central crystals (Table 3).
Either with or without DOI information, changes in axial resolution are much smaller than those in transaxial resolutions owing to the fact that the small axial FOV (~16 mm) of the prototype PET scanner limits the impact of DOI on axial resolution. The uniformity of radial and tangential resolutions are pretty good as measured by the prototype scanner, this is because the fact that the point source was always imaged by two opposing detector panels in parallel which limits the incoming angle of gamma ray to the detector and reduce the resolution non-uniformity as usually observed with a stationary multi-polygon configured detector system (Yang et al., 2008). Nevertheless, it is clear from figure 5 that DOI measurement has substantially improved the overall radial and tangential resolutions.
The measured average crystal coincidence timing resolution of 2.8 ns resulted mainly from an intrinsic rise time of the SSPM arrays used in the prototype PET scanner greater than 20 ns (Sun et al., 2011). With the recent improvement of latest SSPM rise time to less than few ns, we expect the detector coincidence timing resolution can be improved to significantly. In addition, one separated study (not presented) has shown that timing resolution can be further improved by ~20% if an error-weighted instead of energy-weighted event timing calculation is used (Bircher, 2012).
The spatial resolution and system sensitivity of the prototype PET scanner can be improved further. As seen in figure 1c, all of the crystals are well separated beyond their boundaries in the flood-source crystal map, indicating that the crystal-identification capability of the detector can be better than that with the current 1.94×1.94 mm2 crystal size. Also, the image resolutions can be further improved by using smaller crystals (e.g. 1.5×1.5 mm2) with proper light sharing. In addition, the geometric sensitivity and FOV size of the prototype PET scanner are limited by the use of small rotating detectors. However, tiling more detectors together to form two-dimensional flat panels and thus develop a stationary system with extended axial coverage to substantially improve the system sensitivity should be feasible without fundamental technical difficulties.
To verify that the severely deteriorated image quality shown in figure 7b was indeed due to the artifacts and distortions caused by without using DOI information in image reconstruction, a Monte Carlo simulation study (based on GATE simulation package (Jan et al., 2004)) was conducted to generate a simulated phantom image that included emissions of gamma rays from the hot-rod phantom, interactions with the PET detectors, data acquisition of coincidence events under the same scanner geometry and setup for the experimental phantom study, and image reconstruction with the same data process and reconstruction parameters applied for the measured data. The reconstructed images from the simulated data with and without using DOI information are shown in figure 10, with very similar image qualities as that shown in the measured data (figure 7). This simulation study confirms that the measurement of DOI information is quintessential for achieving good image quality with compact scanner and imaging conditions as that described in this study.
Figure 10.
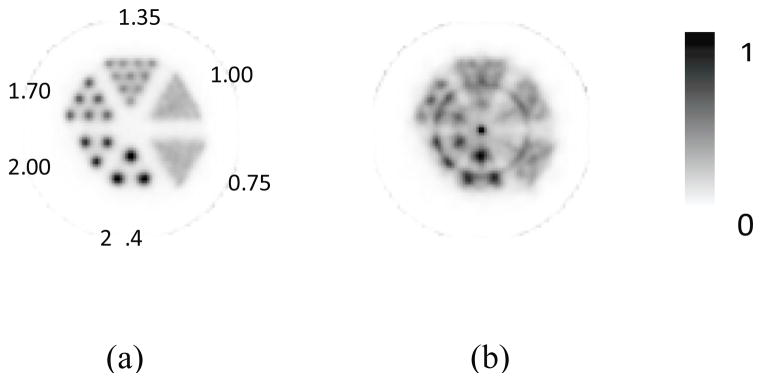
Images of a hot-rod phantom reconstructed from simulated PET data (a) with and (b) without DOI information.
5. Conclusion
We constructed and evaluated a prototype PET scanner with DOI-measurement capability, by successfully using SSPM arrays with parallel readout electronics to take advantage of this recently developed photon sensor technology and create practical, advanced PET detectors. Other distinguishing features of the detectors in the prototype scanner include the use of light guides for proper light sharing among scintillators with small cross-section sizes, closely packaged and seamlessly tiled detectors for enablement of scalable system configurations, and custom ASIC- and FPGA-based electronics to facilitate flexible algorithms for event calculation and data processing to improve imaging capability and performance. Individual detector modules showed good coincidence timing, energy, and DOI resolutions at about 2.8 ns, 17.6%, and 5.6 mm, respectively. With 30-mm-long LYSO crystals and a very compact system geometry, we have achieved uniform volumetric image resolutions across the FOV that are better than 8 mm3, indicating that high, uniform image resolution and high sensitivity can be achieved simultaneously. Our initial phantom and animal imaging studies using the prototype scanner have clearly demonstrated the potential and benefits of applying SSPM arrays with advanced signal readout and processing techniques to the development of a practical, high-performance DOI-measureable PET system.
Acknowledgments
The authors thank valuable assistance and useful discussions from Jing Wu, Xuezhou Zhu, Yan Xia at Tsinghua University, and the MD Anderson Small Animal Imaging Facility, especially Charles Kingsley and Jorge Delacerda. This work was supported by NIH grant R21 EB007581, an institutional research grant from MD Anderson, and the MD Anderson Cancer Center Support Grant CA016672.
Footnotes
Information on PACS: 87.57.uk
References
- BAILEY D, KARP JS, SURTI S. Physics and Instrumentation in PET. In: BAILLEY DL, TOWNSEND DW, VALK PE, MAISEY MN, editors. Positron Emission Tomography: Basic Sciences. 2. New York: Springer; 2005. [Google Scholar]
- BARTZAKOS P, THOMPSON CJ. A depth-encoded PET detector. Nuclear Science, IEEE Transactions on. 1991;38:732–738. [Google Scholar]
- BIRCHER C. PhD. The University of Texas, Graduate School of Biomedical Sciences; 2012. Design, calibration, and evaluation of depth-of-interaction-capable PET detector modules. [Google Scholar]
- BIRCHER C, SHAO Y. Investigation of Crystal Surface Finish and Geometry on Single LYSO Scintillator Detector Performance for Depth-of-Interaction Measurement with Silicon Photomultipliers. Nucl Instrum Methods Phys Res A. 2012a;693:236–243. doi: 10.1016/j.nima.2012.07.029. [DOI] [PMC free article] [PubMed] [Google Scholar]
- BIRCHER C, SHAO YP. Use of internal scintillator radioactivity to calibrate DOI function of a PET detector with a dual-ended-scintillator readout. Medical Physics. 2012b;39:777–787. doi: 10.1118/1.3676688. [DOI] [PMC free article] [PubMed] [Google Scholar]
- BURR KC, IV, AN A, CASTLEBERRY DE, LEBLANC JWALJW, SHAH KSASKS, FARRELL RAFR. Evaluation of a prototype small-animal PET detector with depth-of-interaction encoding. Nuclear Science, IEEE Transactions on. 2004;51:1791–1798. [Google Scholar]
- CHERRY SR, SORENSON JA, PHELPS ME. Physics in Nuclear Medicine. Philadelphia: SAUNDERS; 2003. [Google Scholar]
- DENG Z, LAN AK, SUN XS, BIRCHER C, LIU YN, SHAO YP. Development of an Eight-Channel Time-Based Readout ASIC for PET Applications. IEEE Transactions on Nuclear Science. 2011;58:3212–3218. doi: 10.1109/TNS.2011.2165557. [DOI] [PMC free article] [PubMed] [Google Scholar]
- DOWNIE E, YANG X, PENG H. Investigation of analog charge multiplexing schemes for SiPM based PET block detectors. Phys Med Biol. 2013;58:3943–64. doi: 10.1088/0031-9155/58/11/3943. [DOI] [PubMed] [Google Scholar]
- GODINEZ F, CHAUDHARI AJ, YANG Y, FARRELL R, BADAWI RD. Characterization of a high-resolution hybrid DOI detector for a dedicated breast PET/CT scanner. Physics in Medicine & Biology. 2012;57:3435–49. doi: 10.1088/0031-9155/57/11/3435. [DOI] [PMC free article] [PubMed] [Google Scholar]
- GOERTZEN AL, XUEZHU Z, MCCLARTY MM, BERG EJ, CHEN-YI L, KOZLOWSKI P, RETIERE F, RYNER L, SOSSI V, STORTZ G, THOMPSON CJ. Design and Performance of a Resistor Multiplexing Readout Circuit for a SiPM Detector. Nuclear Science, IEEE Transactions on. 2013;60:1541–1549. [Google Scholar]
- HERBERT DJ, SAVELIEV V, BELCARI N, D’ASCENZO N, DEL GUERRA A, GOLOVIN A. First results of scintillator readout with silicon photomultiplier. Nuclear Science, IEEE Transactions on. 2006;53:389–394. [Google Scholar]
- JAN S, SANTIN G, STRUL D, STAELENS S, ASSIÉ K, AUTRET D, AVNER S. GATE: a simulation toolkit for PET and SPECT. Phys Med Biol. 2004;49:4543–4561. doi: 10.1088/0031-9155/49/19/007. [DOI] [PMC free article] [PubMed] [Google Scholar]
- LING T, LEWELLEN TK, MIYAOKA RS. Depth of interaction decoding of a continuous crystal detector module. Physics in Medicine & Biology. 2007;52:2213–28. doi: 10.1088/0031-9155/52/8/012. [DOI] [PubMed] [Google Scholar]
- MAAS MC, SCHAART DR, VAN DER LAAN DJ, BRUYNDONCKX P, LEMAITRE C, BEEKMAN FJ, VAN EIJK CW. Monolithic scintillator PET detectors with intrinsic depth-of-interaction correction. Physics in Medicine & Biology. 2009;54:1893–908. doi: 10.1088/0031-9155/54/7/003. [DOI] [PubMed] [Google Scholar]
- MACDONALD LR, DAHLBOM M. Depth of interaction for PET using segmented crystals. Nuclear Science, IEEE Transactions on. 1998;45:2144–2148. [Google Scholar]
- MIYAOKA RS, LEWELLEN TK, YU H, MCDANIEL DLAMDL. Design of a depth of interaction (DOI) PET detector module. Nuclear Science, IEEE Transactions on. 1998;45:1069–1073. [Google Scholar]
- MOSES WW, DERENZO SE. Design studies for a PET detector module using a PIN photodiode to measure depth of interaction. Nuclear Science, IEEE Transactions on. 1994;41:1441–1445. [Google Scholar]
- MOSES WW, DERENZO SE, MELCHER CL, MANENTE RAAMRA. A room temperature LSO/PIN photodiode PET detector module that measures depth of interaction. Nuclear Science, IEEE Transactions on. 1995;42:1085–1089. [Google Scholar]
- MURAYAMA H, ISHIBASHI I, UCHIDA H, OMURA TA, YAMASHITA TA. Depth encoding multicrystal detectors for PET. Nuclear Science, IEEE Transactions on. 1998;45:1152–1157. [Google Scholar]
- PENG H, LEVIN CS. Design study of a high-resolution breast-dedicated PET system built from cadmium zinc telluride detectors. Physics in Medicine & Biology. 2010;55:2761–88. doi: 10.1088/0031-9155/55/9/022. [DOI] [PMC free article] [PubMed] [Google Scholar]
- READER AJ, ALLY S, BAKATSELOS F, MANAVAKI R, et al. One-pass list-mode EM algorithm for high-resolution 3-D PET image reconstruction into large arrays. Nuclear Science, IEEE Transactions on. 2002;49:693–699. [Google Scholar]
- SCHAART DR, VAN DAM HT, SEIFERT S, VINKE R, DENDOOVEN P, LOHNER H, BEEKMAN FJ. A novel, SiPM-array-based, monolithic scintillator detector for PET. Physics in Medicine & Biology. 2009;54:3501–12. doi: 10.1088/0031-9155/54/11/015. [DOI] [PubMed] [Google Scholar]
- SEIDEL J, VAQUERO JJ, GREEN MV. Resolution uniformity and sensitivity of the NIH ATLAS small animal PET scanner: Comparison to simulated LSO scanners without depth-of-interaction capability. Nuclear Science, IEEE Transactions on. 2003;50:1347–1350. [Google Scholar]
- SEIFERT S, VAN DER LEI G, VAN DAM HT, SCHAART DR. First characterization of a digital SiPM based time-of-flight PET detector with 1 mm spatial resolution. Physics in Medicine & Biology. 2013;58:3061–74. doi: 10.1088/0031-9155/58/9/3061. [DOI] [PubMed] [Google Scholar]
- SHAO Y, LI H. Optimization of timing resolution for SSPM array with differential multi-channel input. J Nucl Med. 2007;48:441. [Google Scholar]
- SHAO Y, LI H, GAO K. Initial experimental studies of using solid-state photomultiplier for PET applications. Nuclear Instruments & Methods in Physics Research Section a-Accelerators Spectrometers Detectors and Associated Equipment. 2007;580:944–950. [Google Scholar]
- SHAO Y, MEADORS K, SILVERMAN RW, FARRELL RAFR, CIRIGNANO LACL, GRAZIOSO RAGR, SHAH KSASKS, CHERRY SRACSR. Dual APD array readout of LSO crystals: optimization of crystal surface treatment. Nuclear Science, IEEE Transactions on. 2002;49:649–654. [Google Scholar]
- SHAO Y, YAO R, MA T. A novel method to calibrate DOI function of a PET detector with a dual-ended-scintillator readout. Medical Physics. 2008;35:5829–40. doi: 10.1118/1.3021118. [DOI] [PubMed] [Google Scholar]
- SUN X, LAN AK, BIRCHER C, DENG Z, LIU Y, SHAO Y. Energy and Timing Measurement with Time-Based Detector Readout for PET Applications: Principle and Validation with Discrete Circuit Components. Nucl Instrum Methods Phys Res A. 2011;641:128–135. doi: 10.1016/j.nima.2011.03.033. [DOI] [PMC free article] [PubMed] [Google Scholar]
- VAN DAM HT, SEIFERT S, VINKE R, DENDOOVEN P, LOHNER H, BEEKMAN FJ, SCHAART DR. A practical method for depth of interaction determination in monolithic scintillator PET detectors. Physics in Medicine & Biology. 2011;56:4135–45. doi: 10.1088/0031-9155/56/13/025. [DOI] [PubMed] [Google Scholar]
- WANG GC, HUBER JS, MOSES WW, CHOONG WSACWS, MALTZ JSAMJS. Calibration of a PEM detector with depth of interaction measurement. Nuclear Science, IEEE Transactions on. 2004;51:775–781. [Google Scholar]
- XIA Y, MA T, LIU Y, SUN X, WANG S, SHAO Y. Imaging performance evaluation in depth-of-interaction PET with a new method of sinogram generation: A Monte Carlo simulation study. Nuclear Science and Techniques. 2011;22:144–150. [Google Scholar]
- YAMAMOTO S, ISHIBASHI H. A GSO depth of interaction detector for PET. Nuclear Science, IEEE Transactions on. 1998;45:1078–1082. [Google Scholar]
- YAMAYA T, MITSUHASHI T, MATSUMOTO T, INADAMA N, NISHIKIDO F, YOSHIDA E, MIURAYAMA H, KAWAI H, SUGA M, WATANABE M. A SiPM-based isotropic 3D PET detector X’ta; cube with a three-dimensional array of 1 mm3 crystals. Phys Med Biol. 2011;56:6974–6807. doi: 10.1088/0031-9155/56/21/003. [DOI] [PubMed] [Google Scholar]
- YANG Y, DOKHALE PA, SILVERMAN RW, SHAH KS, MCCLISH MA, FARRELL R, ENTINE G, CHERRY SR. Depth of interaction resolution measurements for a high resolution PET detector using position sensitive avalanche photodiodes. Physics in Medicine & Biology. 2006;51:2131–42. doi: 10.1088/0031-9155/51/9/001. [DOI] [PubMed] [Google Scholar]
- YANG Y, QI J, WU Y, JAMES S. Depth of interaction calibration for PET detectors with dual-ended readout by PSAPDs. Phys Med Biol. 2009;54:433–445. doi: 10.1088/0031-9155/54/2/017. [DOI] [PMC free article] [PubMed] [Google Scholar]
- YANG Y, WU Y, QI J, JAMES SS, DU H, DOKHALE PA, SHAH KS, FARRELL R, CHERRY SR. A prototype PET scanner with DOI-encoding detectors. Journal of Nuclear Medicine. 2008;49:1132–1140. doi: 10.2967/jnumed.107.049791. [DOI] [PMC free article] [PubMed] [Google Scholar]
- YOSHIDA E, KINOUCHI S, TASHIMA H, NISHIKIDO F, INADAMA N, MURAYAMA H, YAMAYA T. System design of a small OpenPET prototype with 4-layer DOI detectors. Radiol Phys Technol. 2012;5:92–7. doi: 10.1007/s12194-011-0142-1. [DOI] [PubMed] [Google Scholar]
- YOSHIDA E, TASHIMA H, INADAMA N, NISHIKIDO F, MORIYA T, OMURA T, WATANABE M, MURAYAMA H, YAMAYA T. Intrinsic spatial resolution evaluation of the X’tal cube PET detector based on a 3D crystal block segmented by laser processing. Radiol Phys Technol. 2013;6:21–7. doi: 10.1007/s12194-012-0167-0. [DOI] [PubMed] [Google Scholar]
- ZHANG J, FOURDRAY A, OLCOTT P, LEVIN C. Performance characterization of a novel thin position-sensitive avalanche photodiode for 1 mm resolution positron emission tomography. Nuclear Science, IEEE Transactions on. 2007;54:415–421. doi: 10.1109/TNS.2007.894129. [DOI] [PMC free article] [PubMed] [Google Scholar]


