

Abstract
Background
Direct comparison of analytical performance criteria that utilize different statistical approaches can be problematic. We describe a mathematical approach to compare performance criteria for hemoglobin A1c (HbA1c) analysis used by the NGSP standardization program and the College of American Pathologists (CAP) to enhance consistency between the schemes.
Methods
The imprecision (CV) and bias combinations required to pass each criterion at probabilities of 0.95, 0.99 and 0.999 were calculated and used to construct contour plots to compare them. The CV/bias requirements were calculated mathematically for the 2011–2012 CAP (3/3 results within ±7% of the target) and different proposed NGSP (33/40 to 40/40 results within ±7% of the target) criteria, and using computer simulations for the existing NGSP criterion (95% confidence interval of the differences between the method and NGSP within +/−0.75% HbA1c).
Results
Requiring 37 of 40 results to be within ±7% of the NGSP target best matched the CAP criterion at zero bias (95% chance of passing).
Conclusions
The NGSP Steering Committee recommended a certification criterion of 37 of 40 results within ±7% of the NGSP (reduced to ±6% in 2014). The described evaluation approach may be useful in other situations where comparison of different performance criteria is desired.
Keywords: Analytical bias, Analytical imprecision, Hemoglobin A1c, HbA1c
1. Introduction
For critical analytes, defined analytical performance goals are vital to facilitate the optimal use of the test in patient care. In the process of developing these goals direct comparisons between performance criteria that utilize different schemes and/or statistical methodologies may be useful; however, such comparisons may be difficult to perform mathematically.
Hemoglobin A1c (HbA1c) is a well-established and important indicator of outcome risks in patients with diabetes. The American Diabetes Association (ADA) and other clinical organizations, including the World Health Organization, the European Association for the Study of Diabetes, and the International Diabetes Federation, now recommend HbA1c for diagnosing diabetes. Based on the results of large-scale clinical trials that established the relationships between HbA1c and clinical outcomes [1,2], the ADA began recommending specific HbA1c levels for use in the treatment of patients in 1994 [3]. However, College of American Pathologists (CAP) proficiency survey data clearly showed large discrepancies in HbA1c results among assay methods and laboratories [4], making it extremely difficult to incorporate the treatment guidelines in clinical practice. Thus the National Glycohemoglobin Standardization Program (NGSP) was implemented in 1996 with the goal of harmonizing HbA1c results to those of the clinical trials that established the relationships between HbA1c and outcome risks [5], specifically the Diabetes Control and Complications Trial [1] and United Kingdom Prospective Diabetes Study [2]. The NGSP assists manufacturers with calibration, certifies them as traceable to the DCCT via sample comparisons with NGSP network laboratories, and monitors the effectiveness of the program via the CAP GH-2 whole blood proficiency survey for HbA1c. The program has been highly successful in its efforts to improve the quality of HbA1c testing [5].
Since its inception in 1996, the NGSP has tightened several times the criteria for certification of manufacturers’ methods with the goal of improving the quality of HbA1c testing. Similarly, CAP replaced peer-group grading of HbA1c for the GH-2 HbA1c survey with accuracy-based grading in 2007, and has since tightened the acceptable performance limits from the initial ±15% to ±7% in 2011–2012 [5] and ±6% in 2013. At the time CAP adopted ±7% as the acceptability criterion, the NGSP criterion was based on Bland/Altman statistical methods [6]. The NGSP required that the 95% confidence interval of the differences between a manufacturer’s method (analyzed in duplicate) and the NGSP Secondary Reference Laboratory (SRL, mean of duplicates) in a 40 sample comparison must fall within ±0.75% HbA1c [5]. In deciding whether to tighten the NGSP criterion, the NGSP Steering Committee felt it important to compare the existing and any proposed new criteria to the CAP criterion to ensure that the two are comparable.
Unfortunately, the 2 sets of criteria could not be compared directly. This is due to NGSP certification requiring that 40 samples be analyzed in duplicate, while for CAP surveys three samples are each measured only once. Moreover, the NGSP criterion was based on the mean and standard deviation (SD) of the differences, while the CAP criterion is based on the percentage deviation from the target value. Therefore, we developed a new statistical strategy to compare the two different schemes. Here, we describe the statistical method used to compare the CAP and NGSP criteria. These analyses enabled the development of an NGSP certification criterion that was comparable to the CAP criterion. The statistical approach presented here can be applied to other situations where comparison of different approaches to analytic acceptance criteria is required.
2. Methods
2.1 NGSP and CAP Criteria
Both the existing (2010–2012) NGSP criterion (95% confidence interval of the differences between laboratory method and SRL within ±0.75% HbA1c) and proposed NGSP criteria (33 to 40 out of 40 single results within ±7% of the means of duplicate SRL results) were compared to the 2011–2012 CAP limits of ±7% of the target value.
2.2 Calculations
Both analytical bias and imprecision (CV) influence the accuracy of individual HbA1c measurements; thus, the probability of a laboratory passing a given criterion depends upon the laboratory’s bias and CV. For the CAP and proposed NGSP criteria, the probability of passing as a function of the laboratory’s bias and CV was mathematically derived and computed over a range of bias (−7% to +7% in 0.2% increments) and CV (0% to 5% in 0.1% increments) combinations. Computer simulations were employed to compute the probabilities of passing the existing NGSP criterion. Forty HbA1c levels were randomly generated to match the distribution of HbA1c results used for NGSP certification (8 samples between 4% and 5.5%, 12 samples between 5.5% and 7%, 12 samples between 7% and 8.5%, 8 samples between 8.5% and 10% HbA1c). Duplicate measurements were randomly generated for each level for the NGSP SRL. Singleton measurements were generated for a hypothetical laboratory that reflected a specified bias and CV combination. The simulated data were evaluated by the existing NGSP criterion to determine pass or fail. This process was repeated one million times and the fraction of the million simulations that passed the criterion was used to estimate the probability of a laboratory passing given the specified bias and CV combination.
2.3 Contour plots
Contours of constant probability (0.95, 0.99 and 0.999) were derived from the computed probabilities of passing a given criterion over the grid of relative bias and CV combinations evaluated. Contour plots were then constructed to directly compare the different criteria. Details of the mathematical derivations and simulations are given in the Appendix. All analyses were performed using Matlab software (MathWorks).
2.4 Target value assignments and uncertainties
CAP target values are assigned by all of the NGSP SRLs (n=7) where each SRL analyzes each CAP sample three times on each of two separate days. NGSP certification target values are based on the means of duplicate SRL results. Estimates of the uncertainties for the CAP value assignments and the NGSP certification target values (CVs of 0.5% and 1.5%, respectively) were obtained based on value assignments from four previous CAP surveys performed in 2009 and 2010 (2 surveys per year, each with 3 HbA1c concentrations) and incorporated into the models. Although CAP requires two of three survey samples to be within ±7% in order for a laboratory to pass, our calculations were based on all three samples falling within these limits.
3. Results
3.1 Existing (2010–2012) NGSP vs. CAP 2011–2012 criteria
Fig. 1 plots solid contour lines for the existing NGSP acceptance criterion and dashed contour lines for the CAP ±7% acceptance criterion. The NGSP criterion was less stringent than CAP at all probability levels as demonstrated by each solid contour curve dominating the dashed contour curve of the same shade. This implies that there is a wider range of possible laboratory bias and CV combinations that would pass the existing NGSP criterion at a given probability level compared to the CAP criterion.
Fig. 1.

The existing (2010–2012) NGSP certification criterion (95% confidence interval of the differences between laboratory method and SRL within ±0.75% HbA1c) compared to the 2011–2012 CAP criterion of ±7%. The lines represent the bias and CV combinations required to pass the NGSP (—) and CAP (----) criteria with 0.95 (top, black), 0.99 (middle, dark grey) and 0.999 (bottom, light grey) probabilities.
3.2 Proposed NGSP (2013) vs. CAP 2011–2012 criteria
In order to more directly align the proposed NGSP criterion with the CAP requirements, the new criterion should be based on the number of results (out of 40) that are required to fall within ±7% of the SRL results (mean of duplicates) rather than Bland/Altman. Fig. 2 plots contours for the CAP criterion (dashed lines) and the proposed NGSP criteria (solid lines) requiring 36 out of 40 (Fig. 2A), 37 out of 40 (Fig. 2B) and 38 out of 40 (Fig. 2C) results to be within ±7% of the SRL.
Fig. 2.
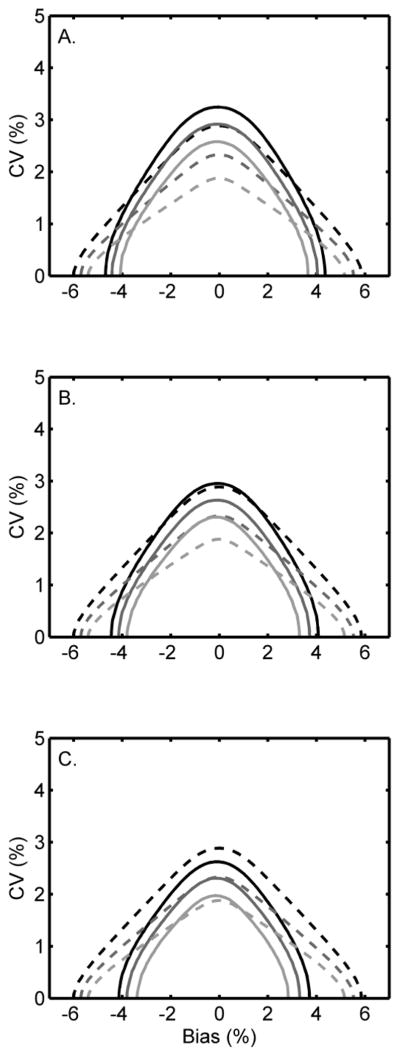
Proposed NGSP criteria of 36/40 (A), 37/40 (B) and 38/40 (C) results within ±7% of the SRL compared to the 2011–2012 CAP criterion of ±7%. The lines represent the bias and CV combinations required to pass the NGSP (—) and CAP (----) criteria with 0.95 (upper, black), 0.99 (middle, dark grey) and 0.999 (lower, light grey) probabilities.
Fig. 2A shows results similar to those in Fig. 1. An NGSP criterion that would require 36 out of 40 results to fall within ±7% of the SRL is less stringent than the CAP criterion at all probability levels for any laboratory with a CV >~1.5%. Fig. 2B shows that for laboratory bias < ~ ±3% the 37/40 criterion is comparable to the CAP criterion at a 0.95 probability of passing (black curves). At higher probabilities of passing (0.99 and 0.999), the CAP criterion is more stringent than the NGSP criterion when laboratory bias is low. However, as laboratory bias increases above approximately ±2% the 37/40 NGSP criterion becomes increasingly more stringent than the CAP criterion (Fig. 2B). Fig. 2C shows that the 38/40 criterion is comparable to the CAP criterion at 0.99 (dark gray curve) and 0.999 (light gray curve) probabilities when laboratory bias is less than approximately ±1%. The 38/40 NGSP criterion is more stringent than the CAP criterion at a 0.95 probability of passing (black curve), regardless of bias.
Note, the contour plots are slightly asymmetrical because the estimated assigned values have imprecision. The lower limit of acceptance is 0.93 times the assigned value and the upper limit of acceptance is 1.07 times the assigned value. Thus, the imprecision of the lower limit is 0.93 times the assigned value’s imprecision while at the upper limit the imprecision is 1.07 times the assigned value’s imprecision.
For the CAP criterion, the calculations were based on 3 of 3 samples passing the CAP criterion on a given survey (CAP requires that 2 of 3 samples pass). Certification is performed by the manufacturer under presumably ideal conditions, typically using a single lot of calibrator and reagents, while CAP survey participants comprise individual clinical laboratories that may be using many different lots. It is therefore appropriate that NGSP criteria applied to manufacturers are based on a somewhat more stringent standard than that applied by CAP to laboratories in the field.
3.3 Proposed NGSP (2014) vs. CAP 2013 criteria
Beginning with the 2013 surveys the CAP criterion was tightened to ±6%. Fig. 3 compares NGSP 37/40 with limits of ±6% to the new CAP criterion. Analogous to Fig. 2B, the NGSP criterion is more stringent than CAP regardless of bias at a 0.95 probability of passing. At 0.99 and 0.999 probabilities the NGSP criterion is less stringent than CAP when bias is low (<±2%) and becomes increasingly more stringent than CAP when bias increases above this value. Based on these results the NGSP Steering Committee decided to adopt the ±6% limits for certification beginning in January 2014.
Fig. 3.

NGSP criterion of 37/40 results within ±6% compared to the 2013 CAP criterion of ±6%. The lines represent the bias and CV combinations required to pass the NGSP (—) and CAP (----) criteria with 0.95 (upper, black), 0.99 (middle, dark grey) and 0.999 (lower, light grey) probabilities.
4. Discussion
Comparison of the CAP and NGSP criteria would be straightforward if they utilized identical evaluation schemes; however, this is not possible since they do not fulfill the same function. The purpose of NGSP certification is to determine if an individual assay method is capable of performing at a level sufficient to meet clinical needs. The process involves a direct comparison of the method against an NGSP SRL. Analysis, which is performed by the manufacturer, requires a panel of samples (n=40) that is large enough to obtain sufficient data. By contrast, the purpose of the CAP survey is to evaluate the overall performance of assay methods in the hands of end-users across a large number of laboratories. The CAP proficiency testing requires considerably fewer specimens. Moreover, use of a large panel of specimens is not logistically feasible in a proficiency survey involving thousands of laboratories. Thus, the evaluation schemes are different.
We have described the analyses used to develop the new NGSP criterion that 37/40 results are within a specific range of the SRL. As the CAP criteria tightened, 2 different criteria for NGSP were evaluated. The NGSP criterion that 37/40 results are within ±7% of the SRL is comparable to the 2012 CAP acceptable limits (based on 3 of 3 samples passing) of ±7% when there is minimal bias present. As bias increases the new NGSP criterion becomes more stringent than CAP. The relationship between NGSP and CAP is essentially the same when comparing the 2013 CAP and 2014 NGSP 37/40 limits of ±6%. The NGSP Steering Committee decided that this was appropriate given that method certification is performed by the manufacturer, presumably under optimal conditions. By contrast, clinical laboratories are required to analyze CAP samples in exactly the same manner as patient samples are analyzed. Thus, the NGSP Steering Committee recommended that 37 of 40 results need to be within ±6% of the NGSP for method certification from January 2014.
Since HbA1c is now recommended for diagnosing diabetes, as well as monitoring the glycemic status in patients with diabetes, ensuring optimal HbA1c testing performance is even more important. The NGSP and CAP have been highly successful in efforts to improve the quality of HbA1c testing; in both cases the criteria will likely be tightened in the future to ensure that HbA1c testing can meet clinical needs.
5. Conclusions
The analyses and evaluation approach described here will facilitate ongoing assessment of any proposed new criteria in order to ensure that NGSP and CAP requirements are consistent with each other and that requirements for HbA1c testing performance are well-defined. It may also be useful in other situations as either a primary or a supplemental approach to compare alternative schemes for defining acceptable analytical performance.
Highlights.
A methodology used to compare performance criteria for HbA1c testing is described.
Required imprecision/bias combinations were calculated for each criterion.
Performance requirements were calculated mathematically or by computer simulation.
Contour plots of the CV/bias combinations were constructed to compare the criteria.
Our approach may be useful for comparing analytical criteria in other situations.
Acknowledgments
Research Funding: D.B. Sacks, Intramural Research Program of the National Institutes of Health. C.L. Rohlfing and R.R. Little gratefully acknowledge the support of NIH/NIDDK (Grant Number 1UC4DK096587-01).
Nonstandard abbreviations
- ADA
American Diabetes Association
- SRL
Secondary Reference Laboratory
Appendix
Statistical Model
Let μ be the unknown true value for a certification sample. Let Y denote the estimated value of the certification sample obtained from replicate measurements performed at one or more secondary reference laboratories (SRLs). For the CAP criterion Y is computed based on the average of 7 SRLs measuring 3 replicates per day on 2 different days. For the NGSP criteria, Y is computed as the average of duplicate measurements from a single SRL. The expected value of Y is μ. Denote the coefficient of variation for the estimate of Y as CVY. Note, CVY will be lower for the CAP criterion than for the NGSP criterion because a larger number of replicates are used to estimate Y for the CAP criterion.
Let X denote a laboratory’s result for the certification sample. Assume X = μ + B + e where B represents the laboratory’s bias (given as a percent of μ) and e represents the laboratory’s random measurement error assumed normally distributed with zero mean and coefficient of variation = CVX.
2011–2012, 2013 CAP and Proposed NGSP Acceptance Criteria
The CAP acceptance criterion are defined here as requiring that 3 out of 3 certification samples measured by the laboratory be within ±7% of the CAP estimated assigned values. The proposed NGSP acceptance criteria require at least M out of 40 certification specimens (M = 33 to 40) be within 7% of the NGSP estimated assigned values. Let P1 represent the probability that a laboratory’s measured value (X) for one of the certification samples is within ±7% of the estimated assigned value (Y). Then
Let WU = (X − 1.07Y)/μ and WL = (X − .93Y)/μ. Note, the expected value of WU is
and the variance of WU is
Likewise
Thus, P1 = Prob(WU < 0) − Prob(WL < 0) which is equivalent to
where Z denotes a standard normal random variable.
Denote the probability of passing the acceptance criterion as PA. For the CAP acceptance criterion PA equals the probability that all 3 certification specimens are within 7% of the CAP assigned values which is , where CVY denotes the CV for the CAP assigned values in the formula for P1. Conversely, the probability of failing the CAP criterion is
The probability of passing the proposed NGSP criteria that require at least M out of 40 certification specimens be within ±7% of the NGSP assigned values is
where CVY denotes the CV for the NGSP assigned values in the formula for P1.
2010–12 NGSP criterion
Computer simulations were employed to estimate the probability of passing the current NGSP criterion as a function of a laboratory’s bias and CV. The simulations randomly generated 40 HbA1c levels matched to the sample distribution for NGSP certification - 8 samples uniformly distributed between 4 and 5.5% HbA1c, 12 uniformly distributed between 5.5 and 7% HbA1c, 12 uniformly distributed between 7 and 8.5% HbA1c, and 8 uniformly distributed between 8.5 and 10% HbA1c. Duplicate measurements were randomly generated for each of the 40 HbA1c levels that reflected the imprecision of an SRL. Likewise single measurements were randomly generated for each of the 40 HbA1c levels that reflected the bias and imprecision of a hypothetical laboratory. The simulated data were assessed by the current NGSP criterion to determine if the laboratory passed or failed. This process was repeated one million times and the fraction of the one million simulations that passed the criterion was used to estimate the probability of a laboratory with the specified bias and CV passing.
Contour plots
The probability of passing or failing each criterion was computed for laboratory bias and CV combinations over a grid of 71 bias levels ranging from −7% to +7% in 0.2% increments and 51 CV levels ranging from 0% to 5% in 0.1% increments. Contour lines representing all laboratory bias and CV combinations with the same probability of criterion failure were derived using the contour function in the Matlab software package.
Footnotes
Publisher's Disclaimer: This is a PDF file of an unedited manuscript that has been accepted for publication. As a service to our customers we are providing this early version of the manuscript. The manuscript will undergo copyediting, typesetting, and review of the resulting proof before it is published in its final citable form. Please note that during the production process errors may be discovered which could affect the content, and all legal disclaimers that apply to the journal pertain.
References
- 1.The Diabetes Control and Complications Trial Research Group. The effect of intensive treatment of diabetes on the development and progression of long-term complications in insulin-dependent diabetes mellitus. N Engl J Med. 1993;329:977–986. doi: 10.1056/NEJM199309303291401. [DOI] [PubMed] [Google Scholar]
- 2.U.K. Prospective Diabetes Study (UKPDS) Group. Intensive blood-glucose control with sulphonylureas or insulin compared with conventional treatment and risk of complications in patients with type 2 diabetes (UKPDS 33) Lancet. 1998;352:837–853. [PubMed] [Google Scholar]
- 3.American Diabetes Association. Standards of medical care for patients with diabetes mellitus. Diabetes Care. 1994;17:616–623. doi: 10.2337/diacare.17.6.616. [DOI] [PubMed] [Google Scholar]
- 4.College of American Pathologists. Electrophoresis/chromatography survey 1993, set EC-C. Northfield, Illinois: 1993. [Google Scholar]
- 5.Little RR, Rohlfing CL, Sacks DB for the National Glycohemoglobin Standardization Program (NGSP) Steering Committee. Status of hemoglobin A1c measurement and goals for improvement: from chaos to order for improving diabetes care. Clin Chem. 2011;57:205–214. doi: 10.1373/clinchem.2010.148841. [DOI] [PubMed] [Google Scholar]
- 6.Bland JM, Altman DG. Statistical methods for assessing agreement between two methods of clinical measurement. Lancet. 1986;327:307–310. [PubMed] [Google Scholar]