

Abstract
Cancer stem cells (CSCs) are a subpopulation of cells within a heterogeneous tumor that have enhanced biologic properties e.g., increased capacity for self-renewal, increased tumorigenicity, enhanced differentiation capacity, and resistance to chemo-and radiotherapies. This unit describes protocols to isolate and characterize potential cancer stem cells from a solid tumor. This involves creating a single-cell suspension from tumor tissue, tagging the cell subpopulation of interest, and sorting cells into different populations. Finally, the sorted subpopulations can be evaluated for their ability to meet the functional requirements of a CSC, which primarily include increased tumorigenicity in an in vivo xenograft assay. Mastering the protocols in this unit will allow the researcher to study populations of cells that may have properties of CSCs.
Keywords: cancer stem cells, xenograft assay, cell separation and sorting
INTRODUCTION
Cancer stem cells (CSCs) are defined as a specialized subpopulation of cells within a heterogeneous mixture of cancer cells that have enhanced pro-malignant properties. These properties, in various experimental models, include increased tumorigenicity; greater differentiation capacity; enhanced resistance to chemotherapy and radiation therapy; aggressive migration, invasion, and metastasis; and unlimited replicative potential. Important to identifying these properties is isolation of this potential cell sub-population and separation from the remaining cells so that biologic endpoints can be examined independently. There are two general approaches to distinguishing putative CSCs: 1) by expression of a particular protein of interest, such as CD133; and 2) by functionality. Functional separation entails exposing all the cells in a heterogeneous population to a particular stress, such as chemotherapy or culture in serum-free media on adherence-preventing plates, and allowing differential responses in the various cells to select out a population (i.e. chemoresistant cells or tumorspheres, respectively). The more common approach uses one of several methods to separate out a cell population of interest and test the population independently for the stem cell-like phenotype. This unit describes protocols to isolate and characterize potential cancer stem cells from primary tumor samples or a xenograft tumor and some of the methods used to assess the population. In general there are four phases to isolating these cells, and in each phase there are various approaches that are used to complete this cell isolation. The first step in any of the downstream applications characterizing a population of interest is creating a single-cell suspension of cancer cells. The second phase is to expose all cells to a tag that will differentially label the cells of interest. The third phase involves separating the cell sub-populations, such as by flow cytometry or magnetic bead separation. Finally, the sorted cell populations are interrogated individually for their ability to meet the functional requirements of CSC, which primarily include increased tumorigenicity in an in vivo xenograft assay, and demonstration of increased capacity of the putative CSC population to give rise to both CSC and non-CSC populations, recapitulating the heterogeneity of the original tumor sample.
Cancer stem cells are named as such because, like normal stem cells, they have the ability to undergo self-renewal, the ability to differentiate into any cell found in the heterogeneous tumor, and an increased proliferative ability that drives malignant formation (Jordan et al., 2006). It should be noted that the label CSC is used for consistency in this unit, but terminology used in the scientific literature is variable. Often subpopulations are defined by the functional assay used in their evaluation, such as Tumor Initiating Cells (TIC), or Treatment Resistant Cells (TRC). If some properties of a cell sub-population are indicative of stemness but in vivo tumorigenicity is not examined, the cells may be described as Cancer Stem-like Cells (CSLC). Regardless of terminology, this unit will allow separation of cells for additional study as directed by the specific scientific question posed of the population. Importantly, there is no specific marker that is universally accepted as a CSC marker. Even for individual tumor types, a certain population may be described as having stem cell properties, but cannot conclude that it is the only, or the most reliable, cancer stem cell population. Markers often used to define CSC populations include surface expression of CD133 or CD44, and activity of the enzyme ALDH1A1 (as determined by the ALDEFLUOR assay) or the “side population” (SP, explained in more detail in Basic Protocol 3), but many other markers have been explored as well (i.e. My88, endoglin, CD24 negativity, and Oct4). Of course when isolating these populations by cell surface marker expression, conclusions are by necessity limited to the specific population studied. For example, conclusions made regarding a CD133-positive population do not mutually exclude other populations within that heterogeneous mass from having similar characteristics. Hopefully additional research will allow more comprehensive methods to be employed, whereby multiple populations can be simultaneously studied to identify the most “stem-like” of multiple potential CSC populations. That being said, by completing this unit the researcher will be able to identify and isolate a putative cancer stem cell population that meets many characteristics thought to be required of the designation CSC, and can be further interrogated for specialized studies, such as susceptibility to CSC-specific therapeutics.
The first protocol presented is necessary to acquire a single cell suspension of the cancer cells that the researcher desires to study. This is accomplished via a mechanical dissociation, chemical dissociation, or a combination of both (Basic Protocol 1). Two main methods of sorting these cell populations are then presented. The first is by identification of surface marker expression by antibody-based methods, followed by separation by flow cytometry (Basic Protocol 2) or magnetic beads (Alternate Protocol 2). The second option isolates cells by functional activity of a protein. This includes isolation of the “Side population” (SP), which is defined as the cell population with increased efflux of the Hoechst 33342 dye from the nucleus, primarily mediated by the membrane pump ABCG2 (Basic Protocol 3). A similar approach is through the use of the ALDEFLUOR assay, which isolates cells with active ALDH1A1 enzyme population, performed per manufacturer’s instructions and therefore not described in detail here. Finally, protocols are described to assess the two primary functional aspects generally required to define cancer stem cells. The first is increased tumorigenicity in mice with a xenograft formation assay (Basic Protocol 4). The second is demonstration that CSCs have enhanced differentiation capacity, by examination of tumor for both CSC-positive and CSC-negative populations (Basic Protocol 5).
NOTE: The following procedures are performed in a Class II biological hazard flow hood or a laminar flow hood.
NOTE: All solutions and equipment that comes in contact with live cells must be sterile and proper aseptic technique is to be used accordingly.
NOTE: All protocols using patient tissues require IRB approval and consent from patients, and protocols using live animals must first be reviewed and approved by an Institutional Animal Care and Use Committee (IACUC) or must conform to governmental regulations regarding the care and use of laboratory animals.
BASIC PROTOCOL 1: MECHANICAL DISSOCIATION OF PRIMARY TUMOR OR MOUSE XENOGRAFTS
CSCs constitute a small subset of the cancer cells in a heterogeneous tumor. As such, it is necessary to dissociate a tumor sample into a single cell suspension to be able to isolate CSCs from the rest of the cancer. Although some studies have taken advantage of marker-positive and -negative populations identified within cell lines, it is generally believed that for a population to be considered a CSC, increased tumorigenicity from a patient-derived tumor and the capacity to reproduce the original tumor are required. This adds additional challenges, as dissociation of a solid tumor into a single-cell population is traumatic to cells and time consuming. In this method, it will be described how to mechanically dissociate a tumor tissue sample that comes either from a human patient or a mouse xenograft.
Materials
Tumor sample – preferred at least 1cm of viable tissue
Serum-free RMPI cell culture media (or preferred media)
10 cm petri dish
Scalpel handle and #22 blade
50 ml conical tube
Tissue forceps
70 μm sterile mesh filter
10 mL, 5 mL, 1 mL pipette tips
16 gauge needles and 3–5 mL syringes
Hemocytometer, trypan blue
Protocol steps
Begin processing tumor as soon as possible to maximize viability. Optimally, the tumor is received immediately after removal from the patient. This is not always possible, depending on personnel available and need for pathologic review. Use of the specimen cannot compromise patient care, so collaboration with the surgeon and pathologist that can quickly provide excess tissue is essential. Ideally processing of tissue should begin within 30 minutes of removal, with implantation into mice or culture accomplished in another 30–60 minutes. Mouse tumors can generally be obtained more quickly, as they are resected immediately after sacrifice, can be identified grossly, and processing can begin quickly.
After receiving the tissue sample from a patient or removing a tumor from a mouse, place the specimen in a 10-cm dish with approximately 1 mL of cold media. The dish should be placed on ice or an ice pack during dissection.
Hold the specimen firm with tissue forceps, and using the back of a number 22 scalpel blade, scrape the specimen downward, and away, such that cells are pulled off the tumor mass into the dish. This should start to break up the solid mass. As cells are broken from the tumor mass, strands of connective tissue will be isolated, and are to be removed from the collection.
Continuing scrapping until the specimen is too small to hold and you have a large “slurry” population in the 10-cm dish.
Dissociate the cell slurry further using a 10 mL serological pipette, then when the slurry passes easily in and out of this, move to a 5 mL pipette, then a 1 mL pipette. Depending on the density of the tumor, eventually one may be able to aspirate the slurry into a 16-guage needle on a 3 or 5mL syringe simply by this mechanical dissociation. Using a 3 mL syringe, attach a large gauge needle (i.e. 16g) and gently aspirate the cell slurry into the syringe through the needle. If only small clumps of cells are needed for downstream applications, such an injection into mice, or culture, this degree of dissociation is sufficient. If performing flow cytometric analysis, single-cell suspension is required, continue with step 6.
Place a 70-μm filter on top of a 50 mL conical tube. Slowly deposit the cell suspension onto the filter and allowing the cell suspension to pass into the collection tube. If the suspension still has large debris, this filter will get clogged quickly. In this case, first pass the suspension through 200 μm and 100 μm filters, and then proceed to 70 μm filters.
Once the entire the cell suspension has been collected, collect 50 μL to use for counting and assessment of viability, centrifuge the remaining sample at 3,000 rpm (1500 × g) for 10 minutes at 4°C.
While samples is centrifuging, determine the number and viability of cells in the suspension using a hemacytometer and trypan blue exclusion.
Aspirate off media and resuspend the cellular pellet in cell culture media or PBS as desired for downstream applications, in the appropriate volume needed for these applications, based on cell density calculated by trypan blue exclusion.
ALTERNATE PROTOCOL 1: CHEMICAL DISSOCIATION OF PRIMARY TUMOR OR MOUSE XENOGRAFT
The decision to use a mechanical based dissociation or a chemical based dissociation is primarily a personal preference, but most often guided by the density of the tumor. Avoiding chemical dissociation is always our preference, as this can be caustic, and we have generally found reduced viability when adding this method. Some tumor types will be more amenable to mechanical dissociation with high viability while others will be more appropriate for chemical digestion. This varies not only with tumor type, but site of collection, and patient heterogeneity. Therefore the decision to add chemical dissociation is often a case-by-case basis, depending on the success of mechanical dissociation. If the tumor is especially dense, starting with chemical dissociation may provide maximal yield and viability. Alternatively, a combination can be used, whereby cells are first mechanically dissociated using the above protocol, followed by chemical digestion of firm residual tumor that was not released by this method. The principals of chemical dissociation are using an enzyme to digest the physical bonds between the tumor cells and the extracellular matrix.
Materials
-
Enzymatic digestion solution (.25% Trypsin/EDTA)
The ideal digestion solution will depend on cell type to maximize viability. Commonly-used digestion solutions include hyaluronidase at 0.05 mg/mL and collagenase at 0.5 mg/mL
Tumor fragment
RPMI-1640 medium with 10% fetal bovine serum
1X PBS
Trypan Blue
70 μm sterile mesh filter
10 cm petri dish
No. 22 scalpel blade and blade handle
50 ml conical tube
Tissue forceps
10 mL, 5 ml, and 1 mL serological pipette
Protocol steps
After extraction of the tumor from the mouse or the patient, place the tumor in 10 ml of 1X PBS in a 50 mL conical tube and store the sample on ice until ready to begin dissociation
Add 10 ml of 0.25% trypsin/EDTA with or without hyaluronidae and collagenase to the 50 ml conical tube. If sample is small, can use 5mL of PBS and 5 mL of chemical digestion solution in a 10 mL conical tube.
Begin to dissociate the sample using the No. 22 scalpel blade and cut up the tumor sample in a chopping motion taking care not to crush the sample.
Place the sample in the conical tube and incubate at 37°C for 20 minutes.
Further dissociate the tumor sample by pipetting up and down the solution using a 10 mL serologic pipette until it passes freely, then a 5 mL and 1 mL pipette
Neutralize the trypsin-cell solution with 20 ml of RPMI-1640 medium with 10% FBS (or 10mL in a 15mL conical tube).
Using the 5-ml pipette, pass the cell suspension through a 70 μm sterile mesh filter placed over a new 50 mL conical tube to generate a single-cell suspension
Once the entire the cell suspension has been collected, collect 50 μL to use for counting and assessment of viability, centrifuge the remaining sample at 3,000 rpm (1500 × g) for 10 minutes at 4°C.
While samples is centrifuging, determine the number and viability of cells in the suspension using a hemacytometer and trypan blue exclusion.
Aspirate off media and resuspend the cellular pellet in cell culture media or PBS as desired for downstream applications, in the appropriate volume needed for these applications, based on cell density calculated by trypan blue exclusion.
BASIC PROTOCOL 2: IDENTIFICATION OF CELLS BASED ON SURFACE MARKER EXPRESSION AND SEPARATION BY FLOW CYTOMETRY
Using flow cytometry is a key technique that allows separation of putative CSCs from the heterogeneous population isolated from a primary tumor. Sorting with flow cytometry allows the separation of marker positive cells from the marker negative cells. If the tumor specimen being investigated is derived from a mouse xenograft, it allows for the separation of murine cells from human tumor cells if that is required, either using an antibody against a tumor-specific antigen to isolate tumor cells, or an antibody against the species-specific HLA antigen to separate species-specific cells. Another advantage of flow cytometry is that multiple markers can be used to sort the population simultaneously, allowing potentially positive and negative selection (i.e. inclusion of CD44-positive cells, but exclusion of CD45 positive lymphocytic cells). For those new to flow cytometry, multiple tutorials are available online from academic (University of North Carolina and Purdue University) and commercial websites (Life Technologies and BD Biosciences), and in Current Protocols. Equally important is appropriate analysis of flow cytometric data (Herzenberg et al., 2006) using software packages such as FlowJo (Tree Star, Inc) and FCS Express (DeNovo Software).
Materials
Single-cell suspension of cancer cells (from basic protocol 1)
Phosphate-buffered saline, calcium- and magnesium-free (CMF-PBS) with 0.1% bovine serum albumin (BSA; CMF-PBS/0.1% BSA)
Antibodies for desired surface marker(s) conjugated to a fluorophore (antibodies validated for use in flow cytometry work best, i.e. from BD Biosciences)
5-ml polystyrene tubes
Preferred cell culture media
Flow cytometry machine with appropriate channels for fluorochromes being used - either as just a reader or to allow separation of populations (“sorting”). It can be extremely useful to consult with your flow cytometric core facility prior to ordering supplies to ensure reagents are appropriate for the machine used.
Biological safety hood
Protocol steps
Take the single cell suspension from Protocol 1 and after determining the total number of cells present using a hemocytometer, generate a cell pellet by centrifuging the sample at 3,000 rpm (1500 × g) at 4°C for 10 minutes.
Aspirate off the supernatant and re-suspend the cellular pellet in CMF-PBS/0.1% BSA at a concentration not exceed 1 × 10⁷ cells/mL. For sorting purposes, the cell concentration should be as high as possible to allow reduced time of sorting, but if the concentration is too dense, the flow cytometer can get clogged. This depends on cell size and reliability of cells being in a single-cell suspension rather than clumps. A good starting point is 5×10⁶ cells/mL. For reading only (not sorting), cell density can be reduced to avoid clogging and reduce antibody use, i.e. a concentration of 1 × 10⁶ cells/mL
Add fluorophore-conjugated antibodies to the sorting sample, concentration varies by antibody type, but generally 1:50 to 1:100.
Incubate the samples with the antibodies for 30 to 45 minutes at 4°C, protected from light.
Add 4 ml of CMF-PBS/0.1% BSA to each tube and centrifuge for 5 minutes at 3,000 rpm (1500 × g) at 4°C. Carefully discard the supernatant. Repeat this step two more times to wash the cells.
After the last wash, re-suspend the cells to a maximum 1 × 10⁷ cells/mL concentration of CMF-PBS/0.1% BSA.
Pass a small volume of cells through the flow cytometer to identify population to be sorted using flow cytometric software. Ideally there is a marked separation between negatively stained cells and strongly positive cells, so that sorting by marker positive is pure and reliable. If the signal of the population is normally distributed, and only the “most” positive cells at the end of the bell-shaped curve are marked for isolation, it is important to confirm the cells are indeed more positive than the rest of the population (see step 8).
After sorting, run a small sample of the isolated cells through the cytometer to confirm that the population is pure. Some quenching of the signal is to be expected, but should retain >95% purity.
ALTERNATE PROTOCOL 2: ISOLATING CANCER STEM CELLS USING MAGNETIC BEAD SEPARATION
The use of a flow cytometry is not always a resource that is readily available to a researcher. An alternative method of sorting a cell population into putative cancer stem cells is to use magnetic bead separation. A disadvantage of magnetic beads is that if multiple markers are required for identification of the population of interest, they must be done in series, rather than concurrently, increasing the time required and potentially the viability of the final sample. However, if large numbers of cells must be sorted to achieve an adequate sample, magnetic bead separation may be able to accomplish this more quickly than with flow cytometry since all cells are processed simultaneously, instead of one cell at a time. The most important factors are maximizing viability, and having a separation as pure as possible. Purity of the sample ultimately depends on the quality of the antibody, and therefore trial an error may be required to determine if magnetic bead separation or flow cytometric sorting provides the more pure samples. Multiple sources of magnetic beads and methods are available, with the most commonly used being the EasySep system (Stem Cell Technologies), Dynabeads (Life Technologies) and Magnetic-activated cell sorting (MACS) (Miltenyi Biotec).
Using a similar principal to immunoprecipitation, magnetic bead separation uses antibodies conjugated to a magnetic bead. Cells that have surface markers recognized by antibody will be bound to the magnetic beads and by using a magnet, populations can be separated into marker positive versus marker negative. Unlike flow cytometry, only one marker at a time can be used for separation of the mixed cell population. If the desire is to isolate a population of putative cancer stem cells that is positive (or negative) for a panel of markers, the procedure would have to be repeated sequentially until a select cell population remains. If antibodies against a particular marker are not available, some manufacturers have products that will allow any primary antibody to be used (See Support Protocol 2)
Materials
EasySep™ (or equivalent) magnet
1.5 ml polypropylene (microcentrifuge) tubes
37°C incubator or water bath
12 × 75 mm polystyrene tubes (Falcon 5 mL round-bottom tubes work very well)
Phosphate-buffered saline, calcium- and magnesium-free (CMF-PBS) with 2% fetal bovine serum and 1mM EDTA (FBS; CMF-PBS/2% FBS/1mM EDTA)
FITC-conjugated antibody of marker of interest (or biotin-conjugated)
Single cell suspension of cancer cells prepared in Basic Protocol 1
EasySep (or equivalent) magnetic nanoparticles
Hemocytometer and cell counting materials
Species specific FcR blocking antibody (same species as the FITC- or biotin-conjugated antibody)
Protocol steps
This protocol is designed for processing 100 μl – 2.5 ml of cell suspension (up to 5 × 10⁸ cells).
Take the single cell suspension from Basic Protocol 1, and after determining the total number of cells present with a hemocytometer, generate a cell pellet by centrifuging the sample at 3,000 rpm at 4°C for 10 minutes.
Carefully remove the supernatant and re-suspend the cells at a concentration of 1 × 10⁸ cells/mL in CMF-PBS/2% FBS/1mM EDTA and transfer to a 12 × 75 mm polystyrene tube. If the sample contains 107 cells or fewer, then only resuspend in 100 μl. SEE Support protocol 2 if a fluorochrome-conjugated antibody is not available for desired cell surface marker
Add species-specific FcR blocking antibody at 100 μl/ml
Add FITC-conjugated (or biotin-conjugated) antibody at a final concentration of 0.3–3.0 μg /ml. Mix well and incubate at room temperature for 15 minutes. Titrate FITC- or biotin-conjugated antibody for optimal purity and sample recovery. Marker positive cell recovery will increase with higher amount of antibody labeling; however, too much antibody can give some false positive labeling.
Add EasySep FITC (or biotin) selection cocktail at 100 μl/mL of cells. Mix well and incubate at room temperature for 15 minutes.
Mix magnetic nanoparticles to ensure that they are in a uniform suspension by vigorously pipetting 5 to 10 times. Add the nanoparticles at a concentration of 50 μl per mL of cells.
Mix the sample well and incubate at room temperature for 10 minutes.
Bring the cell suspension to a total volume of 2.5 mL by adding CMF-PBS/2% FBS/1mM EDTA. Mix the cells in the tube by gently pipetting up and down 2–3 times. Place the tube without a cap into the EasySep Magnet and incubate for 5 minutes.
Pick up the magnet and in one smooth motion, invert the magnet and the tube pouring off the supernatant fraction into a new tube. Leave the magnet/tube inverted for 2–3 second but do not shake the magnet to get spare drops.
Remove the tube from the magnet and add 2.5 ml of CMF-PBS/2% FBS/1mM EDTA. Mix the cell suspension once again by pipetting up and down 2–3 times. Place the tube back into the EasySep magnet and allow it to incubate for 5 minutes.
Repeat steps 10 and 11, and then 10 once more for a total of 3 × 5 minute separations in the magnet. Each time collect the negative-selected cells in the same tube.
After the last separation, remove the tube from the magnet. Re-suspend the cells in the medium of choice at a concentration needed for downstream applications required (ie injection, culture, collection of protein lysate, extraction of mRNA, etc).
SUPPORT PROTOCOL 2: USING THE EASYSEP “Do-It-Yourself” IF A CONJUGATED ANTIBODY IS NOT AVAILABLE
When a commercially available FITC- or biotin-conjugated antibody to use in magnetic bead separations is unavailable, it is possible to make the tetrameric antibody complexes needed to bind the target cells to the magnetic beads. While this adds additional steps to the procedure, there is no reason to expect the yield or purity of the collection to decrease. The over-arching principles are the same.
Materials
Same as Alternate Protocol 2 with the following additions:
37°C incubator or water bath
Mouse IgG1 monoclonal antibody for surface marker of interest.
EasySep “Do-It-Yourself” Selection Kit
Protocol steps
The first step is making the tetrameric antibody complex. Add 15 μg of the mouse IgG1 monoclonal antibody dissolved in CMF-PBS into a 1.5 mL polypropylene tube. Record the volume as the total volume of the antibody cannot exceed 800 μl.
Add 100 μl of component A from the EasySep kit to the vial and mix well.
Add 100 μl of component B to the vial from the EasySep kit and mix well. Close the tube and place into a 37°C incubator (or water bath) for 5 hours or overnight.
Bring the vial to a final volume of 1.0 ml by adding the appropriate volume of sterile CMF-PBS. The tetrameric antibody complex cocktail should be stable for up to 1 year if stored at 4°C. Do not freeze the cocktail.
Continue the separation of the cell population at Step 6 of the above protocol using the home-made cocktail.
BASIC PROTOCOL 3: ISOLATING CANCER STEM CELLS BASED ON HOECHST DYE EXCLUSION: THE SIDE POPULATION
When attempting to first identify putative CSCs in either a primary tumor sample or a mouse xenograft tumor, or even a cell line, sometimes it is not known what the surface markers will be for the population. Numerous researchers have demonstrated that Hoechst 33342 dye can be used in conjunction with flow cytometry to identify the so-called “side-population” of cells that have CSC features. The principle of the Hoechst dye exclusion method is based on the fact that Hoechst 33342 dye will stain DNA and is also fluorescent. Thus the unique fluorescent profile of Hoechst 33342 can identify a minority side population of cells that was highly enriched for markers of hematopoietic stem cells (Goodell et al., 1996). The unique property of the side-population is they efflux the dye more efficiently than normal cells leading to low Hoechst dye staining, or dye exclusion. This efflux ability has been identified to be the result of an increase in the activity of multi-drug resistance proteins, primarily ABCG2, which actively transport Hoechst dye out of the cell nucleus.
Materials
Water bath at 37°C
Hoechst 33342 dye
Verapamil (Sigma)
Single-cell suspension of cancer cells
Preferred culture medium
5 ml polystyrene tubes
Flow cytometry machine and related reagents
Sterile phosphate-buffered saline, calcium- and magnesium-free (CMF-PBS)
Protocol steps
Maintain the preferred cell culture media at 37°C before beginning this protocol
Take the single cell suspension from Protocol 1 and after determining the total number of cells present using a hemocytometer, obtain a cell pellet by centrifuging the sample at 3,000 rpm at 4°C for 10 minutes.
Carefully aspirate off the supernatant and re-suspend the cells in the 37°C culture media at a concentration of 1 × 10⁶ cells/ml.
Add Hoechst 33342 to the cells suspension to produce a final concentration of 5 μg/ml. In parallel, have a separate tube in which verapamil 50μg/mL is added, which inhibits Hoechst exclusion and is used to identify the “Hoechst-low” cells.
Mix the cells and dye well and incubate at 37°C for 90 minutes. During the incubation, mix the cells every 15 minutes with low-speed Vortex
After the incubation, centrifuge the cells at 3000 rpm (1500g) at 4°C for 10 minutes to produce a cellular pellet.
Re-suspend the cells in sterile CMF-PBS at 4°C. At this point, the cells may be separated by flow cytometric sorting. The population with low Hoechst staining is identified by noting the location in which cells exposed to verapamil retain strong Hoechst fluorescence.
To identify the side-population, an ultraviolet laser on the flow cytometer is required to excite the Hoechst dye, so this availability should be confirmed prior to testing. Fluorescence for Hoechst dye can be measured at 450 nm (Hoechst blue) and 675 nm (Hoechst red).
When running the sample through the flow cytometer, a live gate needs to be established first to exclude red blood cells present in the sample and dead cells. The flow cytometry core should be able to assist with the gating.
The side population can be sorted from the non-side population and be kept for downstream experiments analyzing the characteristics of the side population.
BASIC PROTOCOL 4: DETERMINING TUMORIGENICITY OF PUTATIVE CANCER STEM CELL
In the above protocols several different methods to isolate a population of cells believed to have characteristics of CSCS have been outlined. There are any number of biologic characteristics that might be explored to determine how this population may differ from the marker-negative population. These include: expression profiling; in vitro assays of chemotherapy or radiation resistance; formation of tumor spheres; migration/invasion assays; demonstration of enhanced pluripotency (by examining heterogeneity of subsequent tumors/generations of isolated populations) and more. However, the current gold standard for establishing a population as CSCs is demonstration of enhanced tumorigenicity in murine xenografts. A common way to measure this is determining what amount of cells injected into NOD-SCID mice results in tumor formation in 50% of the mice injected. As CSCs have increase tumorigenicity, they will be able to form tumors at a lower cell count as compared to a non-CSC population. There is no established standard for how much more tumorigenic a population should be to be considered a CSC, but in general at least 50–100 fold less cells (compared to a marker-negative population) should be observed to achieve tumor formation in 50% of mice. It is also important to note that xenograft formation is not solely dependent on the population - the choice of mouse strain can have an impact on the rate of tumor formation. NOD-SCID have an almost complete knock-out of their immune system and provide an ideal model for injecting human tumor cells. However, this mouse line is susceptible to spontaneous lymphoma formation, often in less than a year of life. Similarly, IL2 receptor-γ chain deficient mice, which also lack NK cell function, require fewer cells to establish xenografts, but due to their severe immunocompromised state are difficult to maintain. When considering in which mouse model to conduct the following studies, it is important to weigh the benefits and risks of each model in terms of the study outcome. Taking these factors into account, we have generally used SCID mice as our primary model. No matter which model is selected, the most aspect is to have consistency and appropriate controls with both marker-positive and marker-negative populations examined.
Materials
6–8 week old SCID mice of desired gender kept in approved IACUC and ARP conditions
Putative cancer stem cell population sorted via one the above protocols
Non-cancer stem cell population sorted via one of the above protocols
Isoflurane
Vaporizing anesthesia device with access to clinical-grade oxygen
1 ml syringe
25-gauge needles
Matrigel, preferably without added growth factors (optional)
Preferred cell culture medium
Betadine scrub
Protocol steps
Gather sorted cell populations from previous protocols and place them on ice while preparing for injection.
Create serial dilutions of the CSC positive population and the non-CSC population. Ideally tumorigenicity should be examined across a wide range of cell densities implanted into animals, i.e. 1 million cells, followed by 250,000, 100,000; 25,000; 5,000; 1,000; and finally 100 cells. Often, because of the small proportion of tumor comprised of CSCs, obtaining numbers as high as 1 million cells are not feasible.
These dilutions should be a concentration to equal the desired # of cells per 100 ul.
Prepare enough volume of cell suspension at various concentrations in order to implant at least 5 mice per dilution and cell population type in the subcutaneous tissue on the flank of the mouse. SEE Annotation 1
Remove the Matrigel from the freezer - keep on ice, since it will solidify at room temperature.
Mix cells for injection and Matrigel together at a 1:1 ratio and draw up into a syringe with a 25-guage needle. Keep the syringe on ice prior to injecting the mice. Note that mixing cells with Matrigel is optional, but likely improves tumor formation rate.
-
Place mice into anesthesia induction chamber and induce anesthesia using 5% isofluorane at a rate of 0.7 L O2/min.
Consult with local IACUC regulations regarding appropriate anesthetic procedures.
Once the mouse is unconsciousness and does not respond to a foot squeeze to test for pain, transfer the mouse to a nose cone and maintain anesthesia using 1.5–2% isofluorane.
Clean the skin of the mouse being injected with a betadine scrub. If using hair-bearing mice, it is beneficial to have previously removed hair over the area to be injected, either by clipping or chemical (i.e. Nair) methods.
Using one hand to hold the skin of the mouse’s flank taunt, insert the needle bevel up at a shallow angle to prevent from penetrating beyond the subcutaneous layer. Inject 200 μl of Matrigel/cancer cells into the mouse. If the needle is properly placed in the subcutaneous layer, a small bump should form on the skin.
Place the mouse in a new cage using an appropriate warming method to recover from the anesthesia.
Observe mice periodically for tumor formation. Histologic confirmation that tumor is of expected cell type (not a lymphoma for example) should be obtained. Most tumors will form within 3–4 months, sometimes as quickly as 1 month. Mice should be observed for at least 6 months before declaring a population as negative regarding tumor formation. SEE annotation 2.
Step annotations
Tumor cells can be injected in different sites depending on the design of the experiment, the tumor cell type, and mouse strain. For example, if studying breast cancer, cells can be easily injected into the mammary fat pads of the mouse and still followed for development. For ovarian cancer cells, mice can be injected intraperitoneally, however in that location it is difficult to follow tumor development and instead a fixed time point would be needed to analyze the amount of tumor formation. Small animal imaging techniques might assist with this approach.
The choice of endpoint for this experiment will be tumor cell dependent. If working with a cancer cell line, the time for tumor formation will most likely be lower than when working with a primary patient tumor sample. Also some cancers naturally grow faster than others. However, it is important to have a fixed time for the endpoint of the experiment as this will allow for a determination of amount of cells that leads to 50% tumor formation and an accurate determination if the cancer stem cell population is more tumorigenic than the non-cancer stem cell population.
BASIC PROTOCOL: SPHEROID ASSAY OF PUTATIVE CANCER STEM CELLS
One method for potential in vitro cultivation of stem cells and progenitor cells is through growth differentiation-inhibiting conditions. This involves growth in a specialized media containing growth factors that inhibit differentiation, and in culture plates where cells cannot attach, which leads to differentiation. Under these conditions cells generally grow in semi-fused spheroids, floating suspended in the supernatant, and distinguishable in appearance from simple aggregates of cells, with which they are often confused (Figure 3A). Cells within spheroids are more self-renewing and pluripotent, and it is possible only certain pluripotent cells can develop into spheroids. Originally developed as the only method by which primitive neural tissue would grow, and termed neurospheres (Reynolds and Weiss, 1996), it has been adapted as a method to propagate putative cancer stem cells as well. Although this method is convenient for studying stem cells in vitro, it is not proven that only cancer stem cells can grow as spheroids, or that cells growing as spheroids definitively originate from a stem cell – that distinction is generally attributed to tumorigenicity in vivo. However, spheroids definitely have increased expression of stem cell markers, and prolonged self-renewal, and therefore not only are a convenient mechanism to study stem cell biology and response to therapeutics, but also a finding of enhanced ability to form spheroids does suggest a subpopulation carries stem cell properties. The following protocol is adapted from that originally described for neurosphere growth, later applied to establishment of mammary spheroids by Dontu and Wicha (Dontu et al., 2003).
Figure 3. Spheroid growth in a heterogeneous sample.

Unsorted A2780 ovarian cancer cells were plated in serum-free differentiation-inhibiting media on ultra-low attachment plates. A spheroid of fused cells is noted to have a different phenotype than the majority of dividing cells, which remain attached as aggregates but not spheroids (A). Cells plated as a single cell per well can sometimes form spheroids, which can be maintained for several weeks (B).
Materials
Cells as heterogeneous population, or subpopulations
Costar ultra low attachment multiple well plates (Corning product #3473)
Recombinant FGF-basic (Gibco product #PHG0021L)
Recombinant EGF (Gibco product #PHG0311)
B-27 supplement (Gibco product #12587-010)
Protocol Steps
Gather cell subpopulations separated by flow cytometry or magnetic beads, or mixed population if desired
Add 2mL of 50x stock B-27 supplement to 98mL of serum-free media of choice for cell line used. Add 20μL of stock 100μg/mL recombinant FGF-basic and 20μL of stock 100μg/mL recombinant EGF. This media is stable for 4 weeks at 4°C.
In order to determine the frequency of spheroid formation, use 96-well plates. Prepare a solution of cells such that on average 1 cell will be delivered in every other well. For administration of 200μL per well, this is a concentration of 2.5 cells/mL
Prepare 20mL of 2.5 cells/mL in above media. Mix well, add 200μL to each well. Culture at 37°C
Every 3–4 days, refresh wells with 25μL of FGF-basic and EGF-containing media. FGF-basic and EGF will lose activity at 37°C after a few days, and often formed spheroids can be seen to lose their cohesion.
The endpoint in this example is the percentage of cells (out of presumed 48) that form spheroids. Alternatively, cells can be plated 1000 cells in 2mL in 6-well plates, with endpoint being number of spheroids formed per well. Different cell subpopulations, or conditions (such as inhibitors of stem cell pathways or siRNA-mediated down-regulation) can be set up in each well.
Spheroids can often be maintained for 3–4 weeks, giving ample time to add therapeutics to different spheroid-containing wells to determine toxicity
SAMPLE DATA FROM CSC DETERMINATION
Hypothesis: Population X identified by expression of hypothetical marker CD555 represents a cancer stem cell population.
Result 1: Population identification
Solid tumor samples were collected from the operating room, dissociated into single cell populations. Flow cytometric analysis demonstrates that CD555-positive cells represent a distinct population when compared to the rest of the tumor, and that population is a relatively small portion of the tumor cells (Figure 1).
Figure 1. CD555 expression in a heterogeneous population.
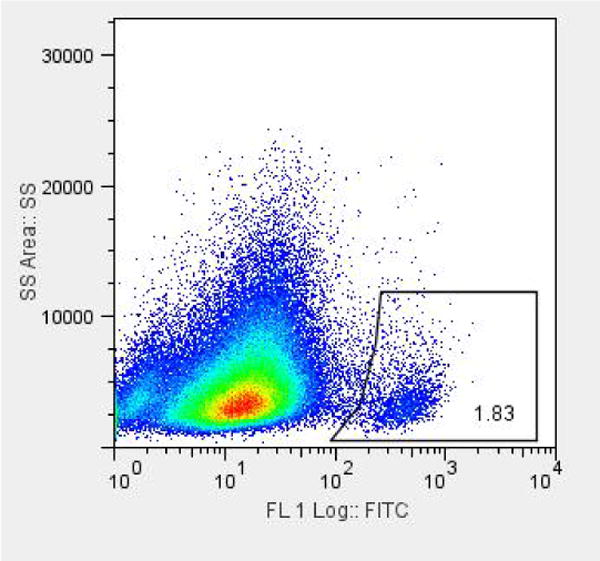
Dissociated cells from a freshly-collected solid tumor were subjected to flow cytometric analysis after exposure to anti-CD555-FITC antibody. Gating based on the negative control shows that 1.8% of cells are CD555-positive.
Result 2: Tumorigenicity and Differentiation
In 5 consecutive cases, tumors were collected, dissociated, and CD555-positive cells were separated by flow cytometric analysis from CD555-negative cells. After sorting, flow cytometric analysis was repeated on the sorted cells to confirm they maintained a positive signal. They were then injected subcutaneously in limiting dilutions into SCID mice and followed for growth for 3 months. Mice with developing tumors are described in Table 1. CD555-positive cells had 250-fold increased tumorigenicity when compared to CD555-negative cells, that it took 250x-more cells to have a 50% tumor development rate. Tumors that formed after injection of CD555 cells were dissociated and subjected to flow cytometry for CD555. These tumors contained both CD55-positive and –negative cells, with the positive cells again making up less than 5% of the tumor.
Table 1.
Growth of CD555-Negative and CD555-Positive Cells in Subcutaneously Injected Mice
| Cells injected
|
|||||||
|---|---|---|---|---|---|---|---|
| 1×10⁶ | 2.5×10⁵ | 1×10⁵ | 2.5×10⁴ | 5×10³ | 1×10³ | 2.5×10² | |
| CD555-negative | 10/10 | 7/10 | 1/10 | 0/10 | 0/10 | 0/10 | 0/10 |
| CD555-positive | 10/10 | 10/10 | 10/10 | 10/10 | 7/10 | 1/10 | |
Result 3: Chemotherapy resistance
CD555-positive and –negative cells were sorted by flow cytometry and plated into 96-well plates, 2000 cells per well using conventional serum-containing media. Separate samples were plated into 6-well plates in conventional media. After 6 hours to allow attachment, the media was replaced with increasing concentrations of carboplatin. Cells were allowed to continue to grow for 5 days and subjected to MTT assay for viability. CD555-positive cells had increased survival compared to CD555-negative cells (Figure 2). Additionally, cells separately plated with analyzed by flow cytometry. Cells growing from CD555-positive cells were 50% CD555-positive and 50% -negative, while the cultured cells from the original CD555-nagetive cells had reduced proliferation, and were all CD555-negative.
Figure 2. Platinum resistance in the CD555 population.

Dissociated cells were sorted by flow cytometry based on CD555 expression, and plated into 96-well plates, 2000 cells per well. After 6 hours, media was exchanged for media with increasing concentrations of carboplatin or vehicle. After 5 days cells were subjected to MTT. CD555-positive cells were much more resistant, demonstrating a carboplatin IC50 of 82nM, while CD555-negative cells had an IC50 of 4.4nM.
Result 4: Spheroid growth
A2780 ovarian cancer cells were grown in stem-cell promoting media (serum-free with supplemental B-27 with FGF-basic and EGF), and it was noted that several spheroids formed, while some cells only grew in aggregates (Figure 3A). CD-555-positive and –negative cells were separated by flow cytometry and plated onto ultra-low attachment plates in B-27 supplemented serum-free media with FGF-basic and EGF. 200μL of a 2.5 cells/mL solution was added to each well of a 96-well plate and placed in 37°C incubator – one plate for CD555-positive cells, and one plate of CD555-negative cells. The following day each well was examined, and 40 wells in the CD555-positive plate had an identifiable cell, and 52 wells had an identifiable CD555-negative cell. Every 4 days the media was refreshed with 25μL. After 2 weeks, 25 of the CD555-positive cells had formed a spheroid (62.5%, Figure 3B), while only 4 of the CD555-negative cells had formed spheroids (7.7%).
COMMENTARY
Background Information
Over the past 40 years, there have been major advances in cancer treatment that have led to an overall increase in the 5-year-survival rate of all cancers from 50%–68% (Siegel et al., 2012). Some types have cancers have seen a greater increase in 5-year survival in comparison to others. For example, breast cancer has seen an overall increase from 75% in the 1970s to 90% in 2006, while ovarian cancer and brain cancer have only seen increases of 37%–45% and 24%–36%, respectively (Siegel et al., 2012). The reason for mortality from cancer is usually the result of a tumor no longer responding to treatment or recurring at distant sites from the primary origin. This ability of a cancer to recur and later resist chemotherapy indicates there is a population of cancer cells that survive primary therapy and are responsible for mortality. This can be either due to inherent resistance to chemotherapy or evolution of cells by additional mutations or environmental factors that lead to development of chemoresistance. Which of these mechanisms predominates is unknown. A subpopulation of cells with enhanced tumorigenicity, self-renewal, and differentiation capacity has been labeled “cancer stem cells” (CSC) due to similar biologic features to normal stem cells. There are three key observations that are used to define a CSC population. First, only a minority of the cancer cells within a heterogeneous tumor have tumorigenic potential when implanted into immunocompromised animals. Second, CSCs can be identified through distinct properties, e.g. expression of surface markers or enhanced biologic activity such as ALDH1A1 activity that allows them to be isolated from the non-CSC population. Finally, tumors that develop after CSC injection contain both CSC-positive and CSC-negative cells, demonstrating enhanced differentiating capacity (Dalerba et al., 2007a). It is not known whether or not the cells within a presenting tumor that survive initial chemotherapy are the same as the CSCs that are isolated and tested ex vivo, although there is evidence to suggest that this is at least in part the case (Steg et al., 2012).
The evidence supporting the CSC theory was first presented in human acute myeloid leukemia (AML) by Lapidot et al in 1994. In this study, the authors were able to identify a subpopulation of cells that were CD34+ and CD38− positive which were the only ones that were tumorigenic and had the ability to re-capitulate the AML disease phenotype in mice (Lapidot et al., 1994). The malignant phenotype could be reproduced with the injection of just a single cancer cell. After this discovery, work began in earnest to identify if other tumor types in addition to leukemia also had this subpopulation of cells. The idea was if the CSC population could be targeted and eliminated, a tumor could truly be defeated. Investigation of CSCs in solid tumors was carried out following the same paradigm that was used in the discovery of CSC in AML. Unfortunately in the solid tumor the additional complexity of reducing the dense mass to a single-cell population while retaining viability was an inhibitor to progress. Putative CSCs had previously been identified in gliomas by the observation that “neurospheres” formed from non-malignant neurons contained cells with properties of stem cells (Reynolds and Weiss, 1992). When the technique of growing neurospheres was applied to gliomas, a CD133+ subpopulation was discovered that met the definition of CSCs (Galli et al., 2004; Singh et al., 2004). The Singh study was interesting as it demonstrated that as few as 100 CD133+ cells needed to be injected into the orthotopic location in SCID mice for a tumor to form that recapitulated the entire heterogeneity of a human glioblastoma. CSCs were also identified in breast cancer, colon cancer, and ovarian cancer using the same methods (Dalerba et al., 2007b; Dontu et al., 2003; O’Brien et al., 2007; Zhang et al., 2008).
When attempting to study CSC, the markers used will depend on cancer type. The methods presented in this paper provide one methodology to isolate a subpopulation from a solid heterogeneous tumor. Mastering these techniques will allow a researcher to identify based on either surface marker expression or a functional assay, a sup-population of cancer cells and determine if they meet the currently accepted criteria for a CSC. Once isolated, it can be determined how they are biologically distinct from the non-CSC population, and what drug combinations or novel targets may allow for the CSC population to be eliminated. Targeting the subpopulation of cells surviving initial chemotherapy, whether CSCs or otherwise, will be required in order to achieve durable cures.
Critical Parameters and Troubleshooting
There are a few aspects to consider when conducting these protocols. First, how fresh a tumor specimen is will largely influence cell viability and isolating a CSC population. As this protocol defines two types of tumor specimens, one from patients and one from xenografted mice, the ability to procure fresh specimens will require a coordinated effort from surgical oncologists, pathologists, and operating room staff. The ability to receive a specimen and begin processing quickly, preferably less than 30 minutes after removal, will allow optimal results. When creating the single cell suspension, it is important to consider what effect the chosen method has on cell viability. If tumors are especially dense, a chemical dissociation should be considered in addition to mechanical dissociation in breaking the tissue up more quickly. Often this is at the sacrifice of viability in some cells. Optimization is needed at the dissociation step, whether using mechanical or chemical methods, in order to maximize viability and yield from the sample. Protocols may need to be modified slightly depending on a particular tumor – some are denser and would require additional processing, while others may come apart relatively easily, in which case additional chemical digestion would not be necessary and only compromise viability. For flow cytometry, sorting for live cells to be used in biologic applications (tumor implantation, cell culture, etc) is a more technical and complex task as compared to just sorting cells for a determination of surface marker expression. Additional time is required for sorting, during which some signal intensity can be lost. It is important to re-test a sorted cell population to ensure the sorting was accurate. A balance must be achieved between a dense concentration of cells to minimize the volume sorted (thus minimizing time) while avoiding a solution so dense that clogging the flow cytometer channels may result. Always check with the flow cytometry facility you are using that they are capable of doing a live cell sort that will keep sterile conditions and prevent contamination. Another critical parameter is the choice of mouse strain. We have found that using SCID mice is ideal, with a combination of longevity and resistance to infection, but still with an immunocompromised state that allows human tumor uptake.
Anticipated Results
It can be expected that from 1 gram of tumor sample, 7–10 million cells can be isolated with 90% viability. This assumes that the dissociation protocol has been optimized for the tissue type that is being studied. In the flow cytometry and magnetic bead separation protocols, the CSC population will typically be a very small fraction of the total cell population. This population can range from <1% to 10% of the total cell population. Caution should be taken if a freshly isolated cell suspension has a CSC population that is approaching the majority of the cell population. This could indicate that the cell surface marker used is not selective enough. In this instance, either another antibody can be utilized that has more specific binding.
For the in vivo protocol of developing a xenograft in the mice in the limited dilution studies, it is frequently noted that CSCs can form tumors with as few as 100 injected cells and can be 25–100 times more tumorigenic than the non-CSC injected cells. Frequently published data reflect higher numbers being required for tumor formation, which may be a function of overall viability from tumor processing, or the mouse model used. The tumors that develop in the xenograft model should re-capitulate the phenotype of the originally implanted tumor and be made up of a heterogeneous cell population. A section of all xenografts that develop after both CSC and non-CSC tumor cell injection should be immediately tested by flow cytometry for density of CSCs, or saved for histological analysis to confirm that the developed xenograft is similar to the originally implanted tumor.
Time Considerations
The production of a single-cell suspension should only take an hour at the most, after which the cells will be ready for use. To form tumorspheres, cells in culture can take anywhere from 4 to 14 days. During this time, the cells should be kept in the incubator and fresh nutrients added to the media every 4 days until sphere formation occurs. Once formed, tumorspheres can often survive for weeks, but will often dissociate if nutrients are not replaced regularly. Primary cultures of adherent tumor cells usually will not last beyond few passages in vitro. For the tumor formation studies in the mice, the time will vary on cell type and number of cells injected. One should plan on tumor formation requiring observation for 2–6 months for initial tumor development, plus additional time for expansion and reimplantation to confirm maintenance of the tumorigenic phenotype.
Acknowledgments
Funding support provided in part by the University of Alabama at Birmingham Center for Clinical and Translational Science (5UL1RR025777), the Reproductive Scientist Development Program through the Ovarian Cancer Research Fund and the National Institutes of Health (K12 HD00849), and the Department of Defense Ovarian Cancer Research Academy (OC093443).
References
- Dalerba P, Cho RW, Clarke MF. Cancer stem cells: models and concepts. Annu Rev Med. 2007a;58:267–284. doi: 10.1146/annurev.med.58.062105.204854. [DOI] [PubMed] [Google Scholar]
- Dalerba P, Dylla SJ, Park IK, Liu R, Wang X, Cho RW, Hoey T, Gurney A, Huang EH, Simeone DM, Shelton AA, Parmiani G, Castelli C, Clarke MF. Phenotypic characterization of human colorectal cancer stem cells. Proc Natl Acad Sci U S A. 2007b;104:10158–10163. doi: 10.1073/pnas.0703478104. [DOI] [PMC free article] [PubMed] [Google Scholar]
- Dontu G, Al-Hajj M, Abdallah WM, Clarke MF, Wicha MS. Stem cells in normal breast development and breast cancer. Cell proliferation. 2003;36(Suppl 1):59–72. doi: 10.1046/j.1365-2184.36.s.1.6.x. [DOI] [PMC free article] [PubMed] [Google Scholar]
- Galli R, Binda E, Orfanelli U, Cipelletti B, Gritti A, De Vitis S, Fiocco R, Foroni C, Dimeco F, Vescovi A. Isolation and characterization of tumorigenic, stem-like neural precursors from human glioblastoma. Cancer Res. 2004;64:7011–7021. doi: 10.1158/0008-5472.CAN-04-1364. [DOI] [PubMed] [Google Scholar]
- Goodell MA, Brose K, Paradis G, Conner AS, Mulligan RC. Isolation and functional properties of murine hematopoietic stem cells that are replicating in vivo. The Journal of Experimental Medicine. 1996;183:1797–1806. doi: 10.1084/jem.183.4.1797. [DOI] [PMC free article] [PubMed] [Google Scholar]
- Herzenberg LA, Tung J, Moore WA, Herzenberg LA, Parks DR. Interpreting flow cytometry data: a guide for the perplexed. Nature immunology. 2006;7:681–685. doi: 10.1038/ni0706-681. [DOI] [PubMed] [Google Scholar]
- Jordan CT, Guzman ML, Noble M. Cancer Stem Cells. New England Journal of Medicine. 2006;355:1253–1261. doi: 10.1056/NEJMra061808. [DOI] [PubMed] [Google Scholar]
- Lapidot T, Sirard C, Vormoor J, Murdoch B, Hoang T, Caceres-Cortes J, Minden M, Paterson B, Caligiuri MA, Dick JE. A cell initiating human acute myeloid leukaemia after transplantation into SCID mice. Nature. 1994;367:645–648. doi: 10.1038/367645a0. [DOI] [PubMed] [Google Scholar]
- O’Brien CA, Pollett A, Gallinger S, Dick JE. A human colon cancer cell capable of initiating tumour growth in immunodeficient mice. Nature. 2007;445:106–110. doi: 10.1038/nature05372. [DOI] [PubMed] [Google Scholar]
- Reynolds B, Weiss S. Generation of neurons and astrocytes from isolated cells of the adult mammalian central nervous system. Science. 1992;255:1707–1710. doi: 10.1126/science.1553558. [DOI] [PubMed] [Google Scholar]
- Reynolds BA, Weiss S. Clonal and population analyses demonstrate that an EGF-responsive mammalian embryonic CNS precursor is a stem cell. Developmental biology. 1996;175:1–13. doi: 10.1006/dbio.1996.0090. [DOI] [PubMed] [Google Scholar]
- Siegel R, Naishadham D, Jemal A. Cancer statistics, 2012. CA: A Cancer Journal for Clinicians. 2012;62:10–29. doi: 10.3322/caac.20138. [DOI] [PubMed] [Google Scholar]
- Singh SK, Hawkins C, Clarke ID, Squire JA, Bayani J, Hide T, Henkelman RM, Cusimano MD, Dirks PB. Identification of human brain tumour initiating cells. Nature. 2004;432:396–401. doi: 10.1038/nature03128. [DOI] [PubMed] [Google Scholar]
- Steg AD, Bevis KS, Katre AA, Ziebarth A, Dobbin ZC, Alvarez RD, Zhang K, Conner M, Landen CN. Stem cell pathways contribute to clinical chemoresistance in ovarian cancer. Clin Cancer Res. 2012;18:869–881. doi: 10.1158/1078-0432.CCR-11-2188. [DOI] [PMC free article] [PubMed] [Google Scholar]
- Zhang S, Balch C, Chan MW, Lai HC, Matei D, Schilder JM, Yan PS, Huang TH, Nephew KP. Identification and characterization of ovarian cancer-initiating cells from primary human tumors. Cancer Res. 2008;68:4311–4320. doi: 10.1158/0008-5472.CAN-08-0364. [DOI] [PMC free article] [PubMed] [Google Scholar]