Abstract
Purpose
To evaluate the use of the double-echo steady-state (DESS) sequence for acquiring high-resolution breast images with diffusion and T2 weighting.
Materials and Methods
Phantom scans were used to verify the T2 and diffusion weighting of the DESS sequence. Image distortion was evaluated in volunteers by comparing DESS images and conventional diffusion-weighted images (DWI) to spoiled gradient-echo images. The DESS sequence was added to a standard clinical protocol, and the resulting patient images were used to evaluate overall image quality and image contrast in lesions.
Results
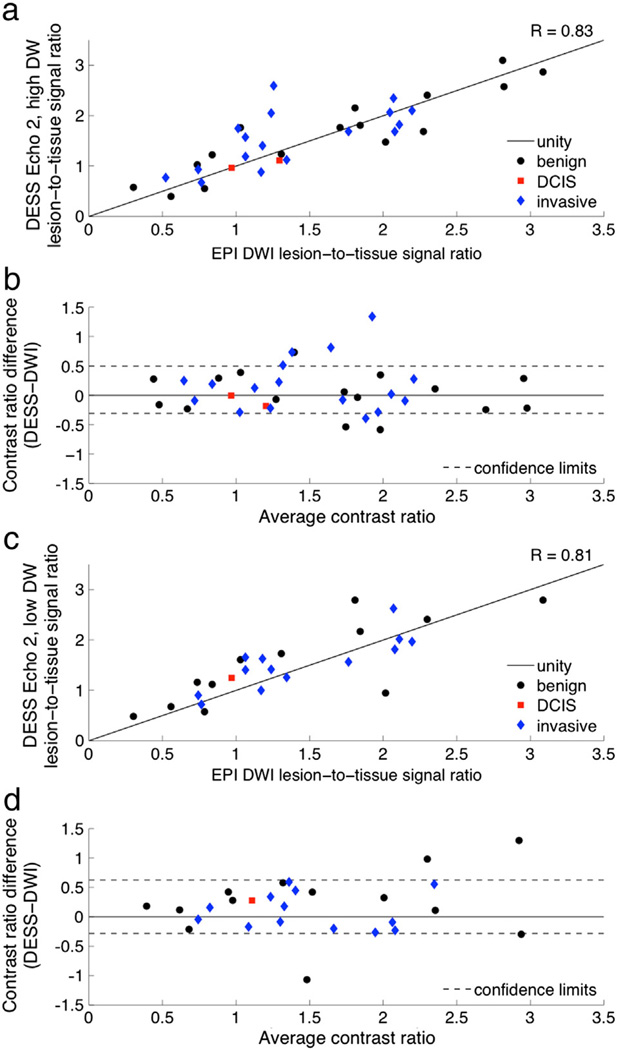
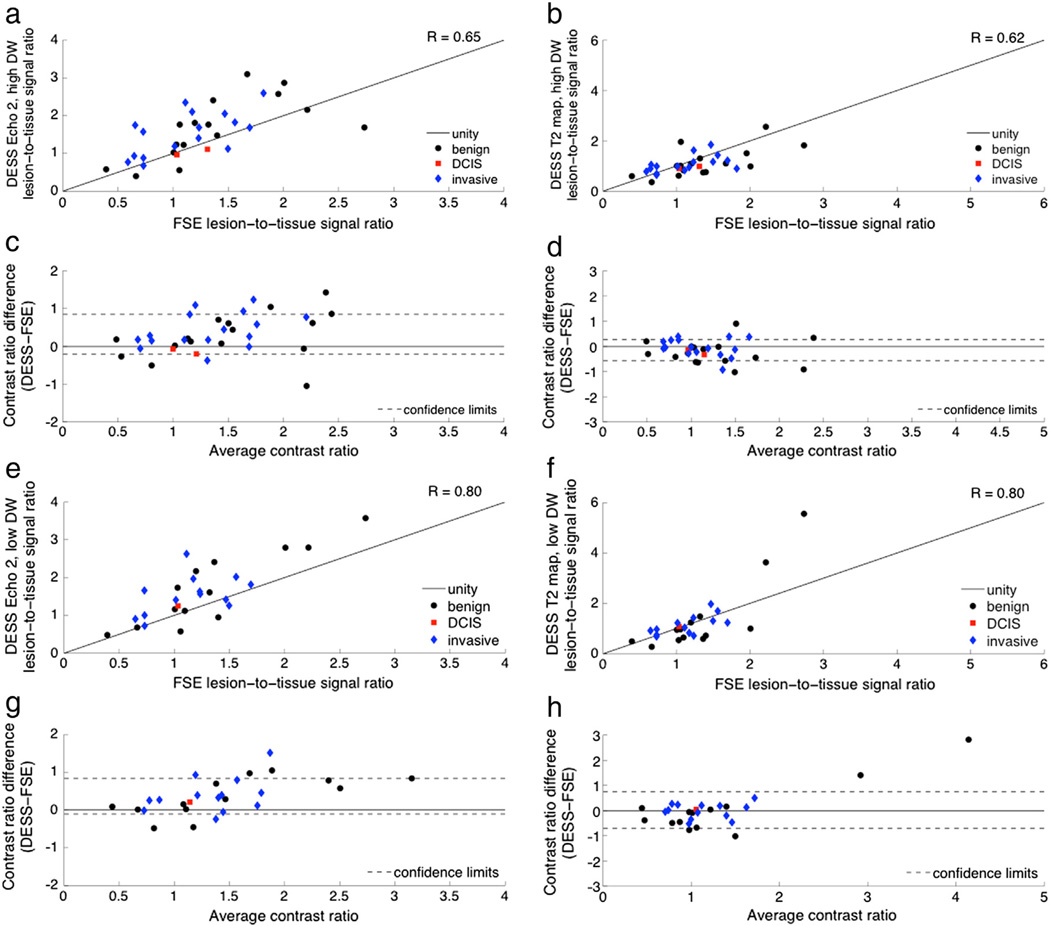
The diffusion weighting of the DESS sequence can be easily modulated by changing the spoiler gradient area and flip angle. Radiologists rated DESS images as having higher resolution and less distortion than conventional DWI. Lesion-to-tissue contrast ratios are strongly correlated between DWI and DESS images (R = 0.83) and between T2-weighted fast spin-echo and DESS images (R = 0.80).
Conclusion
The DESS sequence is able to acquire high-resolution 3D diffusion- and T2-weighted images in short scan times, with image quality that facilitates morphological assessment of lesions.
Keywords: Breast, 3D, DESS, DWI, Diffusion, T2
1. Introduction
High-resolution, three-dimensional (3D) diffusion-weighted breast MRI has the potential to improve the specificity and cost-effectiveness of breast MRI. High-resolution breast imaging is useful for detecting small tumors and identifying relevant morphologic features, such as shape, margins, spiculations, or architecture. Diffusion-weighted breast MRI can distinguish benign and malignant tumors without the need for an exogenous contrast agent [1,2] or can improve the specificity of breast MRI [3–5]. Currently, contrast-enhanced breast MRI screening is recommended for women with a high lifetime risk of developing breast cancer [6]. While contrast-enhanced MRI is very sensitive to breast cancer, it has limited specificity, is invasive, and is expensive. Therefore, women with a low or moderate lifetime risk of developing breast cancer may benefit from a non-contrast breast MRI screening protocol.
Diffusion-weighted imaging (DWI) typically uses a multi-slice excitation with a two-dimensional single-shot echo-planar imaging (EPI) acquisition, though a spiral or steady-state acquisition is sometimes used. A single-shot EPI acquisition may be used to limit the acquisition time and sensitivity to motion between excitations [7], but off-resonance results in geometric distortion, and signal decay during the readout limits spatial resolution [8]. Therefore, EPI is particularly challenging in the breast, where the shape of the breasts causes field variations that are difficult to correct with shims and where high-resolution imaging is desired for assessing tumor morphology. A spiral acquisition may be used to acquire higher-resolution diffusion-weighted breast images with shorter readout times than EPI allows [9,10], but off-resonance can lead substantial blurring. A steady-state acquisition with unbalanced gradients can acquire diffusion-weighted images efficiently and with small gradients due to its short repetition time (TR) [11–13], but has not been investigated for DWI in the breast. A steady-state acquisition allows for 3D imaging, with thinner and continuous slices, while avoiding the distortion and blurring associated with EPI. However, motion from the heart and lungs makes breast DWI difficult because the gradients that encode diffusive motion sensitize the sequence to macroscopic motion [14], which can cause image artifacts.
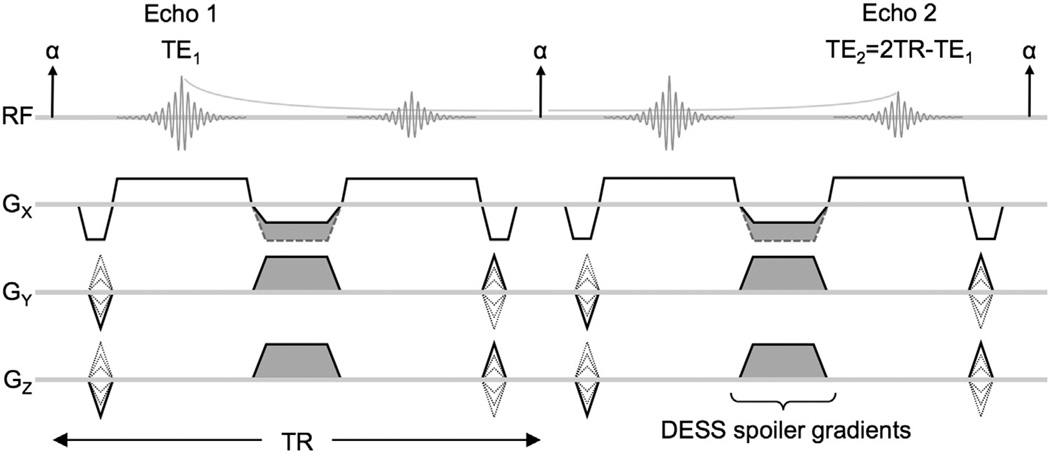
The double-echo steady-state (DESS) sequence (Fig. 1) acquires two echoes between consecutive radiofrequency (RF) pulses [15–17]. Some unbalanced gradient area is needed to form images without the characteristic banding artifact associated with balanced steady-state free-precession sequences [18,19]. The unbalanced gradient area can be applied to any combination of gradient axes and is collectively referred to as the spoiler gradient (Fig. 1, shaded regions). Because the sequence uses a steady-state acquisition, multiple echo pathways (spin echoes and stimulated echoes) contribute to the acquired signal of each echo. The first echo (Echo 1) is dominated by the free-induction decay signal due to the preceding RF pulse with echo time TE1. The second echo (Echo 2) is dominated by refocused signal (spin echo) from Echo 1 of the previous repetition, resulting in an effective echo time of approximately TE2 = 2TR − TE1 for moderate flip angles.
Fig. 1.
DESS sequence diagram showing two repetitions. Two echoes are acquired per TR with all gradients rewound except a non-rewound spoiler component (shaded), which is combined with dephaser/rephaser gradients if played on Gx. The spoiler gradients provide diffusion weighting because moving spins will experience different gradients before and after the refocusing RF pulse. The differences in gradient history will cause imperfect rephasing, resulting in signal loss.
The DESS sequence has most commonly been used for its T2 weighting; T2 can be estimated from the signal decay between Echo 1 and Echo 2 [16,20], and the square root of sum of squares of Echo 1 and Echo 2 has been used to generate images with high signal-to-noise ratio (SNR) and T2-like contrast [20]. Recently, the diffusion weighting of the DESS sequence has been exploited by modifying the spoiler gradients independently of the readout gradients; by acquiring images with different sequence parameters, the effects of T2 and diffusion can be separated to produce T2 and apparent diffusion coefficient (ADC) maps [21,22]. The T2 weighting of Echo 2 can most easily be increased by increasing TE2. The diffusion weighting can most easily be increased by increasing the spoiler gradient area and/or decreasing the flip angle.
Unlike spin-echo diffusion-weighted sequences, the diffusion weighting of a steady-state sequence depends on both sequence parameters and sample parameters. For spin-echo DWI, the diffusion weighting can be calculated from the diffusion-weighting gradients as a function of time [23] and can be summarized by a single b value. In steady-state DWI, both spin-echo and stimulated-echo pathways contribute to the acquired signal. Transverse magnetization is dephased and rephased by one or more diffusion gradients. Between gradients, magnetization spends a varying number of repetitions in the transverse plane, along the longitudinal axis, or both. The magnetization decays with T2 while in the transverse plane and with T1 while along the longitudinal axis [24]. Therefore, the tissue relaxation and diffusion properties; echo time; repetition time; flip angle; and spoiler gradient duration and amplitude affect the diffusion weighting of steady-state sequences [11,12]. For example, tissues with longer T2 experience more repetitions in the transverse plane before the signal decays, and thus more spoiler gradients affect the acquired signal. The flip angle affects the number of repetitions that the magnetization spends along the longitudinal axis between dephasing and rephasing gradients. The more repetitions spent along the longitudinal axis (where the magnetization is unaffected by the spoiler gradients), the longer the effective diffusion time, and thus, the greater the diffusion weighting. Additionally, the longer the magnetization spends along the longitudinal axis, the greater the T1 decay, which is relatively small in the range of T1 values expected in breast tissue and lesions. Collectively, these effects result in a complicated diffusion weighting that is dependent on both sequence parameters and sample parameters. Therefore, the diffusion weighting of a steady-state sequence cannot be quantified with a single value dependent only on sequence parameters as can be done for spin-echo diffusion-weighted sequences [13]. To emphasize the difference between the diffusion weighting of spin-echo and steady-state DWI, we use the term “diffusion sensitivity” to describe the effect of a particular combination of spoiler gradient area and flip angle on the DESS signal. It is very challenging to estimate ADC values because the signal equation is complicated and it is also necessary to estimate T1 and T2 values [21], all of which are even more challenging in the presence of susceptibility variations and macroscopic motion.
In this work, we acquire high-resolution, 3D diffusion- and T2-weighted images in the breast in short scan times and with low distortion using the DESS sequence. We evaluate image quality and contrast in phantoms and lesions and compare them to commonly used clinical sequences to test whether 3D DESS can provide higher resolution diffusion-weighted images than conventional EPI DWI.
2. Methods
The DESS sequence was evaluated qualitatively and quantitatively using phantom, volunteer, and patient data. Phantom scans were used to evaluate the contrast of the DESS sequence. Volunteer scans were used to compare the image distortion of the EPI and DESS sequences. Finally, patient images were used to evaluate image quality and resolution and to compare the image contrast of the DESS, diffusion-weighted EPI, and T2-weighted sequences in lesions. All images were acquired on a GE 3 T MR750 scanner (GE Healthcare, Waukesha, WI) using an 8-channel phased-array breast coil (GE Healthcare, Milwaukee, WI). This research was approved by the institutional review board at our institution and all human subjects were scanned with written, informed consent.
2.1. Contrast evaluation
To demonstrate the contrast of the DESS sequence, phantom studies compared the signal in DESS images with different diffusion sensitivities. Oil, egg, and water phantoms were used to provide a broad range of sample parameters (T1, T2, and diffusivity) to illustrate the effect that both sample parameters and sequence parameters (spoiler gradient area and flip angle) have on the DESS signal. Oil was chosen as a phantom with low diffusivity, egg yolk was chosen as a phantom with short T2, and water was chosen as a phantom with high diffusivity and long T2. The diffusion sensitivity was increased by increasing the spoiler gradient area (1, 3, 6, 9, 12, 15 cycles per voxel in the slice direction) and by decreasing the flip angle (35°, 15°). Phantom scan parameters are summarized in Table 1. The average signal was measured in regions of interest (ROIs) centered in each phantom for each scan. Ratios of signals in different DESS images were used to study the diffusion and T2 weighting of the DESS sequence and to account for differences in proton density.
Table 1.
Scan parameters for phantom, volunteer, and patient exams.
| DESS | T1 | DESS | DWI | T2 | Post-contrast | |
|---|---|---|---|---|---|---|
| Application | phantoms | volunteers | volunteers and patients | volunteers and patients | patients | patients |
| Pulse sequence | custom | SPGR | custom | EPI | FRFSE | DISCOa |
| Excitation | 3D | 3D | 3D | 2D | 2D | 3D |
| Fat suppression | – | – | spatial–spectral water-only excitation | spatial–spectral water-only excitation | IDEALb | Vibrant-FLEXc |
| Shims | – | – | dual volume | dual volume | – | dual volume |
| Echo time [ms] | 6.9, 29.2d | 2.1 | 6.9, 29.2d | 78 | 102 | 1.8 |
| Repetition time [ms] | 18.4 | 4.9 | 18.4 | 2050 | 3033 | 4.2 |
| Flip angle [deg] | 35, 15e | 13 | 35,15e | 90 | 90 | 15 |
| Bandwidth [kHz] | 62.5 | 83.33 | 62.5 | 250 | 83.33 | 142.86 |
| Field of view [cm] | 20 | 34 | 34 | 34 | 34 | 28 |
| Slice thickness (spacing) [mm] | 2.5 (2.5) | 5 (5) | 2.5 (2.5) | 5 (5) | 4 (5) | 1.2 (1.2) |
| Acquisition matrix | 384 × 256 | 512 × 256 | 384 × 256 | 160 × 160 | 320 × 256 | 256 × 256 |
| Number of slices | 42 | 84 | 60 | 30 | 27 | 160 |
| Voxel volume [mm3] | 1.3 | 4.4 | 2.9 | 22.6 | 5.6 | 1.4 |
| Acceleration (R) | ARCf (2) | – | ARCf (2) | ASSETg (2) | – | ARCf (1.4) |
| Signal averages | 1 | 1 | 1 | 8 | 3 | 0.7 |
| Echo train length | – | – | – | – | 24 | – |
| b values [s/mm2] | – | – | – | 0, 600 | – | – |
| Spoiler gradient areas [µs G/cm] | 939.5, 5637.0e | – | 939.5, 5637.0e | – | – | – |
| Specific Absorption Rate [W/kg] | 0.084, 0.015 | 1.984 | 0.084, 0.015 | 2.000 | 3.500 | 3.113 |
| Scan time [min:s] | 2:38 | 1:46 | 3:35 | 5:41 | 5:28 | 18:08 |
Acquisition technique for dynamic contrast-enhanced imaging with high spatio-temporal resolution.
three-echo acquisition with water-only, fat-only, in-phase, and out-of-phase reconstructions.
two-echo acquisition with water-only, fat-only, in-phase, and out-of-phase reconstructions.
TE2,effective = 2TR-TE1.
DESS diffusion weighting was modulated using both spoiler gradient area and flip angle. See Methods for combinations used for phantom, volunteer, and patient scanning.
k-space-based parallel imaging reconstruction.
image-domain-based parallel imaging reconstruction.
To evaluate contrast, signal ratios were calculated for all twelve acquisitions. To evaluate the diffusion sensitivity, signal ratios were calculated between Echo 2 of each acquisition and Echo 2 of the acquisition with the lowest diffusion sensitivity (1 cycle per voxel, 35°). To evaluate the T2 weighting, signal ratios were calculated between Echo 2 and Echo 1 of each acquisition. The signal ratios for each phantom are plotted against spoiler gradient area and flip angle. A simple simulation using the extended phase graph model [25] was used to validate the results of the oil phantom experiment, using the sequence parameters listed in Table 1 and the following sample parameters: T1/T2 = 350/50 ms, D = 0.01 × 10⁻⁹ m2/s.
Next, contrast was compared between DESS, spin-echo EPI DWI, and T2-weighted fast spin-echo (FSE) images. Fifteen agar phantoms were made using 90 mL of water, 10 mL of 10 nM Ni(NO3)2, and varying amounts of agar (0.5 to 7.5 g in increments of 0.5 g). Additional phantoms included water, peanut oil, silicone, dish detergent, syrup, half & half, egg yolk, egg white, orange fruit, and hand lotion. All phantoms were scanned using the DESS sequence with both “low DW” (1 cycle per voxel, 35°) and “high DW” (6 cycles per voxel, 15°). Regions of interest were placed near the center of the phantoms to minimize the influence of any susceptibility-induced artifacts. Contrast ratios were calculated by dividing the signal in each phantom by the signal in the agar phantom with the most similar parameters to breast tissue (T2 = 50 ms, ADC = 1.9 × 10⁻⁹ m2/s). The diffusion contrast was evaluated by calculating Pearson correlation coefficients for the contrast ratios of EPI DWI and the contrast ratios of DESS Echo 2. The T2 contrast was evaluated by calculating Pearson correlation coefficients for the contrast ratios of the T2-weighted FSE images and the contrast ratios of DESS Echo 2, the DESS T2 fits ((TE2 − TE1)/log(Echo 1/Echo 2) [16,20]), and the square-root-sum-of-squares DESS images (sqrt(Echo 12 + Echo 22) [20]). The agreement between the contrast ratios of DESS and the conventional sequences (EPI DWI and T2-weighted FSE) was evaluated using Bland–Altman plots [26].
2.2. In vivo scans
The diffusion sensitivity of the DESS sequence was modified by changing the spoiler gradient area and flip angle to acquire images with low DW (1 cycle per voxel, 35°) and high DW (6 cycles per voxel, 15°). The spoiler gradient areas were chosen to provide the largest difference in diffusion sensitivity while maintaining image quality. The smaller spoiler gradient area was chosen to guarantee sufficient spoiling to form images without the balanced steady-state free precession (bSSFP) banding artifact, and the larger spoiler gradient area was chosen to provide sufficient signal in Echo 2. The diffusion sensitivity was further modulated by changing the flip angle [11,12]. A flip angle of 15° was used to provide high diffusion contrast for fibroglandular tissue and breast lesions, and a flip angle of 35° was used to provide low diffusion sensitivity with comparable SNR.
Because the DESS sequence is sensitive to macroscopic motion, the acquisition scheme was chosen to minimize the appearance of motion artifacts. Elliptic–centric phase encode ordering [27] (the central ky/kz lines are acquired first) was used to minimize motion artifact coherence and to minimize the time over which the center of k-space is acquired. Parallel imaging using auto-calibrating reconstruction for Cartesian imaging (ARC) [28,29] with a reduction factor of two (R = 2) in the left–right direction was used to reduce scan times and associated bulk motion.
All acquisition parameters are summarized in Table 1. The DESS sequence was used with a spatial–spectral (water-only) RF pulse and dual volume shims to provide fat suppression without disrupting the steady state. The TE and TR of the DESS sequence were chosen to image water and fat in phase to improve depiction of the glandular tissue (in case of incomplete fat suppression) and to minimize the T2 weighting. The slice thickness was chosen to match the slice locations of the DESS images to those of the conventional diffusion- and T2-weighted images. The field of view, matrix size, and number of slices were chosen to acquire both breasts and axillae in a single imaging volume. Axial images were acquired to allow bilateral comparison.
2.3. Distortion comparison
Volunteers with no known lesions were scanned with a T1-weighted SPGR sequence to provide an anatomic reference. Image distortion was evaluated by comparing features on SPGR, EPI, and DESS images. The outer edge of the breast and regions of fibroglandular tissue were manually outlined on the reference SPGR images for two illustrative cases, and the curves were superimposed on the EPI and DESS images. Volunteer scan parameters are summarized in Table 1. Low-DW DESS images (1 cycle per voxel, 35°) were used to ensure sufficient signal in the glandular tissue.
2.4. Patient scans
Patients who were believed to have breast lesions were prospectively included in this study based on a surgeon’s referral and a radiologist’s evaluation of patient history. Biopsy results were used to confirm diagnoses. Patient scans were conducted between December 2009 and November 2011.We scanned 22 women (52 ± 11 years old) with T2-weighted FSE, EPI DWI, DESS, and contrast-enhanced spoiled gradient-echo sequences. An experienced radiologist identified 35 lesions, including 16 benign lesions, 2 cases of ductal carcinoma in situ (DCIS), and 17 invasive tumors. Contrast-enhanced T1-weighted spoiled gradient-echo (Post contrast) images were used as the gold standard for identifying lesions with breast MRI and as a reference image with low distortion. The DESS scan with low diffusion sensitivity used a spoiler gradient area corresponding to 1 cycle of spoiling per voxel in the slice direction and a flip angle of 35°. The scan with high diffusion sensitivity had a spoiler gradient area corresponding to 6 cycles of spoiling per voxel in the slice direction and a flip angle of 15°. Patient scan parameters are summarized in Table 1.
Three trained radiologists evaluated images of lesions in random order and were blinded to the sequence type (Post contrast, DWI, or DESS) in terms of image sharpness, lesion visibility, margin appearance, rim signal intensity, and the appearance of internal septations. Image sharpness was rated as very blurry, somewhat blurry, average, sharp, or very sharp. Lesion visibility was rated as not visible, very faint – possibly present, present – barely seen, definite but not brighter than normal glandular tissue, or brighter than normal glandular tissue. Lesion margins were rated as smooth, lobulated, microlobulated, irregular, or spiculated. High rim signal and low-signal internal septations were rated as not present, possible, likely, definite, or very clear.
2.5. Resolution comparison
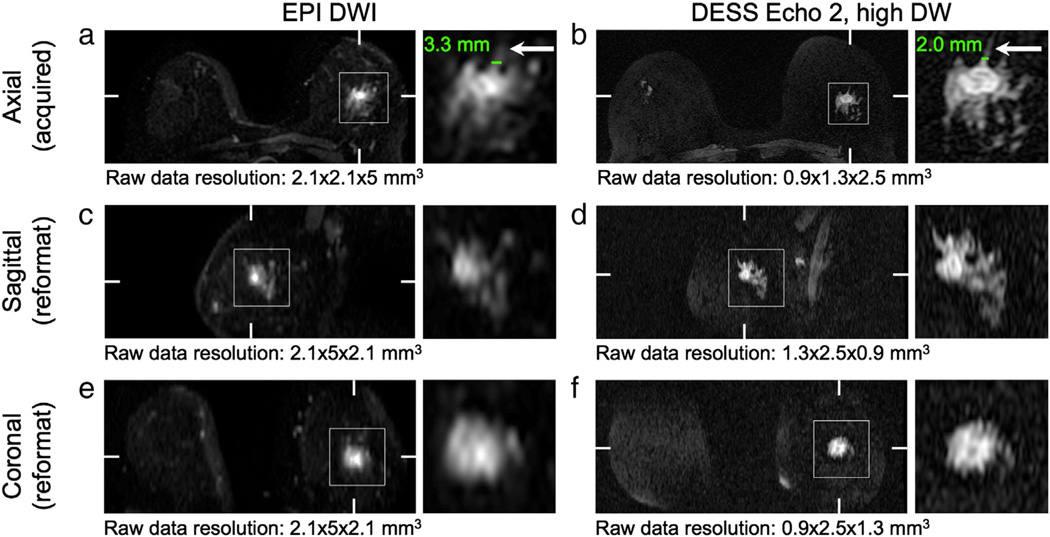
To demonstrate the high resolution achievable with the DESS sequence, axial images of a lesion were reformatted in the sagittal and coronal planes. The 3D DESS reformats were compared to the conventional 2D spin-echo EPI diffusion-weighted reformats. Both the 2D and 3D data were reconstructed to form 3D datasets in image space that can be displayed in any arbitrary plane. The image locations may not align perfectly because the resolutions of the DWI and DESS images differ, but the closest locations are chosen for comparison. The difference in locations for axial images is approximately 1 mm and the difference for the reformatted coronal and sagittal images is less than 0.5 mm. The images were displayed with the OsiriX DICOM viewer, using Lanczos 5 resampling (a practical implementation of sinc interpolation) to display the magnified images. The apparent size of a fine structure was measured on the axial (acquired) images.
2.6. Lesion comparison
Two cases were excluded from the in vivo contrast comparison due to poor fat suppression, which obscured the lesions (radiologists rated the lesions as not visible on the DWI and/or DESS images). The diffusion weighting and T2 weighting of the DESS images were evaluated by comparing lesion-to-tissue contrast ratios to those of spin-echo EPI diffusion-weighted images and T2-weighted FSE images. ROIs were chosen in each lesion and in nearby glandular tissue. An experienced radiologist marked the lesions. Small ROIs were chosen in regions of relative homogeneity within the lesion. Multiple ROIs were drawn if multiple distinct regions were visible in the lesion. (For example, two contrast ratios were calculated for the invasive ductal carcinoma in Figs. 9 and 11, one in the bright rim and one in the darker center.) The ROIs were manually adjusted for each sequence to accommodate the different resolution and distortion of each sequence, using morphological features to match the location of the ROIs in each image. The areas of the ROIs were maintained when adjusting the ROI to account for distortion differences. The contrast ratios were compared by calculating Pearson correlation coefficients and using Bland–Altman plots [26]. The diffusion-weighted contrast ratios were calculated for EPI DWI and compared to the contrast ratios of DESS Echo 2. The T2-weighted contrast ratios were calculated for the T2-weighted FSE images and were compared to the contrast ratios of DESS Echo 2, the DESS T2 fits, and the square-root-sum-of-squares DESS images.
Fig. 9.
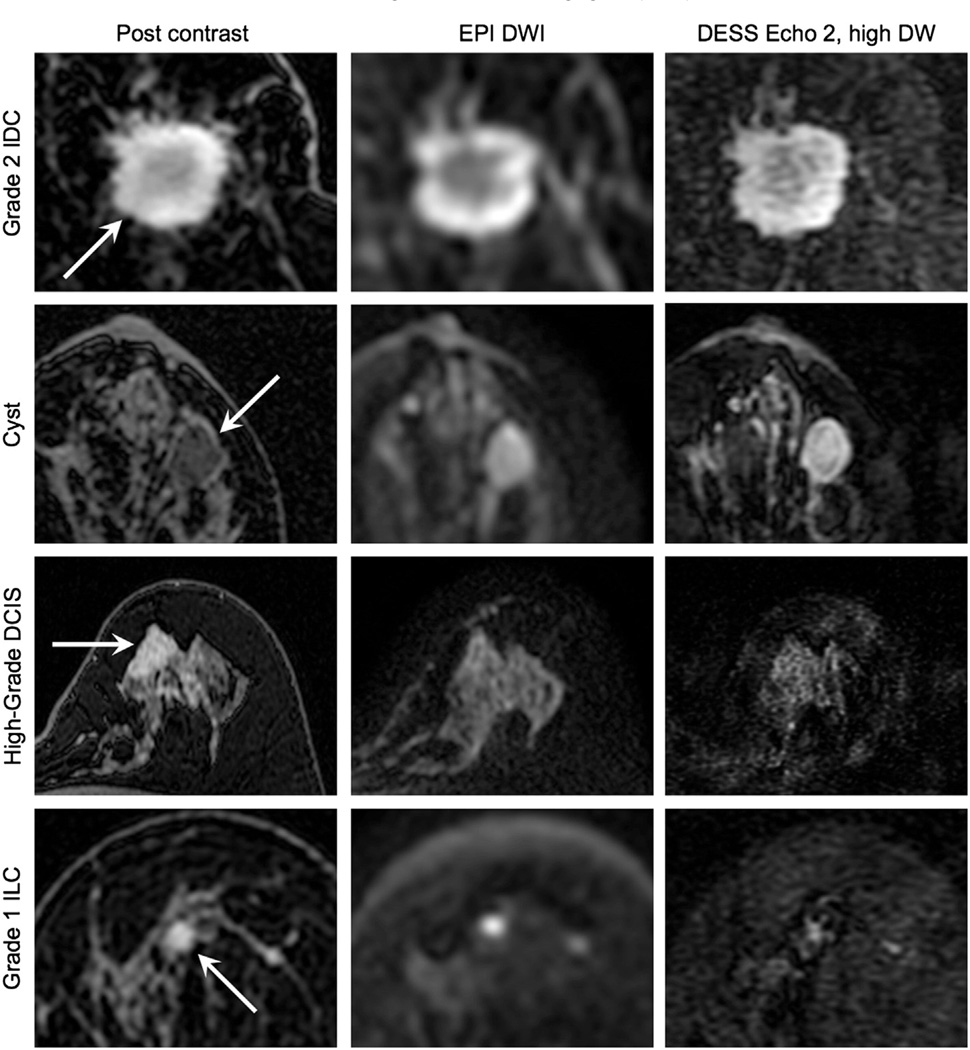
In vivo diffusion attenuation comparison. Typical patient images depicting an invasive ductal carcinoma (IDC), a benign cyst, a high-grade ductal carcinoma in situ (DCIS), and an invasive lobular carcinoma (ILC) acquired with contrast-enhanced T1 weighting (Post contrast) and diffusion weighting. The DESS images show higher resolution and less distortion than the conventional spin-echo EPI diffusion-weighted images (DWI), but with comparable image contrast.
Fig. 11.
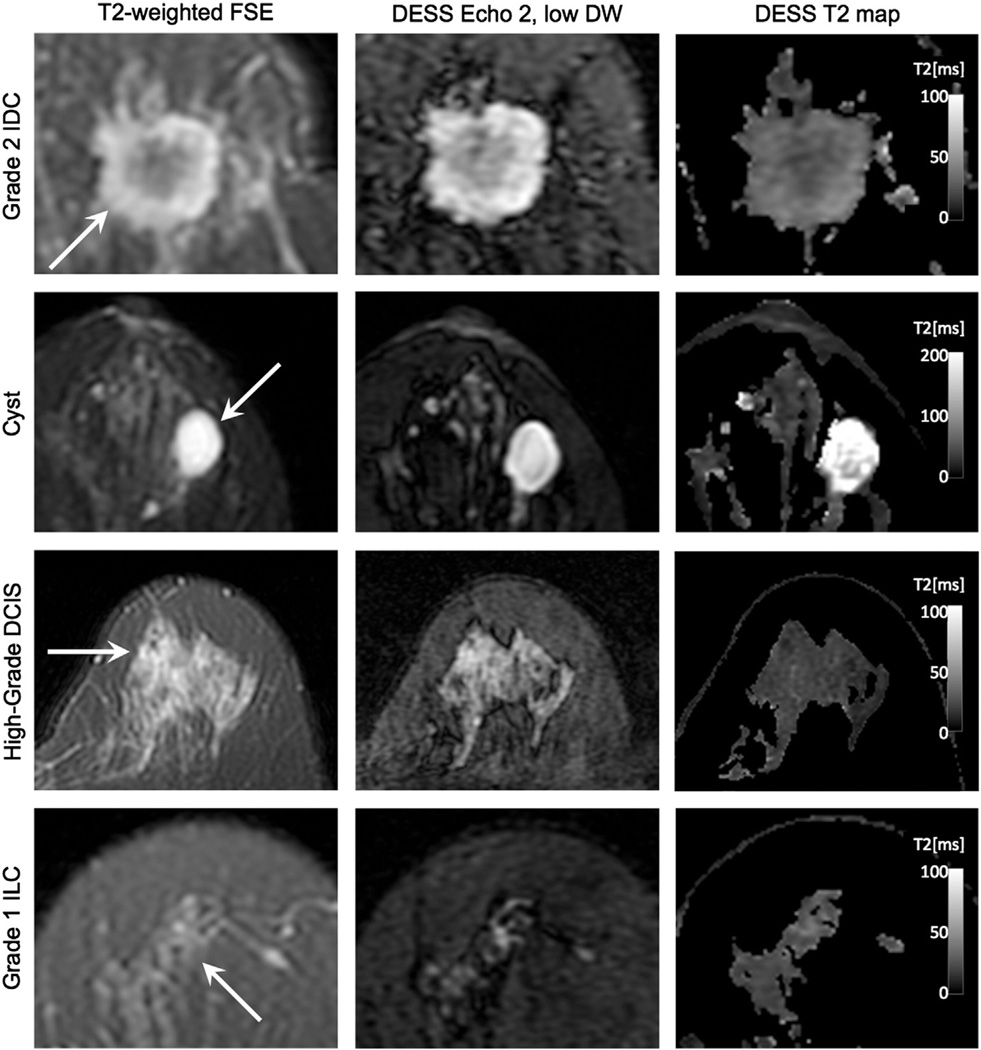
In vivo T2 weighting comparison. Typical patient images depicting an invasive ductal carcinoma (IDC), a benign cyst, a high-grade ductal carcinoma in situ (DCIS), and an invasive lobular carcinoma (ILC) acquired with fast-spin echo (FSE) and DESS. The DESS Echo 2, low DW images show similar image contrast to the T2-weighted FSE images, and the DESS T2 maps show T2 values that correspond to the literature values for glandular tissue.
3. Results
3.1. Contrast evaluation
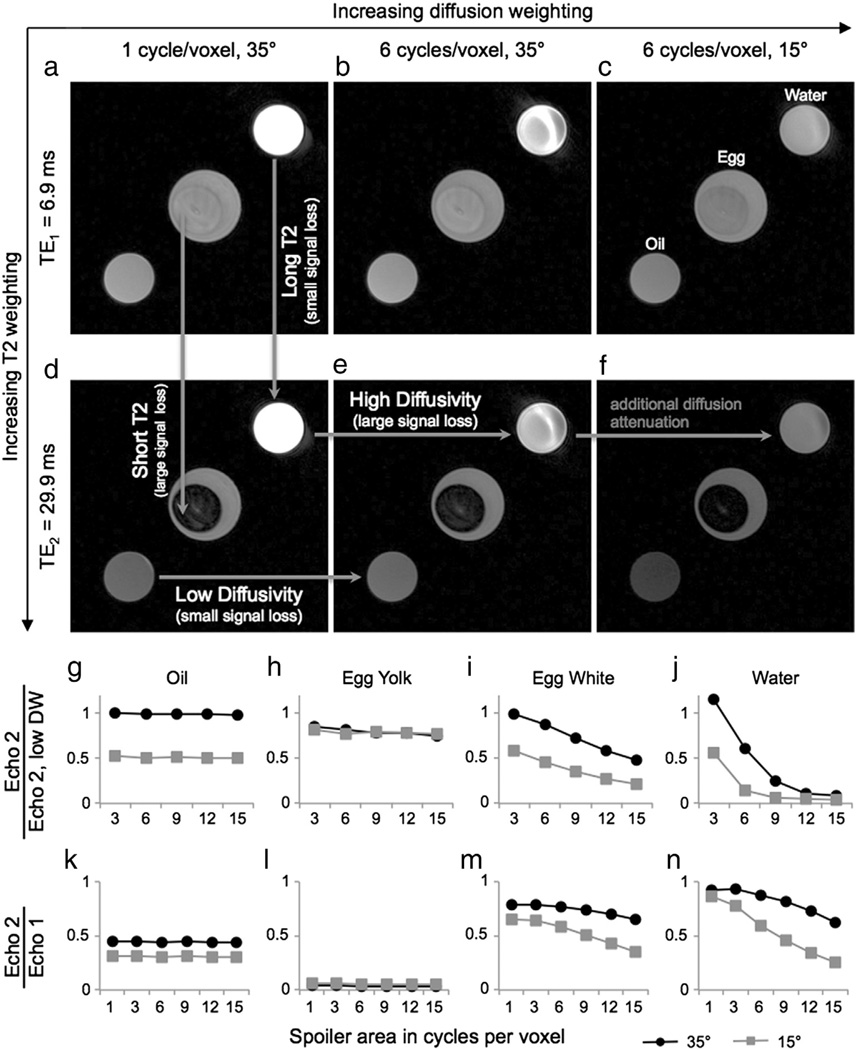
Images from three scans are shown for oil, egg, and water phantoms (Fig. 2a–f). In regions with low diffusivity (e.g., oil), there is little signal loss between acquisitions with different spoiler gradient areas (Fig. 2d,e; horizontal arrow labeled “Low Diffusivity”). In regions with higher diffusivity (e.g., water), there is more signal loss between acquisitions with different spoiler gradient areas (Fig. 2d,e; horizontal arrow labeled “High Diffusivity”). Decreasing the flip angle can further increase the diffusion sensitivity, which is easily seen in the water phantom (Fig. 2e,f; horizontal arrow labeled “additional diffusion attenuation”), but the T1 signal decay effect is greater, leading to signal loss in the oil phantom due to its short T1. In regions with long T2, there is little signal loss between Echo 1 and Echo 2 (Fig. 2a,d; vertical arrow labeled “Long T2”). In regions with short T2 (e.g., egg yolk), there is more signal loss between Echo 1 and Echo 2 (Fig. 2a,d; vertical arrow labeled “Short T2”).
Fig. 2.
Effect of sequence parameters on image contrast. Phantoms with different T2 values and diffusivities show different contrast in the two echoes and for different diffusion attenuations. The plots show signal ratios to account for differences in proton density. Each acquisition produces an image (Echo 1) with a shorter TE (TE1) and an image (Echo 2) with a longer effective TE (TE2). (In regions of high diffusivity (egg white, water), the signal loss from Echo 1 to Echo 2 increases as the diffusion attenuation increases. This change in signal ratios reflects the mixed contrast of the DESS sequence: the images have both T2 and diffusion weighting, so multiple acquisitions are necessary to separate out the effects of each.)
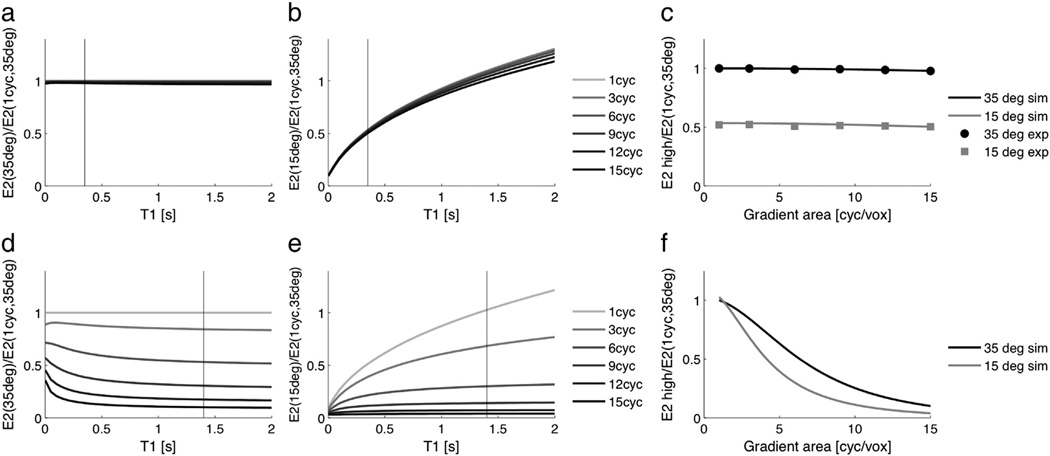
The signal ratios of Echo 2 of each acquisition relative to Echo 2 of the acquisition with the lowest diffusion sensitivity (1 cycle per voxel, 35°) illustrate the diffusion weighting of the DESS sequence (Fig. 2g–j, plots labeled “Echo 2/Echo 2, low DW”). Oil, which has very low diffusivity, shows very little signal loss as the spoiler gradient area increases, for both flip angles (Fig. 2g). (The additional signal loss when the flip angle is decreased is due to the short T1 of oil, which results in a different steady-state signal. The effect of T1 on the signal ratios is shown in Fig. 3, and experimental results match well with simulation results.) Egg yolk, which has slightly higher diffusivity than oil shows slightly more signal loss as the spoiler gradient area increases for both flip angles (Fig. 2h). (Since egg yolk has a longer T1 than oil, there is less change in the signal level when the flip angle is decreased.) For egg white and water, which both have relatively high diffusivities, the signal in Echo 2 decreases as the spoiler gradient area increases (Fig. 2i,j). When the flip angle decreases, there is even greater signal loss, most noticeably for water, which has the highest diffusivity of the phantoms (Fig. 2j).
Fig. 3.
Effect of T1 and flip angle on signal ratios. Signal ratios were simulated using the extended phase graph model for a low diffusivity species (T1/T2 = 350/50 ms, D = 0.01 × 10⁻⁹ m2/s). As expected, the signal ratio does not change much with spoiler area for a low-diffusivity species (a). The signal ratio is independent of T1 when the flip angle is consistent (a), but when the flip angle changes between acquisitions, there is greater attenuation of species with shorter T1 due to T1 decay while magnetization is along the longitudinal axis (b). Tissues of interest have a longer T1 than fat, and have a signal ratio close to 1 even when the flip angle changes. The signal attenuation versus gradient area is shown for oil, and experimental results match very well with simulation results (c). There is very little signal loss as the spoiler area increases for either combination of flip angles, but there is signal attenuation due to T1 when the flip angle changes between acquisitions (gray line and points). Simulation results are also shown for fibroglandular tissue (T1/T2 = 1400/55 ms, D = 1.6 × 10⁻⁹ m2/s). As expected, the signal ratio decreases with increasing spoiler area for a high-diffusivity species (d). The signal ratios are largely independent of T1 when the flip angles are consistent (d), but when the flip angle changes between acquisitions, there is again greater signal attenuation for species with shorter T1 (e). The signal attenuation versus gradient area is shown for fibroglandular tissue, with increased diffusion attenuation when the flip angle is decreased. Vertical lines indicate the T1 of oil (a, b) and fibroglandular tissue (d, e).
The signal ratios of Echo 2 relative to Echo 1 of each acquisition illustrate the T2 weighting of the DESS sequence and the interrelatedness of the T2 and diffusion weighting (Fig. 2k–n, plots labeled “Echo 2/Echo 1”). Egg yolk, which has the shortest T2 of the phantoms, has the greatest signal loss between Echo 1 and Echo 2 (Fig. 2l), and water, which has the longest T2 of the phantoms has the smallest signal loss between Echo 1 and Echo 2 (Fig. 2n). Oil and egg yolk, which have low diffusivity, show consistent signal ratios for all levels of diffusion sensitivity because the signal loss due to diffusion is negligible (Fig. 2k,l). However, egg white and water show greater signal loss between Echo 1 and Echo 2 as the diffusion sensitivity increases, both by increasing the spoiler gradient area and by decreasing the flip angle (Fig. 2m,n). There are T2 weighting and diffusion weighting in each image because we cannot acquire DESS images with no diffusion sensitivity and without the bSSFP banding artifact. Therefore, we cannot isolate the T2 signal loss in a single ratio.
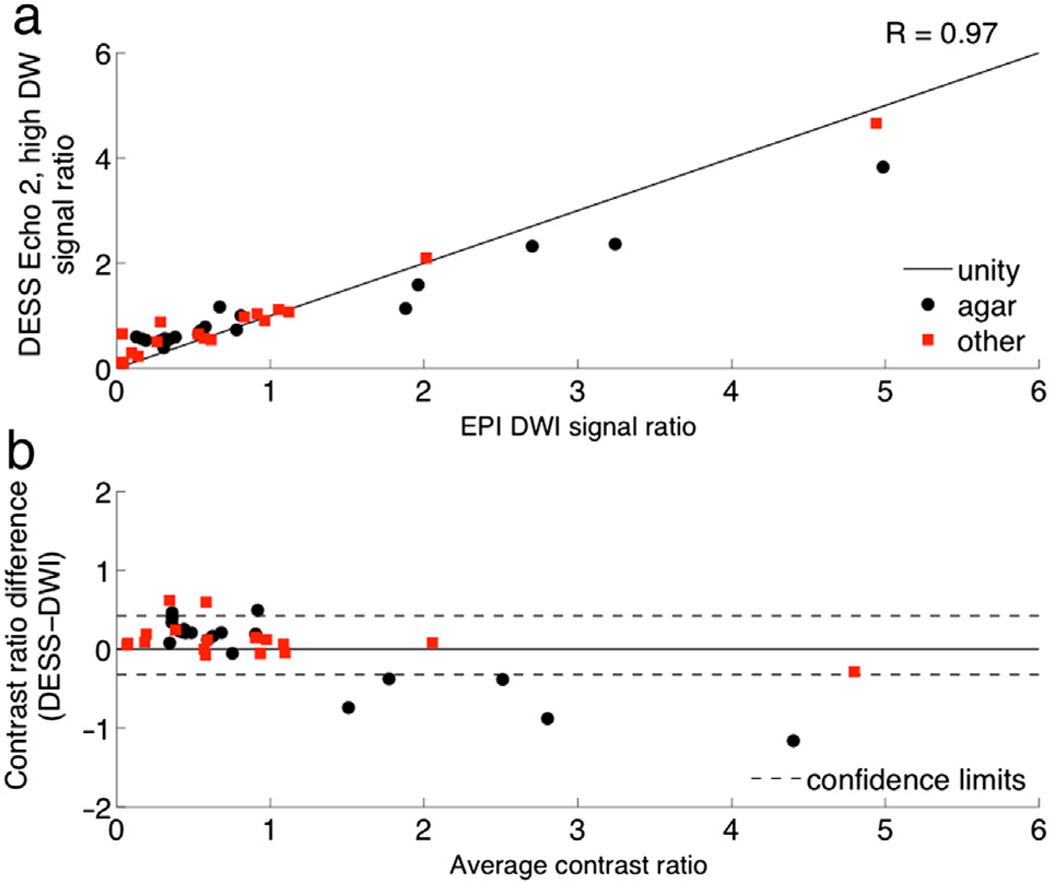
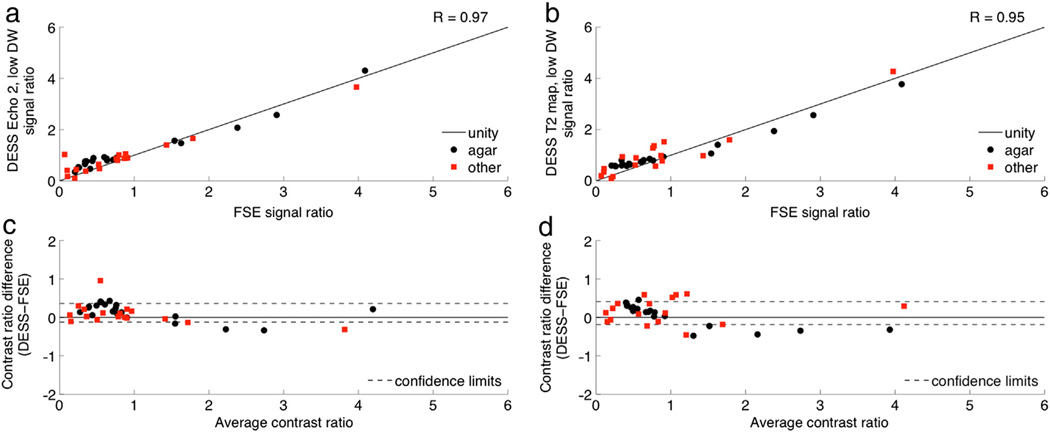
The DESS contrast ratios are strongly correlated with those of conventional DWI and T2-weighted sequences in phantoms (Table 2). Though there is a slight bias and a slight proportional error when comparing the DESS data with the corresponding conventional imaging techniques (Figs. 4b, 5c,d), all comparisons show a monotonic relationship between signals in conventional and DESS images. Neither of the conventional techniques nor the DESS sequence has pure diffusion weighting or pure T2 weighting, so it is not expected that the images have exactly the same contrast. For example, the square-root-sum-of-squares images have a particularly complicated image contrast and, as a result, show the largest proportional errors and biases on the Bland–Altman plots of all the T2 weighting comparisons.
Table 2.
Pearson correlation coefficients for phantom and patient data.
| Reference sequence | DESS data | Phantom data | Lesion data |
|---|---|---|---|
| DWI | Echo 2, low DW | 0.97 | 0.81 |
| DWI | Echo 2, high DW | 0.97 | 0.83 |
| FSE | Echo 2, low DW | 0.97 | 0.80 |
| FSE | Echo 2, high DW | 0.97 | 0.65 |
| FSE | T2 fita, low DW | 0.95 | 0.80 |
| FSE | T2 fita, high DW | 0.85 | 0.62 |
| FSE | rSOSb, low DW | 0.95 | 0.23 |
| FSE | rSOSb, high DW | 0.81 | 0.05 |
T2 fit = (TE2−TE1)/log(Echo 1/Echo 2).
rSOS = sqrt(Echo 12 + Echo 22).
Fig. 4.
Diffusion attenuation contrast comparison. Contrast ratios were calculated as the signal ratio between ROIs in a variety of phantoms and an ROI in a reference phantom with T2 and ADC values similar to those of breast tissue. The contrast ratios of DESS Echo 2, high DW (a) are plotted against the contrast ratios of diffusion-weighted EPI. The contrast ratios are also shown on a Bland–Altman plot with 96% confidence intervals (b).
Fig. 5.
T2 weighting contrast comparison. Contrast ratios were calculated as the signal ratio between ROIs in a variety of phantoms and an ROI in a reference phantom with T2 and ADC values similar to those of breast tissue. The contrast ratios of DESS Echo 2, low DW (a) and DESS T2 maps (b) are plotted against the contrast ratios of T2-weighted FSE. The contrast ratios are also shown on Bland–Altman plots with 96% confidence intervals (c, d).
3.2. Distortion comparison
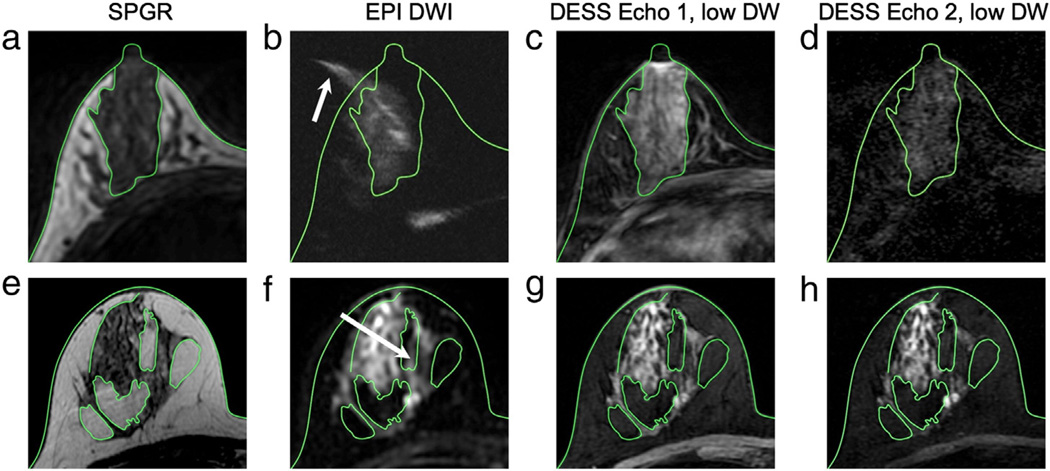
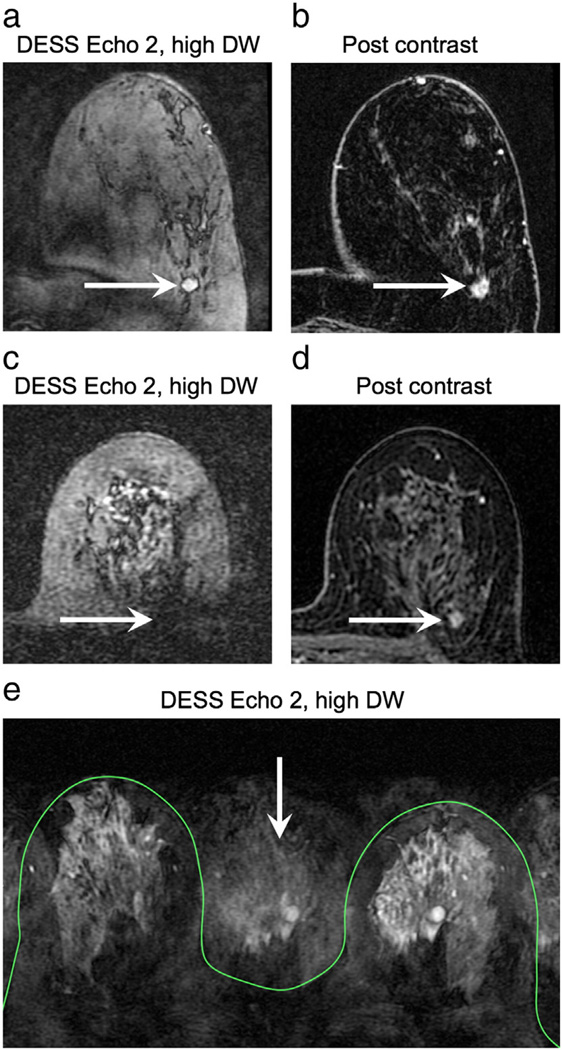
In the case of severe susceptibility-variation-induced distortions, signal from the glandular tissue can appear outside of the breast region (arrow, Fig. 6b), as determined from the reference image (Fig. 6a), whereas the structures in the DESS images (Fig. 6c,d) correspond well to those in the reference images. Even when there is little distortion in the EPI image, there is less distortion in the DESS image. For example, some signal from fibroglandular tissue appears in a fat region in the EPI image (arrow, Fig. 6f), but not in the DESS images (Fig. 6g,h).
Fig. 6.
Distortion comparison. The green contours show the skin and the interfaces between fat and glandular tissue on the SPGR images (a, e) superimposed on the remaining images. Severe distortion in the spin-echo EPI image (b) can cause some of the signal from the glandular tissue to appear outside of the breast (arrow) when compared to the anatomic reference image (a), but the structures in the DESS images (c, d) correspond well to those in the reference image (a). Even for a high-quality spin-echo EPI image (f), there is still some distortion, and signal from the glandular tissue appears in a fat region (arrow); however, there is no distortion in the DESS images (g, h) when compared to the reference image (e).
3.3. Patient scans
The DESS sequence identified more lesions as brighter than glandular tissue (21) than the conventional DWI sequence (17). The DESS sequence failed to show lesions for some cases where the lesion was isointense on post-contrast images, when failed fat suppression obscured the lesion (e.g., see Fig. 12c), or in the case of some invasive ductal carcinomas. Radiologists consistently rated DESS images as sharper with less distortion and blurring than conventional DWI. Of the 6 out of 35 cases for which at least one radiologist rated the DESS image as blurrier than DWI, 4 cases had very little glandular tissue and 2 had visible motion artifacts. This improved image quality facilitated the evaluation of tumor morphology, in particular spiculations, internal septations, and lesion heterogeneity. Although there were a limited number of cases with spiculations and septations, DESS scored better than DWI for their depiction. There was only one case for which radiologists identified spiculations on the DWI image, but not on the DESS image, but the DESS image was rated as being much sharper than the DWI image, so the lesion was more clearly depicted (see Fig. 7a,b). There were not enough examples of each type of lesion in this preliminary study to perform a useful statistical analysis.
Fig. 12.
In vivo challenges. Poor fat suppression can reduce the conspicuity of lesions. In the case of incomplete fat suppression (a) the image contrast is diminished; the arrows show a grade 3 invasive ductal carcinoma, also shown in a post-contrast image for reference (b). If the field variation is severe enough, the signal from the tumor can be suppressed (c). The arrows indicate the location of a grade 1 invasive ductal carcinoma, also shown in a post-contrast image for reference (d). Motion can cause image artifacts, such as signal appearing outside of the breasts (e); the green contour shows the skin and the arrow shows artifact signal.
Fig. 7.
Reformatted images. The images acquired with the DESS sequence (b, d, f) have higher resolution than those acquired with the EPI DWI sequence (a, c, e), which is particularly evident in the images reformatted in the sagittal plane (c, d). The higher resolution allows for better depiction of fine features (arrows). Hash marks indicate the locations of the reformatted planes. Detail shows a grade 2 invasive ducal carcinoma.
3.4. Resolution comparison
The DESS images (Fig. 7b) are acquired with a higher in-plane resolution than the EPI images (Fig. 7a) and better depict fine structures (arrows, Fig. 7). For example, the apparent measured width of a fine structure (lines, Fig. 7a,b) is smaller in the DESS image (2.0 mm, Fig. 7b) than in the DWI image (3.3 mm, Fig. 7a). Reformatted DESS images (Fig. 7d,f) show better depiction of the lesion in the through-plane dimension (vertical) due to the acquisition of thinner slices than those of the EPI images (Fig. 7c, e). The acquired resolution is listed below each image (horizontal × vertical × through-plane).
3.5. Lesion comparison
There is strong correlation between the lesion-to-tissue contrast ratios of the DESS data and those of the conventional DWI images (Table 2). The Bland–Altman plots show no bias for the comparison with DESS Echo 2, high DW (Fig. 8b) and a slight bias for the comparison with DESS Echo 2, low DW (Fig. 8d); the variability is consistent for the range of ratios shown for both comparisons.
Fig. 8.
Diffusion attenuation contrast comparison. Contrast ratios were calculated as the signal ratio between a lesion ROI and a fibroglandular ROI for a number of benign and malignant lesions. The contrast ratios of the DESS images with high diffusion attenuation (a) and low diffusion attenuation (c) are plotted against the contrast ratios of the EPI diffusion-weighted images. The contrast ratios are also shown on Bland–Altman plots with 96% confidence intervals (b, d).
Fig. 9 shows typical images of a variety of lesions as depicted by a T1-weighted post-contrast image (Post contrast), the conventional DWI sequence (EPI DWI) and the second echo of the DESS acquisition with higher diffusion sensitivity (DESS Echo 2, high DW). In general, the DESS images show comparable contrast to the DWI images, but with higher resolution. The DESS image better depicts the suspicious microlobulated margins, high rim signal, and adjacent parenchymal spiculation of a grade 2 invasive ductal carcinoma (IDC) (Fig. 9, first row) than conventional DWI. Similarly, the margins of the cyst (Fig. 9, second row) are more confidently characterized as smooth on the DESS images than the conventional EPI DWI. Though the ductal carcinoma in situ (DCIS) (Fig. 9, third row) is approximately isointense with the fibroglandular tissue in the DESS image, it shows comparable contrast to the DWI image.
There is also strong correlation between the contrast ratios of the T2-weighted images and the contrast ratios of both the DESS images and the DESS T2 fits; there is weak correlation between the contrast ratios of the T2-weighted images and the contrast ratios of the DESS square-root-sum-of-squares images (Table 2). The Bland–Altman plots show smaller biases for the comparisons with the T2 fits (Fig. 10d, h) than for the comparisons with Echo 2 (Fig. 10c, g), and the variability is consistent for the range of ratios shown for both comparisons. As expected, the agreement between the DESS data and the conventional T2-weighted images is better for the DESS acquisitions with lower diffusion sensitivity (Fig. 10e, f). Except for two outliers, there is consistent variability in the DESS T2-weighted contrast ratio comparisons (Fig. 10c, d, g, h). (The two outliers in Fig. 10f correspond to two benign lesions with DESS T2 values greater than 100 ms. The echo times used are not optimal for measuring such long T2 values, and the measurements are very sensitive to noise.) The contrast ratios of the square-root-sum-of-squares images were weakly correlated with those of the T2-weighted images (R = 0.23 for the acquisition with low diffusion sensitivity and R = 0.05 for the acquisition with high diffusion sensitivity), and the variability increased as the contrast increased.
Fig. 10.
T2 weighting contrast comparison. Contrast ratios were calculated as the signal ratio between a lesion ROI and a fibroglandular ROI for a number of benign and malignant lesions. The T2 weighting was evaluated in DESS images (left column) and in T2 maps (right column). The contrast was evaluated in DESS images with high diffusion attenuation (a–d) and low diffusion attenuation (e–h). The contrast ratios for the DESS data are plotted against the contrast ratios for the FSE T2-weighted images (a, b, e, f) and are also shown on Bland–Altman plots with 96% confidence intervals (c, d, g, h).
Fig. 11 shows T2-weighted images of the same lesions shown in Fig. 9. A conventional FSE sequence (T2-weighted FSE) is compared to the second echo of the DESS acquisition with lower diffusion sensitivity (DESS Echo 2, low DW) and the T2 map calculated from the DESS acquisition with lower diffusion sensitivity (DESS T2 map). DESS Echo 2, low DW (Fig. 10, second column) shows comparable contrast to the T2-weighted sequence (Fig. 11, first column). The T2 values in fibroglandular tissue calculated from the DESS acquisition with lower diffusion sensitivity (Fig. 11, third column) correspond to the values calculated in previous studies [30].
4. Discussion
We have demonstrated the feasibility of acquiring high-resolution 3D diffusion- and T2-weighted images of the breast in short scan times with the DESS sequence. The spoiler gradient area and flip angle can be used to modify the diffusion contrast of the DESS sequence, as shown in phantom experiments. Volunteer scans showed lower distortion with the DESS sequence than with the EPI DWI sequence. Radiologists rated DESS as having higher image quality than conventional DWI. We compared the lesion-to-glandular tissue ratios of the DESS sequence to those of the clinical diffusion-weighted and T2-weighted sequences and found that the DESS sequence provides comparable in vivo contrast. Although all data presented here were collected on a single scanner with an 8-channel coil, we have observed consistent results in phantom and vivo studies conducted on 6 different scanners (1.5 T and 3 T) and with 16- and 18-channel coils.
The DESS sequence has many advantages over currently used diffusion-weighted sequences. With the DESS sequence, we acquire a 3D volume in a single acquisition. The images do not have artifacts associated with an echo train or an EPI train, such as blurring and distortion. Because there is less distortion, the DESS sequence is able to achieve higher resolution than an EPI sequence without sacrificing image quality. The RF power deposition (Specific Absorption Rate, SAR) of the DESS sequence is substantially lower than that of the spin-echo sequences used for clinical diffusion-weighted and T2-weighted imaging because the DESS sequence uses small flip angles and a spatial-spectral excitation, which has low peak B1 and a long pulse duration, resulting in low average power. The SAR the DESS sequence is more than an order of magnitude smaller than that of the spin-echo EPI or fast spin-echo sequences used to acquire clinical diffusion-weighted and T2-weighted images (Table 1). Because the signal may have been dephased and rephased by spoiler gradients from non-consecutive repetitions, the DESS sequence able to achieve a stronger diffusion weighting with a smaller gradient area due to a longer effective diffusion time (i.e., the time between dephasing and rephrasing gradients) than a conventional DWI sequence. Additionally, the sequence has flexible image contrast that can easily be modified by changing sequence parameters, such as spoiler gradient area and duration, TE, TR, and flip angle. However, it is more difficult to calculate ADC values with DESS than with a spin-echo EPI sequence because the diffusion weighting of the DESS sequence is dependent on sequence parameters and tissue parameters rather than a simple exponential relationship that is dependent only on sequence parameters [11–13]. The minimum achievable diffusion weighting is limited because, unlike a spin-echo EPI diffusion-weighted sequence, the DESS sequence requires a non-zero spoiler gradient to produce images without the bSSFP banding artifact. DESS images have both T2 and diffusion weighting; therefore, the sequence can identify tumors that are bright on T2-weighted images, diffusion-weighted images, or both.
Fat suppression is challenging in the breast due to the field inhomogeneity caused by the shape of the breast, and fat suppression failure is more common and more problematic in subjects with less fibroglandular tissue. While tumors may still be visible in the case of mild fat suppression failure, the overall contrast of the image is reduced and may render the tumor (arrow, Fig. 12a) indistinguishable from the fat signal. Severe fat suppression failure can result in suppression of the water signal, and thus the tumor signal (arrow, Fig. 12c). (The images shown in Fig. 12c,d were from one of the cases excluded from the contrast comparison because the lesion was not visible on the DESS images.) The attenuation of the signal from short-T1 species, namely fat, improves the quality of the fat suppression because there is a fat peak at the water resonance that is not suppressed by a spectrally selective excitation. The data presented were acquired with a water-selective excitation, but the fat suppression can be improved by using graphically prescribed volume shimming over the breast region or Dixon approaches [31–33].
Like all diffusion-weighted sequences, the DESS sequence sensitive to motion. In addition to encoding molecular motion to provide diffusion weighting, the spoiler gradients also cause phase accrual from cardiac, respiratory, and bulk patient motion. Preliminary patient scans acquired without consideration for motion resulted in considerable image artifacts, such as signal appearing outside of the breast (arrow, Fig. 12e). If the artifact is severe enough, it can obscure the pathology. Subsequently, we have used elliptic centric phase encode ordering to minimize the coherence of the artifact [27] so that it does not interfere with diagnosis and we have used parallel imaging to reduce the overall scan time, and thus the amount of motion that occurs during the scan. Further correction, such as using navigator data to correct phase errors, may be needed for accurate quantification of ADC and T2 values [34]. Newer breast coil designs that stabilize the breast also have potential to reduce bulk motion artifacts.
It is possible to acquire a diffusion-weighted image using a single DESS acquisition with a large spoiler gradient area or to acquire a T2-weighted image using a single DESS acquisition with the minimum spoiler area, but multiple acquisitions with different spoiler gradient areas may ultimately provide useful diagnostic information, such as ADC and T2 maps. Short of quantification, multiple acquisitions can also provide additional qualitative information. For example, in patients with little fibroglandular tissue, there may not be enough normal tissue near the lesion to compare signal intensities, and acquiring images with different diffusion weightings could facilitate classification as normal tissue or a lesion. Multiple acquisitions could also be used to qualitatively distinguish bright signal contributions from long T2 components and restricted diffusion, thus mitigating the T2-shinethrough effect [35]. However, if one type of contrast is of primary importance and a shorter scan time is desired, a single scan can be used for both T2 and diffusion weighting. For example, a single DESS acquisition with higher diffusion weighting can be used to generate a diffusion-weighted image, and T2 can be reasonably estimated from the same scan. While the DESS T2 estimate is not accurate in lesions with long T2 values, it is adequate to characterize them as regions with long T2 values, which may be sufficient for identifying fluid-filled structures, e.g., benign cysts (Fig. 11, second row) and fibroadenomas.
In order to reduce intra- and inter-reader variability, it necessary to be able to quantify ADC in addition to T2. Current challenges to quantification include macroscopic motion during and between scans, B1 variation, and long computation times. However, the DESS images provide value over conventional diffusion- and T2-weighted imaging in that the 3D acquisition allows for thinner slices and the reduced distortion allows a higher in-plane resolution, resulting in much smaller voxels. The higher resolution and lower distortion facilitate comparison of structures between diffusion-weighted images and images from other sequences, notably post-contrast images, improving differential diagnosis.
In conclusion, we have demonstrated that the DESS sequence acquires high-resolution, 3D diffusion- and T2-weighted images with low distortion in short scan times, and initial patient studies show that the sequence is able to highlight a variety of breast lesions. The DESS sequence has great potential for improving the cost-effectiveness of breast cancer screening and breast lesion characterization because it does not require contrast administration and has a short scan time.
References
- 1.Guo Y, Cai YQ, Cai ZL, Gao YG, An NY, Ma L, et al. Differentiation of clinically benign and malignant breast lesions using diffusion-weighted imaging. J Magn Reson Imaging. 2002;16:172–178. doi: 10.1002/jmri.10140. [DOI] [PubMed] [Google Scholar]
- 2.Woodhams R, Matsunaga K, Kan S, Hata H, Ozaki M, Iwabuchi K, et al. ADC mapping of benign and malignant breast tumors. Magn Reson Med Sci. 2005;4:35–42. doi: 10.2463/mrms.4.35. [DOI] [PubMed] [Google Scholar]
- 3.Kul S, Cansu A, Alhan E, Dinc H, Gunes G, Reis A. Contribution of diffusion-weighted imaging to dynamic contrast-enhanced MRI in the characterization of breast tumors. AJR Am J Roentgenol. 2011;196:210–217. doi: 10.2214/AJR.10.4258. [DOI] [PubMed] [Google Scholar]
- 4.EI Khouli RH, Jacobs MA, Mezban SD, Huang P, Kamel IR, Macura KJ, et al. Diffusion-weighted imaging improves the diagnostic accuracy of conventional 3.0-T breast MR imaging. Radiology. 2010;256:64–73. doi: 10.1148/radiol.10091367. [DOI] [PMC free article] [PubMed] [Google Scholar]
- 5.Partridge SC, Rahbar H, Murthy R, Chai X, Kurland BF, DeMartini WB, et al. Improved diagnostic accuracy of breast MRI through combined apparent diffusion coefficients and dynamic contrast-enhanced kinetics. Magn Reson Med. 2011;65:1759–1767. doi: 10.1002/mrm.22762. [DOI] [PMC free article] [PubMed] [Google Scholar]
- 6.Saslow D, Boetes C, Burke W, Harms S, Leach MO, Lehman CD, et al. American Cancer Society guidelines for breast screening with MRI as an adjunct to mammography. CA Cancer J Clin. 2007;57:75. doi: 10.3322/canjclin.57.2.75. [DOI] [PubMed] [Google Scholar]
- 7.Turner R, Le Bihan D, Maier J, Vavrek R, Hedges LK, Pekar J. Echo-planar imaging of intravoxel incoherent motion. Radiology. 1990;177:407–414. doi: 10.1148/radiology.177.2.2217777. [DOI] [PubMed] [Google Scholar]
- 8.Farzaneh F, Riederer SJ, Pelc NJ. Analysis of T2 limitations and off-resonance effects on spatial resolution and artifacts in echo-planar imaging. Magn Reson Med. 2005;14:123–139. doi: 10.1002/mrm.1910140112. [DOI] [PubMed] [Google Scholar]
- 9.Liu C, Bammer R, Kim DH, Moseley ME. Self-navigated interleaved spiral (SNAILS): application to high-resolution diffusion tensor imaging. Magn Reson Med. 2004;52:1388–1396. doi: 10.1002/mrm.20288. [DOI] [PubMed] [Google Scholar]
- 10.Veldhuis WB, Liu C, Bammer R, Daniel BL, Moseley ME. High-resolution, fat-suppressed, diffusion-weighted MRI of the breast using a self-navigated multi-shot technique. Proceedings of the 17th Annual Meeting of ISMRM; Honolulu. 2009. p. 2098. [Google Scholar]
- 11.Wu EX, Buxton RB. Effect of diffusion on the steady-state magnetization with pulsed field gradients. J Magn Reson. 1990;90:243–253. [Google Scholar]
- 12.Buxton RB. The diffusion sensitivity of fast steady-state free precession imaging. Magn Reson Med. 1993;29:235–243. doi: 10.1002/mrm.1910290212. [DOI] [PubMed] [Google Scholar]
- 13.McNab JA, Miller KL. Steady-state diffusion-weighted imaging: theory, acquisition and analysis. NMR Biomed. 2010;23:781–793. doi: 10.1002/nbm.1509. [DOI] [PubMed] [Google Scholar]
- 14.Bammer R. Basic principles of diffusion-weighted imaging. Eur J Radiol. 2003;45:169–184. doi: 10.1016/s0720-048x(02)00303-0. [DOI] [PubMed] [Google Scholar]
- 15.Redpath TW, Jones RA. FADE — a new fast imaging sequence. Magn Reson Med. 1988;6:224–234. doi: 10.1002/mrm.1910060211. [DOI] [PubMed] [Google Scholar]
- 16.Bruder H, Fischer H, Graumann R, Deimling M. A new steady-state imaging sequence for simultaneous acquisition of two MR images with clearly different contrasts. Magn Reson Med. 1988;7:35–42. doi: 10.1002/mrm.1910070105. [DOI] [PubMed] [Google Scholar]
- 17.Lee SY, Cho ZH. Fast SSFP gradient echo sequence for simultaneous acquisitions of FID and echo signals. Magn Reson Med. 1988;8:142–150. doi: 10.1002/mrm.1910080204. [DOI] [PubMed] [Google Scholar]
- 18.Freeman R, Hill HDW. Phase and intensity anomalies in Fourier transform NMR. J Magn Reson. 1971;4:366–383. [Google Scholar]
- 19.Scheffler K, Lehnhardt S. Principles and applications of balanced SSFP techniques. Eur Radiol. 2003;13:2409–2418. doi: 10.1007/s00330-003-1957-x. [DOI] [PubMed] [Google Scholar]
- 20.Welsch GH, Scheffler K, Mamisch TC, Hughes T, Millington S, Deimling M, et al. Rapid estimation of cartilage T2 based on double echo at steady state (DESS) with 3 tesla. Magn Reson Med. 2009;62:544–549. doi: 10.1002/mrm.22036. [DOI] [PubMed] [Google Scholar]
- 21.Staroswiecki E, Granlund KL, Alley MT, Gold GE, Hargreaves BA. Simultaneous estimation of T2 and apparent diffusion coefficient in human articular cartilage in vivo with a modified three-dimensional double echo steady state (DESS) sequence at 3 T. Magn Reson Med. 2012;67:1086–1096. doi: 10.1002/mrm.23090. [DOI] [PMC free article] [PubMed] [Google Scholar]
- 22.Bieri O, Ganter C, Scheffler K. Quantitative in vivo diffusion imaging of cartilage using double echo steady-state free precession. Magn Reson Med. 2012;68:720–729. doi: 10.1002/mrm.23275. [DOI] [PubMed] [Google Scholar]
- Stejskal EO, Tanner JE. Spin diffusion measurements: spin echoes in the presence of a time-dependent field gradient. J Chem Phys. 1965;42:288–292. [Google Scholar]
- 24.Miller KL, Hargreaves BA, Gold GE, Pauly JM. Steady-state diffusion-weighted imaging of in vivo knee cartilage. Magn Reson Med. 2004;51(2):394–398. doi: 10.1002/mrm.10696. [DOI] [PubMed] [Google Scholar]
- 25.Weigel M, Schwenk S, Kiselev VG, Scheffler K, Hennig J. Extended phase graphs with anisotropic diffusion. J Magn Reson. 2010;250:276–285. doi: 10.1016/j.jmr.2010.05.011. [DOI] [PubMed] [Google Scholar]
- 26.Bland JM, Altman DG. Statistical methods for assessing agreement between two methods of clinical measurement. Lancet. 1986;327:307–310. [PubMed] [Google Scholar]
- 27.Wilman AH, Riederer SJ. Performance of an elliptical centric view order for signal enhancement and motion artifact suppression in breath-hold three-dimensional gradient echo imaging. Magn Reson Med. 1997;38:793–802. doi: 10.1002/mrm.1910380516. [DOI] [PubMed] [Google Scholar]
- 28.Brau AC, Beatty PJ, Skare S, Bammer R. Efficient computation of autocalibrating parallel imaging reconstructions. Proceedings of the 14th Annual Meeting of ISMRM; Seattle. 2006. p. 2462. [Google Scholar]
- 29.Brau AC, Beatty PJ, Skare S, Bammer R. Comparison of reconstruction accuracy and efficiency among autocalibrating data-driven parallel imaging methods. Magn Reson Med. 2008;59:382–395. doi: 10.1002/mrm.21481. [DOI] [PMC free article] [PubMed] [Google Scholar]
- 30.Rackow-Penner R, Daniel BL, Yu H, Sawyer-Glover AM, Glover GH. Relaxation times of breast tissue at 1.5 T and 3 T measured using IDEAL. J Magn Reson Imaging. 2006;23:87–91. doi: 10.1002/jmri.20469. [DOI] [PubMed] [Google Scholar]
- 31.Dixon W. Simple proton spectroscopic imaging. Radiology. 1984;153:189–194. doi: 10.1148/radiology.153.1.6089263. [DOI] [PubMed] [Google Scholar]
- 32.Glover GH. Multipoint Dixon technique for water and fat proton and susceptibility imaging. J Magn Reson Imaging. 1991;1:521–530. doi: 10.1002/jmri.1880010504. [DOI] [PubMed] [Google Scholar]
- 33.Reeder SB, Pineda AR, Wen Z, Shimakawa A, Yu H, Brittain JH, et al. Iterative decomposition of water and fat with echo asymmetry and least-squares estimation (IDEAL): application with fast spin-echo imaging. Magn Reson Med. 2005;54:636–644. doi: 10.1002/mrm.20624. [DOI] [PubMed] [Google Scholar]
- 34.Miller KL, Pauly JM. Nonlinear phase correction for navigated diffusion imaging. Magn Reson Med. 2003;50:343–353. doi: 10.1002/mrm.10531. [DOI] [PubMed] [Google Scholar]
- 35.Freed DE, Scheven UM, Zielinski LJ, Sen PN, Hürlimann MD. Steady-state free precession experiments and exact treatment of diffusion in a uniform gradient. J Chem Phys. 2001;115:4249–4258. [Google Scholar]


