

Abstract
Epithelial splicing regulatory protein 1 (ESRP1) binds the FGFR-2 auxiliary cis-element ISE/ISS-3, located in the intron between exon IIIb and IIIc, and primarily promotes FGFR-2 IIIb expression. Here we assessed the role of ESRP1 in pancreatic ductal adenocarcinoma (PDAC). Immunohistochemical analysis was performed using anti-ESRP1, FGFR-2 IIIb and FGFR-2 IIIc antibodies in 123 PDAC cases. ESRP1-expression vector and small interference RNA (siRNA) targeting ESRP1 were transfected into human PDAC cells, and cell growth, migration and invasion were analyzed. In vivo heterotopic and orthotopic implantations using ESRP1 overexpression clones were performed and effects on pancreatic tumor volumes and hepatic and pulmonary metastases determined. ESRP1 immunoreactivity was strong in the nuclei of cancer cells in well-to-moderately differentiated PDACs, but weak in poorly-differentiated cancers. Well-to-moderately differentiated cancers also exhibited high FGFR-2 IIIb and low FGFR-2 IIIc expression, whereas this ratio was reversed in the poorly-differentiated cancers. Increased ESRP1 expression was associated with longer survival by comparison with low-ESRP1 expression, and PANC-1 cells engineered to express ESRP1 exhibited increased FGFR-2 IIIb expression and decreased migration and invasion in vitro, whereas ESRP1 siRNA-transfected KLM-1 cells exhibited increased FGFR-2 IIIc expression and increased cell growth, migration and invasion. In vivo, ESRP1-overexpressing clones formed significantly fewer liver metastases as compared with control clones. ESRP1 regulates the expression pattern of FGFR-2 isoforms, attenuates cell growth, migration, invasion, and metastasis, and is a favorable prognostic factor in PDAC. Therefore, devising mechanisms to up-regulate ESRP1 may exert a beneficial therapeutic effect in PDAC.
Keywords: ESRP1, Pancreatic cancer, FGFR-2 IIIb, FGFR-2 IIIc, EMT
Introduction
Pancreatic ductal adenocarcinoma (PDAC) is associated with a dismal prognosis and 5-year survival rate of 6% (1). A high percentage of PDAC overexpress a number of growth factors and their receptors, including fibroblast growth factor receptor 2 (FGFR-2) (2, 3). The FGFR-2 gene encodes several splice variants by alternative splicing (4–6). FGFR-2 IIIb and FGFR-2 IIIc are representative FGFR-2 isoforms among several splice variants derived from FGFR-2. FGFR-2 IIIb and FGFR-2 IIIc are expressed predominantly in epithelial cells and mesenchymal cells, respectively, yet are almost identical transmembrane-type receptors with extracellular immunoglobulin-like domains and cytoplasmic tyrosine-kinase domain (7). However, FGFR-2 IIIb and FGFR-2 IIIc differ from each other in the carboxyl-terminal half of the third Ig-like region of the extracellular domain, as a consequence of alternative mRNA splicing. During epithelial to mesenchymal transition (EMT) in bladder and prostate cancers, there is a switching in the expression of FGFR-2 IIIb to FGFR-2 IIIc (8, 9). Both isoforms are expressed in PDAC, and there is a significant correlation between co-expression of FGFR-2 IIIb and FGF7, venous invasion, vascular endothelial growth factor (VEGF)-A expression, and poor prognosis (2). Moreover, PDAC cell growth is suppressed by targeting FGFR-2 IIIc with a small interfering RNA (siRNA) or with an anti-FGFR-2 IIIc antibody (10).
A number of auxiliary cis-elements and RNA binding proteins that regulate splicing of FGFR-2 IIIb and FGFR-2 IIIc have been reported (11, 12). Epithelial splicing regulatory protein 1 (ESRP1) is a RNA binding protein which participates in the enhancement of splicing of the upstream exon IIIb while silencing the downstream exon IIIc binding intronic splicing enhancer/intronic splicing silencer-3 (ISE/ISS-3) (13). Furthermore, ESRP1 orchestrates an epithelial type of splicing regulatory program in EMT (14) by regulating of splicing of FGFR-2, CD44, ENAH, and p120-catenin in breast, lung, colon, cancer (15, 16). Induction of EMT in normal human prostate epithelial cells by inducing knockdown of E-cadherin is also associated with the downregulation of both ESRP1 and ESRP2 (13, 17). Moreover, ectopic forced expression of the ESRP1 in mesenchymal cells is associated with changes in cell morphology and motility reminiscent of an epithelial phenotype, suggesting that splicing regulation drives critical aspects of EMT-associated phenotypic changes (18). In the present study we sought to delineate the role of ESRP1 in PDAC and to assess the mechanisms whereby ESRP1 modulates EMT and the alternative splicing of FGFR-2.
Results
Immunohistochemical analysis of ESRP1, FGFR-2 IIIb and FGFR-2 IIIc in human PDAC
PDAC is often associated with regions that are moderately differentiated adenocarcinoma which form ductal-like structures, and with regions that are poorly-differentiated and form alveolar or trabecular structures (Fig. 1A). ESRP1 was abundant in the nuclei of cancer cells that were well-to-moderately differentiated adenocarcinoma (Fig. 1A, black arrows), but was weakly expressed in poorly-differentiated adenocarcinoma (Fig. 1A). In serial tissue sections, strong expression of FGFR-2 IIIb was detected in the cytoplasm and/or cell membrane of well-to-moderately differentiated adenocarcinoma cells (Fig. 1A, white arrows), whereas weak expression was seen in poorly-differentiated adenocarcinoma. By contrast, FGFR-2 IIIc immunoreactivity was weak in well-to-moderately differentiated adenocarcinoma (Fig. 1A), and was strong in poorly-differentiated adenocarcinoma (Fig. 1A, arrowheads). Accordingly, cancer lesions were classified into two groups: well-to-moderately differentiated adenocarcinoma (well/mod) and poorly-differentiated adenocarcinoma (poor), and evaluated for ESRP1, FGFR-2 IIIb, and FGFR-2 IIIc immunoreactivity.
Figure 1. Immunohistochemical Analysis of ESRP1, FGFR-2 IIIb and FGFR-2 IIIc in Human Pancreatic Cancer Tissues.
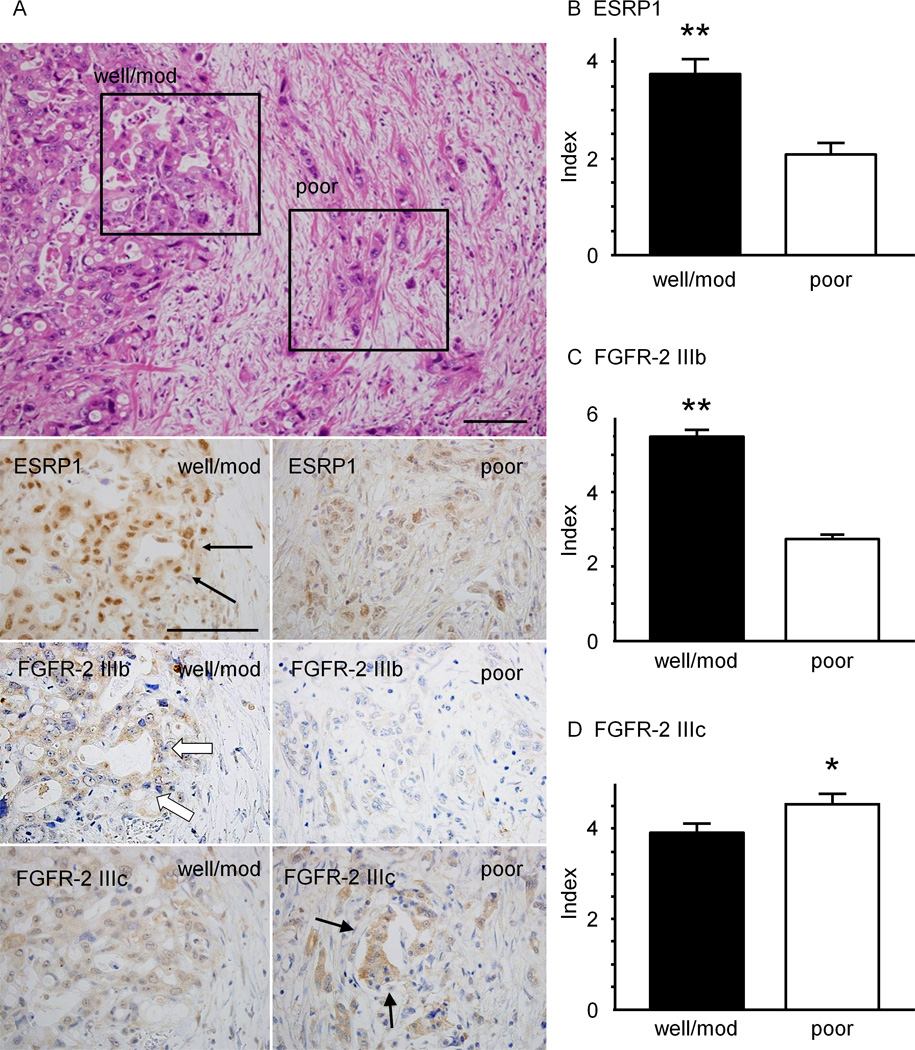
A: ESRP1 was strongly expressed in the nuclei of cancer cells in PDAC sections, especially in well-to-moderately differentiated adenocarcinoma forming ductal structure (arrows), while it was weakly expressed in poorly-differentiated adenocarcinoma, which are characterized by trabecular or solid structure, but not ductal structure. In serial tissue sections, high ESRP1 expression was associated with stronger immunostaining for FGFR-2 IIIb (white arrows), whereas FGFR-2 IIIc immunoreactivity was increased in tumors with low ESRP1 levels (arrowheads). Upper panel, H&E staining; bar; 100 µm. B and C: ESRP1 and FGFR-2 IIIb indices in well/moderate differentiated (well/mod) lesions were significantly higher than in poorly-differentiated (poor) lesions (**P<0.01). D: The FGFR-2 IIIc index was greater in poor lesions (*P<0.05).
ESRP1 and FGFR-2 IIIb indices were significantly higher in well/mod lesions than those in poorly-differentiated lesions (P<0.01, Fig. 1B and C). By contrast, FGFR-2 IIIc indices in poorly-differentiated lesions were significantly higher than in well/mod lesions (P<0.05, Fig. 1D). In the normal human pancreas, ESRP1 immunoreactivity was detected in the nuclei and cytoplasm of acinar cells and in the nuclei of islet cells, but was either weak or undetectable in pancreatic ductal cells and absent in vascular endothelial cells (Supplemental Fig. 1).
Correlation of clinicopathological features with ESRP1 expression
To examine the correlation between ESRP1 expression and clinicopathological features, we divided 123 PDAC cases into two groups based on ESRP1 expression as determined by the median value for the immunohistochemical indices. The ESRP1-high group (n=65) had more cases with histological grade of G1/G2, whereas the ESRP1-low group (n=58) had more cases with G3 histology (P=0.04, Supplemental Table 1). By contrast, other clinicopathological factors such as age, sex, T, N, and M factors, and stage based on UICC classification were similar in both groups. However, the overall survival rate of the ESRP1-high group was significantly longer than that of the ESRP1-low group (P=0.0189, Fig. 2A). The disease-free survival rate of the ESRP1-high group also tended to be longer than the ESRP1-low group (P=0.0767, Fig. 2B). Sixty-six patients received adjuvant chemotherapy (Supplemental table 1) with various combinations of gemcitabine, 5-fluorouracil (5-FU), tegafur-uracil (UFT), and TS-1 (consisting of tegafur, gimeracil and oteracil potassium). Excluding these patients and focusing on the surgery only group, survival was not statistically better in the ESRP1-high group (Supplemental Fig. 2).
Figure 2. Overall Survival and Disease-free Survival of High-ESRP1 and Low-ESRP1 groups.

A: The overall survival rate of the group exhibiting high ESRP1 immunoreactivity was significantly higher than that of the low-immunoreactivity ESRP1 group (P=0.0189). B: The disease-free survival rate of the high ESRP1 group tended to higher than that of the low ESRP1 group (P=0.0767).
Effects of transient transfection of an ESRP1-expressing vector in PANC-1 cells
To assess the role of ESPR-1 in PDAC cells we initially characterized ESRP1 expression and determined that it was elevated in Capan-1, KLM-1, PK-1 and PK-8 cells, and low in PANC-1, PK-45H and MIA PaCa-2 cells (Supplemental Fig. 3A). FGFR-2 IIIb mRNA levels were also elevated in Capan-1, KLM-1, PK-1 and PK-8 cells, and low in the other cells (Supplemental Fig. 3B). By contrast, FGFR-2 IIIc mRNA levels were more variable, and were highest in PANC-1 cells (Supplemental Fig. 3C).
To examine the effects of increased ESRP1 expression we transiently transfected an ESRP1-expression-vector into PANC-1 cells, since these cells expressed the lowest levels of endogenous ESRP1. Transfected cells (PANC-ESRP1) expressed high ESRP1 mRNA levels (P<0.01) by comparison with empty vector-transfected control cells (PANC-EV) or parental cells (Fig. 3A). There was a concomitant increase in FGFR-2 IIIb mRNA levels in PANC-ESRP1 cells by comparison with PANC-EV and parental PANC-1 cells (P< 0.05), whereas FGFR-2 IIIc levels were not altered (Fig. 3A). Moreover, ESRP1 protein levels were increased in the nuclear fraction of PANC-ESRP1 cells (Fig. 3B). Phase-contrast microscopy did not reveal any characteristic morphological changes these cells (Fig. 3C upper panels). Nonetheless, by immunofluorescence, ESRP1 was increased in the nuclei of PANC-ESRP1 cells as compared with parental and PANC-EV cells (Fig. 3C, lower panels).
Figure 3. Effects of Transfecting an ESRP1-expressing Vector in PANC-1 Cells.
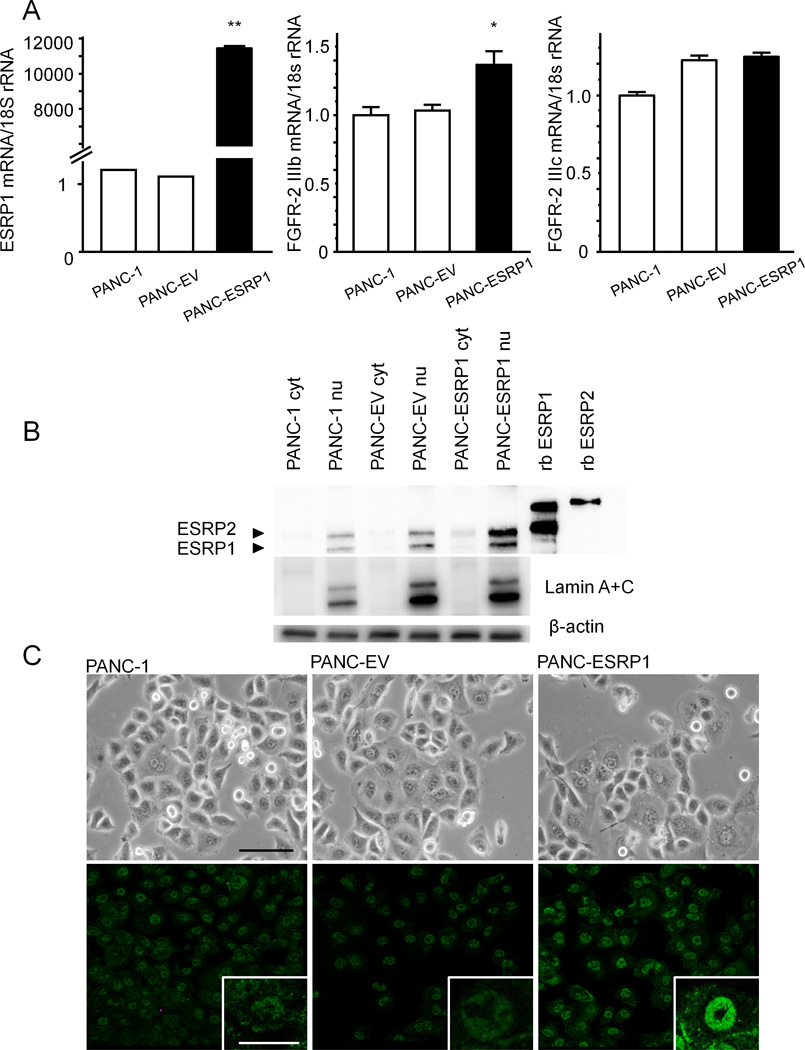
A: Quantitative PCR. PANC-1 cells that were transiently transfected with an ESRP1-expressing vector (PANC-ESRP1) exhibited higher ESRP1 mRNA levels than empty vector-transfected cells (PANC-EV) and wild-type (PANC-1) cells (**P<0.01). PANC-ESRP1 expressed higher levels of FGFR-2 IIIb mRNA than PANC-EV and PANC-1 cells, while FGFR-2 IIIc expression was not altered. B: Western blots. ESRP1 protein was increased in the nuclear fraction of PANC-ESRP1 cell (PANC-ESRP1 nu) as compared to the nuclei of PANC-1 and PANC-EV cells (PANC-1 nu and PANC-EV nu). Lamin A + C, which is a marker of nuclear protein, was not detected in cytoplasm (cyt), and was abundant in the nuclear fraction (nu). β-actin immnoblotting was used to assess protein loading. rb ESRP1 and rb ESRP2 represent recombinant ESRP1 and ESRP2, respectively. C: In phase-contrast images, there were no characteristic morphological changes in PANC-1, PANC-EV and PANC-ESRP1 cells (upper panel). Immunofluorescence images of ESRP1 (green) showed significant increases of ESRP1 protein in PANC-ESRP1 cells as compared with PANC-1 and PANC-EV cells (lower panel). Upper panel: bar: 100µm, inset of lower panel: bar: 50 µm.
Effects of ESRP1-transfection on cell proliferation, migration and invasion in PANC-1 cells
Similar growth rates were observed in PANC-1, PANC-EV and PANC-ESRP1 cells, as determined in a WST-8 cell counting assay (Fig. 4A). By contrast, single cell migration of PANC-ESRP1 cells was significantly decreased by comparison with parental PANC-1 and PANC-EV cells (P<0.01, Fig. 4B), and cell migration and invasion in a modified Boyden chamber assay were markedly decreased as compared with PANC-EV cells (P<0.01, Fig. 4C and D).
Figure 4. Effects of ESRP1 on Proliferation, Migration and Invasion in PANC-1 Cells.
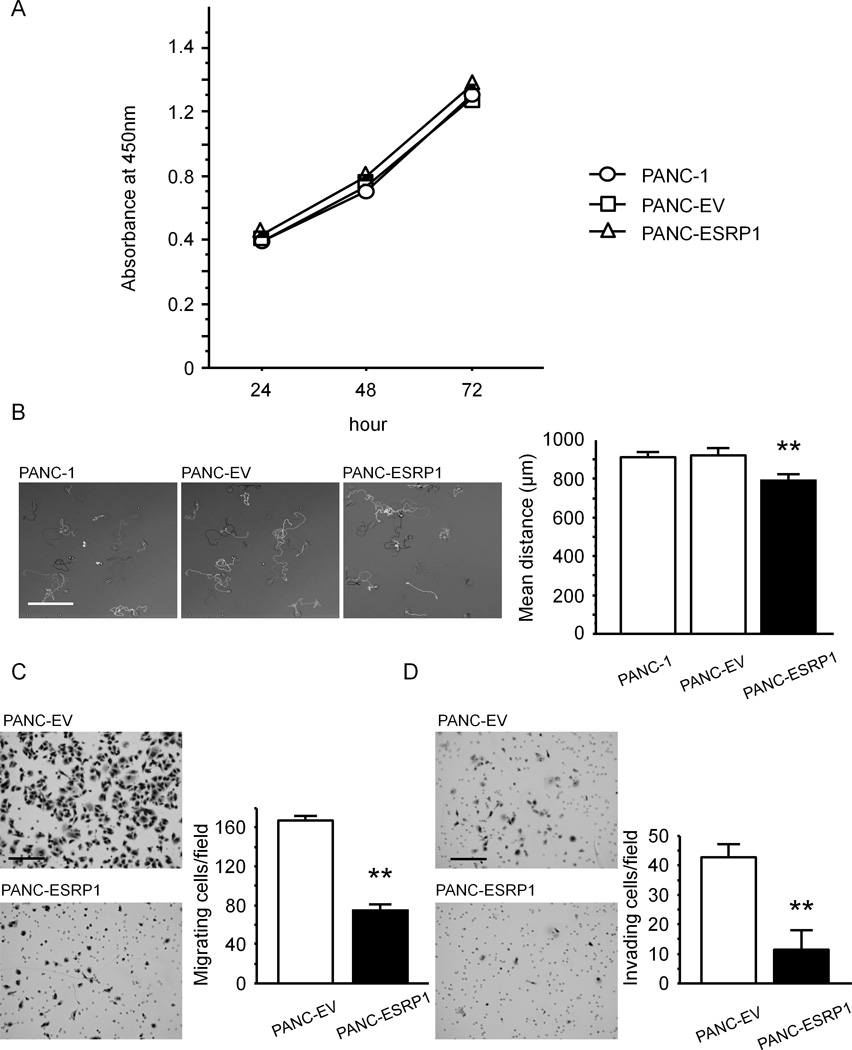
A: Cell proliferation. Cell proliferation was similar in PANC-1, PANC-EV and PANC-ESRP1 cells at all tested time points. B: Single cell movement. PANC-ESRP1 cells movement was significantly decreased as compared with PANC-1 and PANC-EV cells (**P<0.01). bar: 500 µm. C and D: Both migration (C) and invasion (D) were markedly decreased in PANC-ESRP1 cells as compared with PANC-EV cells (**P<0.01). bar: 200µm.
To confirm the results observed following transient transfection, we established PANC-1 clones (-2 and -5) stably-expressing ESRP1, and PANC-EV2 and PANC-EV9 clones expressing the empty vector (Supplemental Fig. 4A). Although FGFR-2 IIIb and IIIc levels were variable in each clone, the mRNA ratios of FGFR-2 IIIb to FGFR-2 IIIc were higher by comparison with the ratios in the respective control cells, but this difference was not statistically significant (Supplemental Fig. 4A). Phase-contrast microscopy did not reveal any morphological changes in the stably transfected clones (Supplemental Fig. 4B, upper panels), whereas immunofluorescence revealed a marked increase in nuclear ESRP1 (Supplemental Fig. 4B, lower panels). Importantly, ESRP1-2 and ESRP1-5 clones exhibited significantly attenuated single cell movement and migration as compared with PANC-EV2 and 9 (Supplemental Fig. 5A and B).
Effects of ESRP1 silencing on KLM-1 cell proliferation, migration and invasion
We next sought to determine the consequences of ESRP1 suppression on FGFR-2 IIIb and IIIc levels in KLM-1 cells, since these cells expressed the highest ESRP levels among our cell lines. Two siRNAs targeting different sites within the ESRP1 transcript (siESRP1-A and siESRP1-B) were used to silence ESRP1. A siRNA (siNeg) which does not bind to any human mRNAs was used as a negative control. ESRP1 mRNA levels were decreased in siESRP1-A and siESRP1-B expressing cells, FGFR-2 IIIb mRNA levels were not altered, whereas FGFR-2 IIIc mRNA levels were significantly increased (P<0.01) by comparison with siNeg cells (Supplemental Fig. 6A). Moreover, ESRP1 protein levels were markedly decreased in both the cytoplasmic (cyt) and nuclear (nu) fractions of siESRP1-A and siESRP1-B cells (Supplemental Fig. 6B), without any evident morphological changes (Supplemental Fig. 6C, upper panels) but with a marked decrease in nuclear ESRP1 immunofluorescence (Supplemental Fig. 6C, lower panels). As compared with siNeg cells, siESRP1-A and siESRP1-B cells also exhibited increased proliferation (P<0.05, Fig. 5A), as well as increased (P<0.01) migration (Fig. 5B) and invasion (Fig. 5C).
Figure 5. Effects of ESRP1 Silencing on Cell Proliferation, Migration and Invasion in KLM-1 Cells.
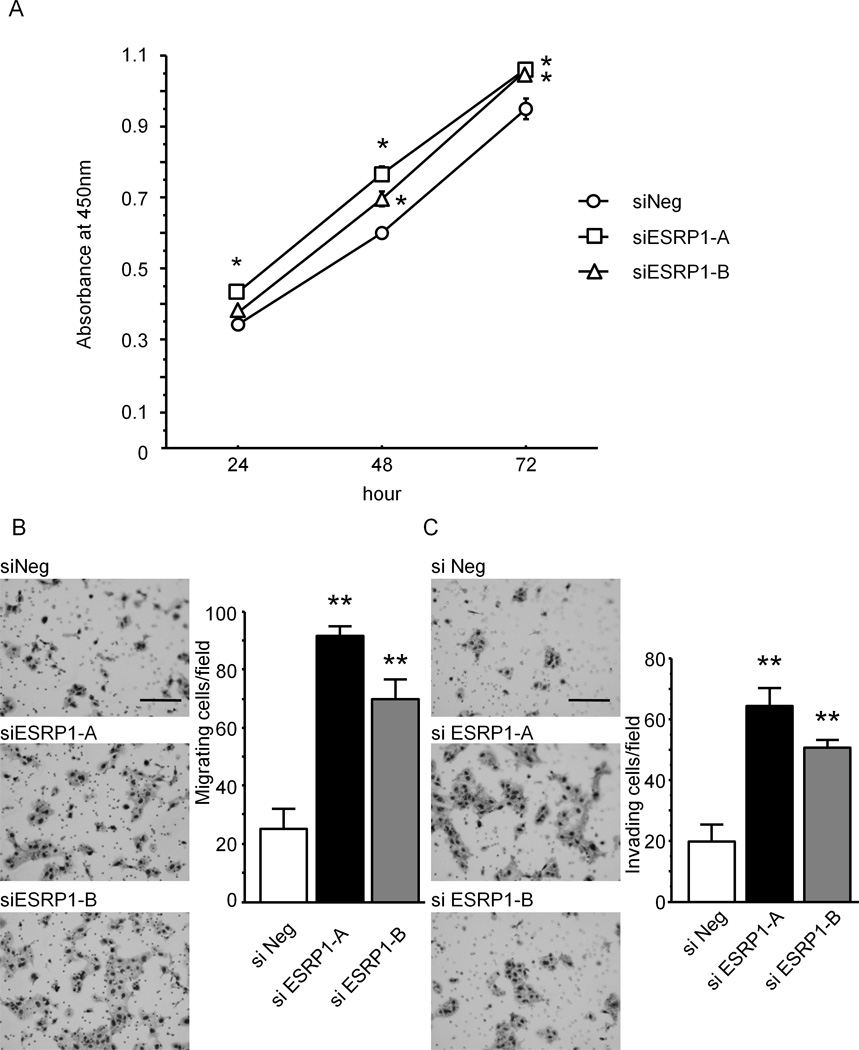
A: Cell proliferation. ESRP1 siRNA-transfected KLM-1 cells were transfected with siRNA targeting ESRP1 (siESRP1-A and siESRP1-B) and cell proliferation was monitored using the WST-8 cell counting assay. There was a significant increase in cell proliferation in both siESRP1-A and siESRP1-B cells as compared with negative control siRNA-transfected cells (siNeg, *P<0.05). B and C: Migration and invasion. Both migration and invasion were markedly increased in siESRP1-A and siESRP1-B cells as compared with siNeg cells (**P<0.01). bar: 200µm.
We previously reported that FGFR-2 IIIc is associated with enhanced proliferation, migration, and invasion in pancreatic cancer cells (10). To determine whether such increases were due to increased FGFR-2 IIIc expression, we performed double knockdown of ESRP1 and FGFR-2 IIIc in KLM-1 using ESPR1 siRNA and FGFR-2 IIIc siRNA (siESRP1-A + siFGFR-2 IIIc and siESRP1-B + siFGFR-2 IIIc). An irrelevant siRNA was used as a negative control (siESRP1-A + siNeg and siESRP1-B + siNeg). FGFR-2 IIIc mRNA levels were significantly higher (P<0.01) in siESRP1-A + siNeg and siESRP1-B + siNeg by comparison with parental or siNeg cells, and were significantly decreased (P<0.01) by siESRP1-A + siFGFR-2 IIIc or siESRP1-B + siFGFR-2 IIIc (Supplemental Fig. 7A). Moreover, ESRP1 silencing with siESRP1-A or -B was associated with increased proliferation, migration and invasion, whereas in the presence of siFGFR-2 IIIc the cells were no longer growth-stimulated, and migration and invasion were inhibited (Supplemental Fig. 7B–D). Thus, suppression of ESRP1 enhances FGFR-2 IIIc expression and promotes pancreatic cancer cell proliferation, migration and invasion, and these deleterious effects can be blocked by suppressing FGFR-2 IIIc expression.
Proteomic Analysis of ESRP1-transfected PANC-1 Cells
ESRP1 has been reported to play important roles in ESRP-regulated splicing network of hundreds of alternative splicing events within numerous genes with functions in cell-cell adhesion, polarity, and migration (19). To examine the proteins which are regulated by ESRP1, we performed 2-dimentional electrophoresis using transient ESRP1-expression vector transfected PANC-1cells, and identified eight spots whose expression levels were altered at a two-fold cut-off as compared with PANC-EV cells, and then identified these proteins using software. Transient ESRP1-transfected PANC-1 cells exhibited decreased expression of vimentin, 14-3-3ε, heat shock protein 70 (HSP 70), and the IQ motif containing GTPase activating protein 1 (IQGAP1), and increased expression of valosin containing protein (VCP), α-enolase (ENO1), filamin-α (FLNA), and perilipin 3 (PLIN3) (Table 1) . To validate these results, we performed quantitative PCR using RNA from PANC-1 cells transiently overexpressing ESRP1, and from KLM-1 transfected with siESRP1. Vimentin, 14-3-3ε, HSP 70, and IQGAP1 mRNA levels were decreased in ESRP1 overexpressing PANC-1cells (Supplemental Fig. 8). Conversely, VCP, ENO1, and FLNA mRNAs were decreased in siESRP1 expressing KLM-1 cells (Supplemental Fig. 9). These results were consistent with the data obtained by 2-dimentional electrophoresis. Except for FLNA, there are no previous reports about splicing variants for these mRNA moieties. PCR analysis for the common site for FLNA and its splicing variant yielded similar results, leading us to conclude that ESRP1 did not regulate the splicing of FLNA.
Table 1. Identification of Differentially Expressed Proteins in Transiently ESRP1-transfected PANC-1 Cells.
Proteomic analysis revealed that ESRP1-transfected PANC-1 cells transiently transfected to express high ESRP1 levels exhibited decreased expression of vimentin, 14-3-3ε, heat shock protein 70, and IQGAP1, and increased expression of valosin containing protein, α-enolase, filamin-α and perilipin 3
| Protein | MW (kDa) | PI | fold | score | |
|---|---|---|---|---|---|
| Down-regulated proteins in ESRP1 overexpressing PANC-1 cells | |||||
| 1 | 14-3-3 protein epsilon | 29 | 4.63 | 0.253952 | 361 |
| 2 | IQ motif containing GTPase activating protein 1 | 186 | 6.08 | 0.342034 | 288 |
| 3 | vimentin | 53 | 5.06 | 0.414138 | 1050 |
| 4 | heat shock protein 70 | 71 | 5.37 | 0.417228 | 589 |
| Up-regulated proteins in ESRP1 overexpressing PANC-1 cells | |||||
| 5 | valosin containing protein | 89 | 5.15 | 1.998532 | 186 |
| 6 | alpha enolase | 47 | 7 | 2.29427 | 415 |
| 7 | perilipin 3 | 47 | 5.3 | 4.094434 | 572 |
| 8 | filamin alpha | 280 | 5.7 | 4.631485 | 759 |
We analyzed protein levels by immunoblotting in addition to analyzing the levels of differentially expressed proteins by proteomic analysis. Western blot analysis using anti-IQGAP1, FLNA and PLIN3 antibodies confirmed that ESRP1 modulated the levels of these proteins (Supplemental Fig. 10) in parallel with the observed changes observed by mass spectrometry (Table 1) and at the mRNA level (Supplemental Fig. 8). With respect to 14-3-3ε, the protein levels were only minimally decreased by ESRP1, but silencing ESRP1 in KLM-1 cells resulted in its upregulation (Supplemental Fig. 10). By contrast the changes in vimentin, HSP70, VCP, and ENO1 were subtle and inconsistent. Thus, both proteins that were either most decreased or most increased by ESRP1 based on the proteomics analysis are most likely true RNA binding targets for ESRP1.
ESRP1 suppressed EMT induced by TGF-β in PANC-1 cell
EMT is associated with enhanced cancer cell invasiveness (20), and several of the proteins identified by 2-dimentional electrophoresis, such as vimentin, have been implicated as modulators of EMT. In view of the important role of TGF-β1 in promoting EMT in PDAC cells, we next sought to determine whether ESRP1 levels modulated the actions of TGF-β1 on EMT. TGF-β1 (20 ng/ml) induced morphological changes associated with EMT in PANC-1 cells, and down-regulated E-cadherin while up-regulating vimentin in these cells at 24 and 48 hours following its addition to the medium (Supplemental Fig. 11A and B). When PANC-EV and PANC-ESRP1 cells were incubated with TGF-β1 (20 ng/ml) for 48 hours, PANC-EV cells changed from cobblestone-like to spindle-shaped, whereas the morphology of PANC-ESRP1 cells was not altered (Supplemental Fig. 11C). Moreover, basal E-cadherin mRNA levels were higher in PANC-ESRP1 cells (P<0.05) than that in PANC-EV cells, and basal vimentin levels were lower in PANC-ESRP1 cells (P<0.01) than in PANC-EV cells (Supplemental Fig. 11D and E).
Effects of ESRP1 expression in PANC-1 and KLM-1 cells on additional receptors
To assess the generality of the effects of ESRP1, we next examined the consequences of its increased expression on the alternative splicing of FGFR-1, FGFR-3, and CD44 (Supplemental Fig. 12A–C). ESRP1 overexpression resulted in an increase in the ratio of FGFR-1 IIIb/IIIc by comparison with control cells, without altering FGFR-3 IIIb/IIIc or CD44s/CD44 ratios, whereas in ESRP1 suppressed KLM-1 cells, the ratios of FGFR-1 IIIb/IIIc and FGFR-3 IIIb/IIIc were significantly lower than in KLM-1 control cells, and the CD44s/ total CD44 ratio was significantly increased.
Effects of ESRP1 on orthotopic tumor formation and liver metastasis in NOG mice
PANC-EV2 and PANC-EV9 cells and ESRP1-2 and ESRP1-5 cells readily formed tumors following subcutaneous implantation in nude mice. However, there were no significant differences in tumor growth between PANC-EV2 and PANC-EV9 cells and ESRP1-2 and ESRP1-5 cells over time (Supplemental Fig. 13).
Small fragments from these tumors were then implanted orthotopically in the pancreas of NOG mice, yielding pancreatic tumors that tended to be smaller in volume and lighter in weight when derived from ESRP1-2 and ESRP1-5 cells by comparison with the PANC-EV-derived tumors, but these differences were not statistically significant (Fig. 6A). By contrast, the ESRP1-2 and ESRP1-5 tumors exhibited a markedly decreased incidence of hepatic and pulmonary metastases by comparison with PANC-EV2 and 9 (Fig. 6B–C). The metastases were of human origin as demonstrated by positive human leukocyte antigen (HLA) class I immunoreactivity, which is expressed in cells of human but not mouse origin (Fig. 6B–C). Moreover, the percent of HLA class I positive cancer area/total tissue area was dramatically reduced in ESRP1-2 and ESRP1-5 tumors when compared with PANC-EV2 and 9 tumors, in the case of both hepatic (P<0.01, Fig. 6B) and pulmonary metastases (P<0.01, Fig. 6C). Interestingly, most of the mice implanted orthotopically with PANC-EV cells exhibited marked weight loss and cachexia and one mouse died. All the mice were sacrificed at that point due to animal ethics considerations. At that time point, all of the ESRP1 implanted mice appeared healthy and in stable condition, and did not exhibit cachexia.
Figure 6. Effects of ESRP1 on Orthotopic Tumor Growth and Metastasis in NOG Mice.
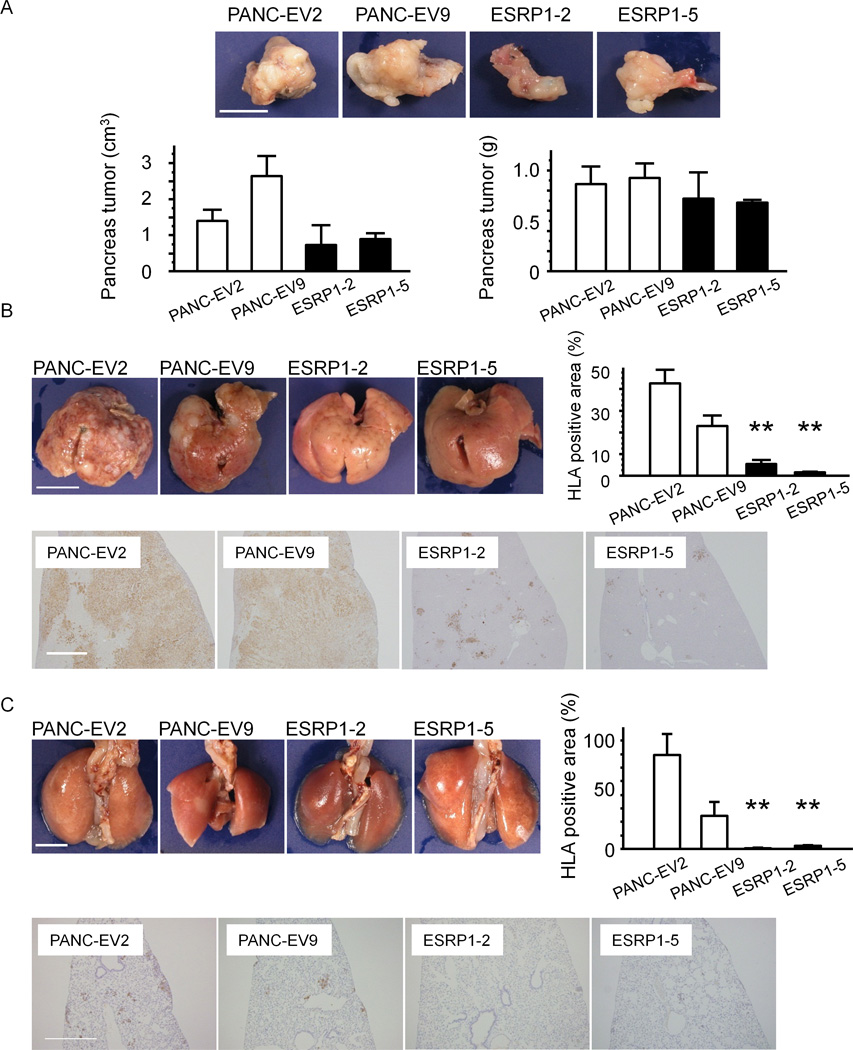
A: Tumor growth. Pancreatic tumors derived from PANC-EV cells were larger (left panel) and heavier (right panel) than tumors derived from ESRP1-transfected cells, but these differences were not statistically significant (n=3 in each group). Bar: 10 mm. B: Hepatic metastases. ESRP1-2 and ESRP1-5 cells exhibited fewer hepatic metastases by comparison with PANC-EV2 and 9 cells. Consequently, the percentage of human HLA class I positive cancer areas/total liver areas was markedly decreased in ESRP1-2 and ESRP1-5 tumors (**P<0.01). C: Pulmonary metastases. ESRP1-2 and ESRP1-5 cells also exhibited a markedly decreased incidence of pulmonary metastases, as evidenced by the lower percentage of human HLA class I positive cancer areas/total liver areas in ESRP1-2 and ESRP1-5 derived tumors (**P<0.01). bars: 10 mm and 0.1 mm in B; 5 mm and 0.2 mm in C.
Discussion
PDAC often arises from precursor lesions called pancreatic intraepithelial neoplasia (PanIN) that progress from low to high grade, to invasive and metastatic cancer (21–23). Major driver mutations in PDAC include mutated Kras (99% incidence), p53 (70%), Smad4 (55%) and p16 (85%), overexpression of multiple tyrosine kinase receptors and ligands, and overexpression of TGF-βs (24, 25). PDAC patients often exhibit distant metastases, especially to the liver and lung (26). PDAC is also associated with overexpression of FGF ligands and an intense desmoplasia (27, 28). Although the molecular mechanisms that modulate pancreatic cancer cell metastasis are not known, it is well established that the underlying processes are complex and multifactorial, and that the microenvironment, the immune system, and that both genetic and epigenetic alterations in cancer cells contribute to the metastatic process (29–31).
EMT represents an additional crucial mechanism for enhancing the ability of cancer cells to spread and metastasize (20). Many of the alterations that are associated with EMT may be affected through a repertoire of alternative splicing events which are regulated by key splicing factors such as ESRP1. In the present study we determined that ESRP1 was abundant in well-to-moderately differentiated cancers which also expressed high FGFR-2 IIIb levels, but its expression was decreased in poorly-differentiated cancers which expressed relatively high levels of FGFR-2 IIIc. These observations raise the possibility that increased ESRP1 levels lead to elevated levels of FGFR-2 IIIb and an epithelial rather than a mesenchymal phenotype that could reflect less aggressive disease. Five observations support this conclusion. First, elevated expression of ESRP1 was associated with prolonged survival. Second, PANC-1 cells engineered to express ESRP1 exhibited increased FGFR-2 IIIb expression and decreased migration and invasion in vitro. Third, ESRP1 blunted TGF-β-mediated induction of EMT. Fourth, silencing ESRP1 in KLM-1 cells was associated with increased FGFR-2 IIIc expression and increased cell growth, migration and invasion, and these changes were blocked by silencing FGFR-2 IIIc. Fifth, ESRP1 overexpressing PANC-1 clones formed significantly fewer hepatic and pulmonary metastases as compared with control clones.
ESRP1 and ESRP2 are act as central coordinators of an alternative splicing network that underlies EMT (14, 19). In our study, increased ESRP1 expression changed cell morphology from spindle shaped to cobblestone, prevented TGF-β1-induced morphological alterations that are associated with EMT, and suppressed cancer cell invasion. These alterations have been correlated with a mesenchymal to epithelial transition (MET) process (32). Moreover, high ESRP1 expression was associated with well to moderately differentiated lesions, low histological grades and improved survival. Together with the observation that ESRP1 repressed cell migration and invasion, our findings suggest that low ESRP1 levels contribute to enhanced EMT in PDAC.
Alternative splicing is now recognized to expand transcriptomic diversity and nearly all multi-exon human genes undergo alternative splicing (33, 34). Previous reports have shown that ESRP1 directly binds to the ISE/ISS-3 element of the FGFR-2 gene and induces expression of FGFR-2 IIIb (13). In the present study, transient transfection of ESRP1 in PANC-1 cells increased FGFR-2 IIIb mRNA levels, without altering FGFR-2 IIIc expression, perhaps due to the existence of additional mechanisms that regulate FGFR-2 IIIc expression. However, stable transfection of ESRP1 in PANC-1 cells yielded clones that either did not change expression of FGFR-2 IIIb or IIIc, or increased the expression of both receptors, underscoring the complexity of this splicing regulation. Nonetheless, in both clones, there was an increase in the ratio of FGFR-2 IIIb to FGFR-2 IIIc, and both clones exhibited decreased motility. The importance of ESPR1 in the modulation of FGFR2 isoform expression is highlighted by our observation that suppression of ESRP1 in KLM-1 cells consistently increased FGFR-2 IIIc mRNA levels without altering FGFR-2 IIIb expression, revealing that a 50% decrease in endogenous ESRP1 levels increased FGFR-2 IIIc for 2 to 3-fold. The biological significance of this increase is highlighted by the simultaneous knockdown of FGFR2IIIc and ESRP1 in KLM-1 cells which demonstrated that the increases in proliferation, migration and invasion induced by ESRP1 were eliminated by concomitantly down-regulating FGFR2IIIc expression.
Our results do not exclude the possibility that some of the observed biological effects in the present study could be due to ESRP1’s ability to modulate the splicing of numerous additional mRNA moieties. To explore this possibility, we performed proteomic analysis using transiently ESRP1-transfected PANC-1 cells. Most of the proteins thus identified are involved in the modulation of cell proliferation, migration, and invasion. Moreover, vimentin, has a well-known role in EMT. In addition, IQGAP1 is a large (189 kDa) scaffold protein that binds F-actin, helps promote cell migration, proliferation, and tumorigenesis (35). IQGAP1 also facilitates caveolae insertion into the plasma membrane (36), thereby helping to promote EMT (37). Similarly, 14-3-3ε promotes invasion of gastric cancer cells, and may promote EMT in these cells (38). Thus, the ability of ESRP1 to suppress both IQGAP1 and 14-3-3ε is consistent with its ability to suppress EMT. Recently, a splicing sensitive microarray platform was used to characterize ESRP-regulated splicing regulatory networks and identified hundreds of novel ESRP-regulated splicing events, but did not detect the candidate proteins identified and validated in our study (19). Moreover, there are no previous reports of alternative splicing variants of these potential target proteins, except for filamin alpha, underscoring the novelty of our findings and raising the possibility that these types of splicing events are context and cell dependent.
ESRP1 also modulated splicing of additional mRNA moieties in pancreatic cancer cells, as evidenced by our finding that its suppression resulted in alternative splicing of FGFR-1, FGFR-3, and CD44. CD44s has been implicated in promoting EMT (39) and its up-regulation in KLM-1 cells following ESRP1 silencing further confirms that ESRP1 acts by modulating multiple splicing events to suppress pancreatic cancer cell metastasis. In agreement with these observations, ESRP1 binds to 5'UTR of mRNAs and causes alterations in protein levels of several cancer related genes including c-myc, cyclin D1, p21, PKCα, integrin β and E-cadherin (15). Taken together with our present findings, these observations suggest that ESRP1 exerts an important role in metastasis-suppression in PDAC by modulating the expression of splice variants of many important mRNA moieties implicated in EMT. Given that EMT may lead to cancer cell dissemination from the pancreas even prior to tumor formation (40, 41), devising mechanisms to up-regulate ESRP1 may represent a novel chemopreventive and therapeutic approach for suppressing EMT and metastasis in PDAC.
Materials & Methods
Materials
The following were purchased: anti-ESRP1, anti-lamin A+C, anti-Perilipin 3, and anit-IQGAP1 antibodies from Abcam plc (Cambridge, MA); anti-filamin A from Novus Biologicals (Colorado, USA); anti-14-3-3ε from Cell signaling technology (Boston, MA); anti-CD31 antibody from AbD Serotec (Kidlington, UK); anti-cytokeratin (CK) 19 antibody from Boehringer Mannheim GmbH (Mannheim, Germany); anti-insulin antibody from DAKO JAPAN (Tokyo, Japan); anti-HLA class I-A, B, C antibody from Hokudo Co., Ltd. (Tokyo, Japan); Histofine Simple Stain MAX PO (M) and (R) kits from Nichirei (Tokyo, Japan); FastPure RNA kit and pBApo-CMV Neo DNA vector from Takara Bio Inc. (Tokyo, Japan); TaqMan Gene Expression Assays for ESRP1 (Hs00214472_m1), CD44s (Hs01081473_m1), CD44v (Hs00153304_m1), E-cadherin (Hs01012953_m1), Vimentin (Hs00185584_m1), HSP 70 (Hs03044880_gH), VCP (Hs00997642_m1), ENO1 (Hs00361415_m1), IQGAP1 (Hs00896595_m1), 14-3-3ε (Hs00356749_g1) FLNA (Hs00924645_m1, Hs00926963_m1), PLIN3 (Hs00998416_m1), and 18S rRNA (Hs99999901_s1), and siRNAs targeting human ESRP1 (s29571, 29572) and negative control siRNA (Silencer select Negative control #2) from Life Technologies Corporation (Carlsbad, CA), We prepared 2 different types of TaqMan primers for filamin alpha: one is specific for a splicing variant and the other is for common site of native filamin alpha and its splicing isoforms.; FuGene HD transfection reagent from Roche Diagnostics (Mannheim, Germany); TransIT-siQUEST Transfection Reagent from Mirus Bio LLC (Madison, WI); NE-PER nuclear and cytoplasmic extraction reagent from Thermo Fisher Scientific (Waltham, MA); WST-8 cell counting kit from Wako Pure Chemical Industries (Osaka, Japan); BioCoat Matrigel invasion chamber (8 µm pore size) from BD Bioscience (Franklin Lakes, NJ); immobilized pH gradient (IPG, pH4-7) strips and Oriole Fluorescent Gel Stain Kit from Bio-Rad laboratories (Hercules, CA); recombinant human ESRP1 (H00054845-P01) and recombinant human ESRP2 (H00080004-P01) from Novus Biologicals (Colorado, USA); recombinant human TGF-β1 from R&D Systems (Minneapolis, MN); and L-column Micro from Chemicals Evaluation and Research Institute (Tokyo, Japan). All other reagents were purchased from Sigma-Aldrich Corporation (St. Louis, MO). Anti-human ESRP1&2 antibody was a kind gift from Dr. Russ P Carstens (University of Pennsylvania School of Medicine, Philadelphia, PA) (19).
Human PDAC tissues
One hundred twenty three PDAC patients who participated in this study were receiving treatment at Nippon Medical School Hospital (Tokyo, Japan) from 1995 to 2011. The clinicopathological stage was determined according to the TNM classification system of the International Union Against Cancer (UICC). Normal pancreata were obtained from patients who underwent partial pancreatectomy due to the presence of a benign heterotopic spleen in the pancreas (n=8). This study was carried out in accordance with the principles embodied in the Declaration of Helsinki, 2008, and informed consent for the usage of pancreatic tissues was obtained from each patient.
Immunohistochemistry
Paraffin-embedded serial tissue sections (3.5 µm thick) were subjected to immunostaining using the Histofine Simple Stain Max-PO kits. Rabbit polyclonal anti-FGFR-2 IIIb (2) and IIIc antibodies (10, 42) were prepared as previously reported. Sections were then incubated overnight with the appropriate antibody (1:50 for ESRP1, 1:500 for FGFR-2 IIIb, 1:250 for FGFR-2 IIIc, 1:50 for CD31, 1:100 for CK19, 1:1,000 for insulin). For the evaluation of the intensity and positive proportion of ESRP1, FGFR-2 IIIb and FGFR-2 IIIc immunostaining, the following scale was employed: 0, no staining; 1+, mild staining; 2+, moderate staining; and 3+, intense staining,: 0, no staining; 1+,1–30%; 2+, 31–60%; 3+, >60%, positive proportion in cancer cells (43).
Pancreatic Cancer Cell Lines
PANC-1, MIA PaCa-2, KLM-1, PK-1, PK-8, and PK-45H, human PDAC cell lines were obtained from the Cell Resource Center for Biomedical Research, Institute of Development, Aging and Cancer, Tohoku University (Sendai, Japan), and Capan-1 cells were purchased from American Type Culture Collection (Manassas, VA). Cell lines were authenticated by short tandem repeat profiling analysis (March 2012).
Quantitative RT-PCR (qRT-PCR
qRT-PCR was performed with the StepOnePlus PCR system (Life Technologies Corporation) using specific primers and a TaqMan probe (10). qRT-PCR results were expressed as the ratio of target to 18S rRNA, the latter serving as an internal standard. Gene expression levels were measured in triplicate.
Construction of ESRP1 and FGFR-2 IIIc -expression-vector, and generation of transiently and stably transfected cells
The full-length ESRP1 cDNA fragment was ligated into pBApo-CMV Neo DNA vector. The full-length FGFR2IIIc cDNA fragment was ligated to the 3′ end of the human cytomegalovirus early promoter/enhancer in the eukaryotic expression vector pIRES2-EGFP. PANC-1 cells (1 × 10⁵) were transfected with 5 µg of DNA using FuGENE HD, and used in experiments 72 hours later. To prepare stable transfected clones, cells were passaged and cultured with Geneticin (1,000 µg/ml).
Transfection of siRNA targeting ESRP1 and FGFR-2 IIIc
We used 2 types of siRNA targeting different sites in ESRP1 mRNA; siESRP1-A and siESRP1-B. Sense ESRP1 siRNA sequences of siESRP1-A and siESRP1-B were 5’-CCUUCGAGGUCUUCCCUAU-3’, and 5’-GCAGCAAGAUGGAACUUAU-3’, respectively. Each siRNA stock solution and TransIT-siQUEST were mixed in serum-free medium. In preliminary experiments, the optimal concentration of siRNAs targeting ESRP1 was determined to be 2.5 nM by qRT-PCR for ESRP1. The custom designed siRNA against specific IIIc region of FGFR2 IIIc were purchased, and the sense sequence was 5’-GUG-CUU-GGC-GGG-UAA-UCC-Utt-3’ (s275291). The cells were plated at a density of 1×10⁵ cells in a 35 mm dish and transfected with 5 nM siRNAs for FGFR2 IIIc(10).
Western blot analysis
Cytoplasmic (cyt) and nuclear protein (nu) were separately extracted using the NE-PER extraction reagents. Lysates were subjected to sodium dodecyl sulfate-polyacrylamide gel electrophoresis (SDS-PAGE) using non-reducing conditions for the anti-ESRP1&2 antibodies, and reducing conditions for the other antibodies. The separated proteins were transferred to membranes, which were then incubated overnight with the anti-ESRP1&2 antibodies (1:1000 in dilution). Membranes were reblotted with a mouse anti-β-actin antibody (1:5000 in dilution) and anti-lamin A+C antibody (1:1000 in dilution). The anti-ESRP1 antibody (Sigma) which was used in immunohistochemical and fluorescence staining was not suitable for western blotting. Therefore, we used an ESRP antibody for western blotting which detected both ESRP1 and ESRP2 (13).
Immunofluorescence Staining
Cells were fixed with 4% paraformaldehyde, incubated with 0.1% of Triton-X for five minutes, and overnight at 4°C with the anti-ESRP1 antibody (1:100). Fluorescent images were observed under a Digital Eclipse C1 TE2000-E microscope (Nikon Instech Co., Ltd., Tokyo, Japan) (44). The confocal settings including laser power and detector sensitivity were unchanged during the acquisition of all images.
Cell proliferation assays
Cells were cultured in RPMI 1640 medium with 10% FBS at a density of 5×10³ in 96-well plates followed by incubation for 24, 48 or 72 hours. Cells were then incubated with WST-8 cell counting reagent for 4 hours. Optical density was measured using a plate reader (Bio-Rad Laboratory, Hercules, CA) at 450 nm.
Single cell movement assay
To assess cell migration, single cell movement assay was performed (10). Cells (5,000 per well) were seeded onto four-well glass bottom dish. Cell movement was monitored for 24 hours by a Digital Eclipse TE 2000-E motorized inverted microscope (Nikon Insteck Co., Ltd.). The total distance of individual cells covered within 24 hours was determined using the Metamorph software 7.6 (Universal Imaging Corp. Ltd., Buckinghamshire, UK).
Boyden chamber assays
Migration and invasion assays were carried out using a modified Boyden chamber technique. The cells on the upper surface of the filter were carefully removed with a cotton swab, after 8 hours for PANC-1 cells and after 20 hours for KLM-1 cells, due to the slower migration of KLM-1 cells. These time points were selected based on preliminary data (44). Cell numbers on each membrane were counted in five high-power fields (x 200). Cell invasion assays were performed using the matrigel coating inserts, and cell counting was performed as above.
Two-dimensional electrophoresis (2DE) and imaging
Two-dimensional gel electrophoresis was carried out by the method of Gorg et al. (45, 46) with modifications. First-dimension isoelectric focusing gel electrophoresis was carried out by using an electrophoresis apparatus from Nihon Eido (Tokyo, Japan) at 200 V for 30 min, at 400 V for 30 min, at 1,000 V for 1 h, and at 2,000 V for 15 to 16 h. Then, the second-dimensional SDS-PAGE was performed using a 10% acrylamide gel. After electrophoresis, the gels were stained with Oriole Fluorescent Gel Stain Kit. The gels were visualized using ChemiDoc XRS system (Bio-Rad, Hercules, CA) and analyzed using PDQuest 2D-image-analysis software (Bio-Rad).
Protein identification using mass spectrometry
The protein spots were excised manually and then digested using In-gel Tryptic Digestion Kit according to the manufacturer’s protocol. Liquid chromatography was performed using an Advance-nano UHPLC (AMR Inc., Tokyo, Japan). The eluents used were: A, 0.1% formic acid in water, and B, acetonitrile. Peptides generated by tryptic digestion were loaded onto a L-column Micro (C18, 3 µm, 0.1 × 50 mm) and separated at flow rate of 500 nl/min with the concentration gradient of acetonitrile from 5% B to 45% B in 30 min. Gradient-eluted peptides were analyzed using an amaZon ETD ion-trap mass spectrometer (Bruker Daltonics, Billerica, MA). The data were acquired in a data-dependent manner, in which MS/MS fragmentation was performed on the 10 most intense peaks of every full MS scan. All MS/MS spectra data were searched against the SwissProt using Mascot (Matrix Science, London, UK).
Effects of TGF-β1 in ESRP1-overexpressing PANC-1 cells
The ESRP1-expression-vector was transfected into PANC-1 cells which were then incubated for 24 hours. Recombinant human TGF-β1 (20 ng/ml) was then added to the incubation medium, and cells were incubated for 24 and 48 hours. RNA samples were then extracted.
Heterotopic and orthotopic implantations of ESRP1-overexpressed PANC-1 cells in immunodeficient mice
Six-week-old male nude mice (BALB/cA Jcl-nu/nu; CLEA Japan Inc, Tokyo, Japan) were subcutaneously injected in the both flanks with 1×10⁶ PANC-EV2, PANC-EV9, ESRP1-2 and ESRP1-5 cells/mouse (n=3). Four weeks later, the subcutaneous tumors were excised. To evaluate tumor growth in an orthotopic model, we used NOD/Shi-scid, IL-2ãnull (NOG; Central Institute for Experimental Animals, Kanagawa, Japan) mice (47). Tumor fragments from subcutaneous tumors (2 mm square) were sutured onto the surface of the tail of the pancreas of 6 week-old, male, NOG mice (n=3 per cell line) (10, 48). Animals were monitored for five weeks, and pancreatic tumors, lungs and livers were excised, weighed and processed for HLA class I immunostaining to mark cells that were of human origin. Quantitative morphometry was performed to determine the percent of HLA class I positive cancer area/total tissue area on five distinct areas, using WinROOF (Mitani Corporation, Fukui, Japan) (44). The experimental protocol was approved by the Animal Ethics Committee of Nippon Medical School.
Statistical analysis
All quantitative data were presented as mean±SEM values. Data for two groups were compared using Student’s t test. The data between multiple groups were compared using one-way ANOVA. The chi-square test and Fisher’s exact test were used to analyze the correlation between ESRP1-expression and clinicopathological features. Cumulative survival rate was calculated with the Kaplan-Meier method, and the significance of differences in survival rates was analyzed by the log-rank test. P<0.05 was considered as statistically significant. Computations were performed using the Stat View J version 5.0 software package (SAS Institute, Inc.).
Supplementary Material
Acknowledgements
We express our appreciation to Dr. Masahito Hagio for helpful discussion and Dr. Tetsushi Yamamoto, Mr. Yuji Yanagisawa, Ms. Taeko Suzuki, Ms. Yoko Kawamoto and Ms. Kiyoko Kawahara (Department of Pathology, Nippon Medical School) for their excellent technical assistance. We also thank Dr. Shin-ichi Tsuchiya (Division of Surgical Pathology, Nippon Medical School Hospital) for preparing tissue blocks. This work was supported by Grants-in-Aid for Scientific Research (C, No.22591531 for T. I.), a Grant-in-Aid for Young Scientists (A, No. 22689038 for Y. M.) a Grant-in-Aid for Challenging Exploratory Research (No. 23650604 for Y. M.) from the Japan Society for the Promotion of Science, and, in part, by NIH grant R37-CA-075059 to M. Korc.
Footnotes
Conflict of interest. The authors declare no conflict of interest.
References
- 1.Siegel R, Naishadham D, Jemal A. Cancer statistics, 2012. CA Cancer J Clin. 2012;62:10–29. doi: 10.3322/caac.20138. [DOI] [PubMed] [Google Scholar]
- 2.Cho K, Ishiwata T, Uchida E, Nakazawa N, Korc M, Naito Z, et al. Enhanced expression of keratinocyte growth factor and its receptor correlates with venous invasion in pancreatic cancer. Am J Pathol. 2007;170:1964–1974. doi: 10.2353/ajpath.2007.060935. [DOI] [PMC free article] [PubMed] [Google Scholar]
- 3.Ishiwata T, Friess H, Buchler MW, Lopez ME, Korc M. Characterization of keratinocyte growth factor and receptor expression in human pancreatic cancer. Am J Pathol. 1998;153:213–222. doi: 10.1016/S0002-9440(10)65562-9. [DOI] [PMC free article] [PubMed] [Google Scholar]
- 4.Dionne CA, Crumley G, Bellot F, Kaplow JM, Searfoss G, Ruta M, et al. Cloning and expression of two distinct high-affinity receptors cross-reacting with acidic and basic fibroblast growth factors. EMBO J. 1990;9:2685–2692. doi: 10.1002/j.1460-2075.1990.tb07454.x. [DOI] [PMC free article] [PubMed] [Google Scholar]
- 5.Miki T, Fleming TP, Bottaro DP, Rubin JS, Ron D, Aaronson SA. Expression cDNA cloning of the KGF receptor by creation of a transforming autocrine loop. Science. 1991;251:72–75. doi: 10.1126/science.1846048. [DOI] [PubMed] [Google Scholar]
- 6.Savagner P, Valles AM, Jouanneau J, Yamada KM, Thiery JP. Alternative splicing in fibroblast growth factor receptor 2 is associated with induced epithelial-mesenchymal transition in rat bladder carcinoma cells. Mol Biol Cell. 1994;5:851–862. doi: 10.1091/mbc.5.8.851. [DOI] [PMC free article] [PubMed] [Google Scholar]
- 7.Katoh M. FGFR2 abnormalities underlie a spectrum of bone, skin, and cancer pathologies. J Invest Dermatol. 2009;129:1861–1867. doi: 10.1038/jid.2009.97. [DOI] [PubMed] [Google Scholar]
- 8.Baum B, Settleman J, Quinlan MP. Transitions between epithelial and mesenchymal states in development and disease. Semin Cell Dev Biol. 2008;19:294–308. doi: 10.1016/j.semcdb.2008.02.001. [DOI] [PubMed] [Google Scholar]
- 9.Yan G, Fukabori Y, McBride G, Nikolaropolous S, McKeehan WL. Exon switching and activation of stromal and embryonic fibroblast growth factor (FGF)-FGF receptor genes in prostate epithelial cells accompany stromal independence and malignancy. Mol Cell Biol. 1993;13:4513–4522. doi: 10.1128/mcb.13.8.4513. [DOI] [PMC free article] [PubMed] [Google Scholar]
- 10.Ishiwata T, Matsuda Y, Yamamoto T, Uchida E, Korc M, Naito Z. Enhanced Expression of Fibroblast Growth Factor Receptor 2 IIIc Promotes Human Pancreatic Cancer Cell Proliferation. Am J Pathol. 2012;180:1928–1941. doi: 10.1016/j.ajpath.2012.01.020. [DOI] [PMC free article] [PubMed] [Google Scholar]
- 11.Hovhannisyan RH, Carstens RP. Heterogeneous ribonucleoprotein m is a splicing regulatory protein that can enhance or silence splicing of alternatively spliced exons. J Biol Chem. 2007;282:36265–36274. doi: 10.1074/jbc.M704188200. [DOI] [PubMed] [Google Scholar]
- 12.Mauger DM, Lin C, Garcia-Blanco MA. hnRNP H and hnRNP F complex with Fox2 to silence fibroblast growth factor receptor 2 exon IIIc. Mol Cell Biol. 2008;28:5403–5419. doi: 10.1128/MCB.00739-08. [DOI] [PMC free article] [PubMed] [Google Scholar]
- 13.Warzecha CC, Sato TK, Nabet B, Hogenesch JB, Carstens RP. ESRP1 and ESRP2 are epithelial cell-type-specific regulators of FGFR2 splicing. Mol Cell. 2009;33:591–601. doi: 10.1016/j.molcel.2009.01.025. [DOI] [PMC free article] [PubMed] [Google Scholar]
- 14.Warzecha CC, Shen S, Xing Y, Carstens RP. The epithelial splicing factors ESRP1 and ESRP2 positively and negatively regulate diverse types of alternative splicing events. RNA Biol. 2009;6:546–562. doi: 10.4161/rna.6.5.9606. [DOI] [PMC free article] [PubMed] [Google Scholar]
- 15.Leontieva OV, Ionov Y. RNA-binding motif protein 35A is a novel tumor suppressor for colorectal cancer. Cell Cycle. 2009;8:490–497. doi: 10.4161/cc.8.3.7679. [DOI] [PMC free article] [PubMed] [Google Scholar]
- 16.Gemmill RM, Roche J, Potiron VA, Nasarre P, Mitas M, Coldren CD, et al. ZEB1-responsive genes in non-small cell lung cancer. Cancer Lett. 2011;300:66–78. doi: 10.1016/j.canlet.2010.09.007. [DOI] [PMC free article] [PubMed] [Google Scholar]
- 17.Onder TT, Gupta PB, Mani SA, Yang J, Lander ES, Weinberg RA. Loss of E-cadherin promotes metastasis via multiple downstream transcriptional pathways. Cancer Res. 2008;68:3645–3654. doi: 10.1158/0008-5472.CAN-07-2938. [DOI] [PubMed] [Google Scholar]
- 18.Shapiro IM, Cheng AW, Flytzanis NC, Balsamo M, Condeelis JS, Oktay MH, et al. An EMT-driven alternative splicing program occurs in human breast cancer and modulates cellular phenotype. PLoS Genet. 2011;7:e1002218. doi: 10.1371/journal.pgen.1002218. [DOI] [PMC free article] [PubMed] [Google Scholar]
- 19.Warzecha CC, Jiang P, Amirikian K, Dittmar KA, Lu H, Shen S, et al. An ESRP-regulated splicing programme is abrogated during the epithelial-mesenchymal transition. EMBO J. 2010;29:3286–3300. doi: 10.1038/emboj.2010.195. [DOI] [PMC free article] [PubMed] [Google Scholar]
- 20.Thiery JP, Sleeman JP. Complex networks orchestrate epithelial-mesenchymal transitions. Nat Rev Mol Cell Biol. 2006;7:131–142. doi: 10.1038/nrm1835. [DOI] [PubMed] [Google Scholar]
- 21.Hruban RH, Maitra A, Goggins M. Update on pancreatic intraepithelial neoplasia. Int J Clin Exp Pathol. 2008;1:306–316. [PMC free article] [PubMed] [Google Scholar]
- 22.Hezel AF, Kimmelman AC, Stanger BZ, Bardeesy N, Depinho RA. Genetics and biology of pancreatic ductal adenocarcinoma. Genes Dev. 2006;20:1218–1249. doi: 10.1101/gad.1415606. [DOI] [PubMed] [Google Scholar]
- 23.Esposito I, Menicagli M, Funel N, Bergmann F, Boggi U, Mosca F, et al. Inflammatory cells contribute to the generation of an angiogenic phenotype in pancreatic ductal adenocarcinoma. J Clin Pathol. 2004;57:630–636. doi: 10.1136/jcp.2003.014498. [DOI] [PMC free article] [PubMed] [Google Scholar]
- 24.Korc M. Role of growth factors in pancreatic cancer. Surg Oncol Clin N Am. 1998;7:25–41. [PubMed] [Google Scholar]
- 25.Jones S, Zhang X, Parsons DW, Lin JC, Leary RJ, Angenendt P, et al. Core signaling pathways in human pancreatic cancers revealed by global genomic analyses. Science. 2008;321:1801–1806. doi: 10.1126/science.1164368. [DOI] [PMC free article] [PubMed] [Google Scholar]
- 26.Hidalgo M. Pancreatic cancer. N Engl J Med. 2010;362:1605–1617. doi: 10.1056/NEJMra0901557. [DOI] [PubMed] [Google Scholar]
- 27.Korc M, Friesel RE. The role of fibroblast growth factors in tumor growth. Curr Cancer Drug Targets. 2009;9:639–651. doi: 10.2174/156800909789057006. [DOI] [PMC free article] [PubMed] [Google Scholar]
- 28.Feig C, Gopinathan A, Neesse A, Chan DS, Cook N, Tuveson DA. The pancreas cancer microenvironment. Clin Cancer Res. 2012;18:4266–4276. doi: 10.1158/1078-0432.CCR-11-3114. [DOI] [PMC free article] [PubMed] [Google Scholar]
- 29.Joyce JA, Pollard JW. Microenvironmental regulation of metastasis. Nat Rev Cancer. 2009;9:239–252. doi: 10.1038/nrc2618. [DOI] [PMC free article] [PubMed] [Google Scholar]
- 30.Grivennikov SI, Greten FR, Karin M. Immunity, inflammation, and cancer. Cell. 2010;140:883–899. doi: 10.1016/j.cell.2010.01.025. [DOI] [PMC free article] [PubMed] [Google Scholar]
- 31.Nguyen DX, Bos PD, Massague J. Metastasis: from dissemination to organ-specific colonization. Nat Rev Cancer. 2009;9:274–284. doi: 10.1038/nrc2622. [DOI] [PubMed] [Google Scholar]
- 32.Di Modugno F, Iapicca P, Boudreau A, Mottolese M, Terrenato I, Perracchio L, et al. Splicing program of human MENA produces a previously undescribed isoform associated with invasive, mesenchymal-like breast tumors. Proc Natl Acad Sci U S A. 2012;109:19280–19285. doi: 10.1073/pnas.1214394109. [DOI] [PMC free article] [PubMed] [Google Scholar]
- 33.Pan Q, Shai O, Lee LJ, Frey BJ, Blencowe BJ. Deep surveying of alternative splicing complexity in the human transcriptome by high-throughput sequencing. Nat Genet. 2008;40:1413–1415. doi: 10.1038/ng.259. [DOI] [PubMed] [Google Scholar]
- 34.Wang ET, Sandberg R, Luo S, Khrebtukova I, Zhang L, Mayr C, et al. Alternative isoform regulation in human tissue transcriptomes. Nature. 2008;456:470–476. doi: 10.1038/nature07509. [DOI] [PMC free article] [PubMed] [Google Scholar]
- 35.Johnson M, Sharma M, Henderson BR. IQGAP1 regulation and roles in cancer. Cell Signal. 2009;21:1471–1478. doi: 10.1016/j.cellsig.2009.02.023. [DOI] [PubMed] [Google Scholar]
- 36.Wickstrom SA, Lange A, Hess MW, Polleux J, Spatz JP, Kruger M, et al. Integrin-linked kinase controls microtubule dynamics required for plasma membrane targeting of caveolae. Dev Cell. 2010;19:574–588. doi: 10.1016/j.devcel.2010.09.007. [DOI] [PMC free article] [PubMed] [Google Scholar]
- 37.Bailey KM, Liu J. Caveolin-1 up-regulation during epithelial to mesenchymal transition is mediated by focal adhesion kinase. J Biol Chem. 2008;283:13714–13724. doi: 10.1074/jbc.M709329200. [DOI] [PMC free article] [PubMed] [Google Scholar]
- 38.Yan L, Gu H, Li J, Xu M, Liu T, Shen Y, et al. RKIP and 14-3-3epsilon Exert an Opposite Effect on Human Gastric Cancer Cells SGC7901 by Regulating the ERK/MAPK Pathway Differently. Dig Dis Sci. 2013;58:389–396. doi: 10.1007/s10620-012-2341-y. [DOI] [PubMed] [Google Scholar]
- 39.Brown RL, Reinke LM, Damerow MS, Perez D, Chodosh LA, Yang J, et al. CD44 splice isoform switching in human and mouse epithelium is essential for epithelial-mesenchymal transition and breast cancer progression. J Clin Invest. 2011;121:1064–1074. doi: 10.1172/JCI44540. [DOI] [PMC free article] [PubMed] [Google Scholar]
- 40.Rhim AD, Mirek ET, Aiello NM, Maitra A, Bailey JM, McAllister F, et al. EMT and dissemination precede pancreatic tumor formation. Cell. 2012;148:349–361. doi: 10.1016/j.cell.2011.11.025. [DOI] [PMC free article] [PubMed] [Google Scholar]
- 41.Tuveson DA, Neoptolemos JP. Understanding metastasis in pancreatic cancer: a call for new clinical approaches. Cell. 2012;148:21–23. doi: 10.1016/j.cell.2011.12.021. [DOI] [PubMed] [Google Scholar]
- 42.Kawase R, Ishiwata T, Matsuda Y, Onda M, Kudo M, Takeshita T, et al. Expression of fibroblast growth factor receptor 2 IIIc in human uterine cervical intraepithelial neoplasia and cervical cancer. Int J Oncol. 2010;36:331–340. [PubMed] [Google Scholar]
- 43.Matsuda Y, Yamamoto T, Kudo M, Kawahara K, Kawamoto M, Nakajima Y, et al. Expression and roles of lumican in lung adenocarcinoma and squamous cell carcinoma. Int J Oncol. 2008;33:1177–1185. [PubMed] [Google Scholar]
- 44.Matsuda Y, Naito Z, Kawahara K, Nakazawa N, Korc M, Ishiwata T. Nestin is a novel target for suppressing pancreatic cancer cell migration, invasion and metastasis. Cancer Biol Ther. 2011;11:512–523. doi: 10.4161/cbt.11.5.14673. [DOI] [PMC free article] [PubMed] [Google Scholar]
- 45.Gorg A, Obermaier C, Boguth G, Csordas A, Diaz JJ, Madjar JJ. Very alkaline immobilized pH gradients for two-dimensional electrophoresis of ribosomal and nuclear proteins. Electrophoresis. 1997;18:328–337. doi: 10.1002/elps.1150180306. [DOI] [PubMed] [Google Scholar]
- 46.Gorg A, Obermaier C, Boguth G, Weiss W. Recent developments in two-dimensional gel electrophoresis with immobilized pH gradients: wide pH gradients up to pH 12, longer separation distances and simplified procedures. Electrophoresis. 1999;20:712–717. doi: 10.1002/(SICI)1522-2683(19990101)20:4/5<712::AID-ELPS712>3.0.CO;2-Y. [DOI] [PubMed] [Google Scholar]
- 47.Suemizu H, Monnai M, Ohnishi Y, Ito M, Tamaoki N, Nakamura M. Identification of a key molecular regulator of liver metastasis in human pancreatic carcinoma using a novel quantitative model of metastasis in NOD/SCID/gammacnull (NOG) mice. Int J Onco. 2007;31:741–751. [PubMed] [Google Scholar]
- 48.Seiden-Long I, Navab R, Shih W, Li M, Chow J, Zhu CQ, et al. Gab1 but not Grb2 mediates tumor progression in Met overexpressing colorectal cancer cells. Carcinogenesis. 2008;29:647–655. doi: 10.1093/carcin/bgn009. [DOI] [PubMed] [Google Scholar]
Associated Data
This section collects any data citations, data availability statements, or supplementary materials included in this article.