Abstract
Purpose
In dose painting, in which functional imaging is used to define biological targets for radiation therapy dose escalation, changes in spatial distributions of biological properties during treatment can compromise the quality of therapy. The goal of this study was to assess the spatiotemporal stability of 2 potential dose painting target—dhypoxia and proliferation—in canine tumors during radiation therapy.
Methods and Materials
Twenty-two canine patients with sinonasal tumors (14 carcinoma and 8 sarcoma) were imaged before hypofractionated radiation therapy with copper(II)-diacetyl-bis(N4-methylthiosemicarbazone) (Cu-ATSM) positron emission tomography/computed tomography (PET/CT) for hypoxia and 3′-deoxy-3′-18F-fluorothymidine (FLT) PET/CT for proliferation. The FLT scans were repeated after 2 fractions and the Cu-ATSM scans after 3 fractions. Midtreatment PET/CT images were deformably registered to pretreatment PET/CT images. Voxel-based Spearman correlation coefficients quantified the spatial stability of Cu-ATSM and FLT uptake distributions between pretreatment and midtreatment scans. Paired t tests determined significant differences between the patients’ respective Cu-ATSM and FLT correlations coefficients. Standardized uptake value measures were also compared between pretreatment and midtreatment scans by use of paired t tests.
Results
Spatial distributions of Cu-ATSM and FLT uptake were stable through mid-treatment for both sarcomas and carcinomas: the population mean ± standard deviation in Spearman correlation coefficient was 0.88 ± 0.07 for Cu-ATSM and 0.79 ± 0.13 for FLT. The patients’ Cu-ATSM correlation coefficients were significantly higher than their respective FLT correlation coefficients (P=.001). Changes in Cu-ATSM SUV measures from pretreatment to midtreatment were histology dependent: carcinomas experienced significant decreases in Cu-ATSM uptake (P<.05), whereas sarcomas did not (P>.20). Both histologies experienced significant decreases in FLT uptake (P<.05).
Conclusions
Spatial distributions of Cu-ATSM were very stable after a few fractions of radiation therapy. FLT spatial distributions were generally stable early in therapy, although they were significantly less stable than Cu-ATSM distributions. Canine tumors had significantly lower proliferative activity at midtreatment than at pretreatment, and they experienced histology-dependent changes in Cu-ATSM uptake.
Introduction
After radiation therapy, most local recurrences occur at the primary tumor site—the region receiving the highest dose—indicating the need for higher tumor doses (1, 2). Increased doses, however, can also lead to increased normal tissue complications. Dose painting has been proposed as a potential solution to these conflicting objectives. In dose painting, a nonuniform dose is prescribed to a tumor volume, tailored to match the spatial heterogeneity of an underlying biological property linked with radioresistance (3), enabling higher doses to be delivered to tumor subregions of suspected recurrence while maintaining, or even lowering, normal tissue doses.
Several biological properties have been considered as potential dose painting targets. Tumor hypoxia is hypothesized to directly decrease the sensitivity of tumor cells to ionizing radiation (4) and is associated with poor clinical outcome (5). With the use of positron emission tomography (PET), hypoxia distributions can be imaged in vivo with radiotracers such as copper(II)-diacetylbis(N4-methylthiosemicarbazone) (Cu-ATSM) or 18F-fluoromisonidazole (FMISO), among others (6). The resulting 3-dimensional (3D) images of hypoxia distributions can then guide prescribed dose distributions, as has been the subject of several feasibility studies (7-9).
There is concern, however, over the spatiotemporal stability of hypoxia maps, particularly in the context of dose painting (10, 11). Tumor hypoxia levels have been shown to fluctuate over time (12). If hypoxic locations change between pretreatment measurements and the beginning of therapy, or if hypoxic locations change during therapy, the quality of dose painting plans could greatly deteriorate: sensitive regions could be overdosed but resistant regions underdosed. To ensure that hypoxic regions are indeed preferentially targeted, hypoxia imaging would need to be repeated frequently and dose painting plans adjusted accordingly, which may not be technically or economically feasible. The spatial stability of hypoxia distributions has previously been investigated with the use of repeated FMISO PET scans, but with conflicting results: Roels et al (13), Nehmeh et al (14), and Lin et al (15) found poor spatial stability in serial FMISO images, whereas Okamoto et al (16) found very high spatial stability. Therefore, the stability of hypoxic targets before and during radiation therapy remains uncertain.
Cellular proliferation is another biological property that may be useful in guiding dose painting plans. Accelerated repopulation of surviving cancer cells during therapy has been shown to adversely influence treatment outcome (17). Furthermore, drastic changes in uptake of 3′-deoxy-3′-18F-fluorothymidine (FLT), a PET radiotracer for proliferation, have been observed after the beginning of radiation therapy (18, 19). This has created interest in using changes in FLT uptake from pretherapy to midtherapy as a possible early response indicator (20, 21). Extending this idea to the voxel level, the change in a voxel's FLT uptake might be indicative of the voxel's response to therapy, so that maps of voxel responses might provide useful information for biological target definition. It is therefore important to characterize how proliferation distributions change in tumors during radiation therapy.
The goal of this study was twofold: to assess the spatial and absolute stability of Cu-ATSM PET during radiation therapy as a surrogate for tumor hypoxia stability, and to measure changes in FLT PET during radiation therapy as a surrogate for changes in cell proliferation. Canine veterinary patients with spontaneously occurring sinonasal tumors were used as subjects so that motion, setup, and image registration could be carefully controlled.
Methods and Materials
Patient population
The study included 22 canine veterinary patients referred “to the University of Wisconsin Veterinary Medical Teaching Hospital”. The research protocol was approved by the Animal Care and Use Committee of “the University of Wisconsin”, and all dog owners signed a written informed consent. The patients received diagnoses made with the use of computed tomography (CT), and they underwent biopsies for histopathologic evaluation. All dogs had nasal or paranasal sinus tumors of stage I to III (mean tumor volume, 55 cm3), with no evidence of distant metastases or intracranial extension. Histopathology revealed 13 adeno-carcinoma, 7 chondrosarcoma, 1 squamous cell carcinoma, and 1 osteosarcoma. All imaging and treatment sessions were monitored by a veterinarian.
Imaging and treatment
The patients were treated with intensity modulated radiation therapy (IMRT) delivered by helical tomotherapy with curative intent. They were divided into 2 treatment groups as part of a larger study investigating dose escalation. The first group received the standard-of-care prescription: 4.2 Gy × 10 fractions to the planning target volume for a total of 42 Gy. The second group was prescribed 4.2 Gy × 10 fractions to the planning target volume with an additional boost of 0.8 Gy × 10 fractions to the gross tumor volume (GTV) plus a 2-mm margin.
The imaging and treatment schedules were as follows: Patients received pretreatment [61Cu]Cu-ATSM and [18F] FLT PET/CT scans 1 to 3 days before the beginning of therapy, with at least 1 day between scans. Patients received a second FLT scan after 2 fractions of IMRT (8.4 or 10 Gy) and a weekend break. Patients received a second Cu-ATSM scan after the third fraction of IMRT (12.6 or 15 Gy). Midtreatment FLT and Cu-ATSM scans were acquired on consecutive days. One patient did not receive a midtreatment FLT scan because of equipment failure. Patients were injected with 150 to 370 MBq of tracer. After injection, patients were kept in a kennel to limit physical activity. PET/CT scans were performed on a Discovery VCT (GE Healthcare, Waukesha, WI) PET/CT scanner. Patients were anesthetized during scans with an initial propofol bolus injection, and then isoflurane plus 100% oxygen. For Cu-ATSM scans, the time between tracer injection and the start of the PET scan was 3 hours; scans were 20-minute 3D static acquisitions over a single 15-cm bed position. FLT scans were 90-minute 3D dynamic acquisitions over a single 15-cm bed position. Emission data were attenuation corrected and reconstructed by the use of ordered subset expectation maximization (2 iterations, 35 subsets, and 3 mm postfiltering). The image grid was 256 × 256 × 47 with 2.0 × 2.0 × 3.3 mm3 voxel sizes. Voxel activity measurements were converted to standardized uptake values (SUVs) for analysis. For FLT scans, SUVs were calculated by averaging frames from 60 to 90 minutes. To achieve reproducible positioning across PET/CT scans and IMRT treatment sessions, patients’ maxillae were positioned into custom dental molds that were affixed to the scanner and treatment couches, and patients’ bodies were immobilized with vacuum mattresses (22).
Data analysis
We assessed the spatial stability of Cu-ATSM and FLT SUV distributions from pretreatment to midtreatment. GTVs were contoured by veterinarians using pretreatment CT images. For each patient, pretreatment and midtreatment CT images were deformably registered by use of the optical flow algorithm (23), and the resulting transformations were applied to their respective PET data. This allowed for voxel-based comparisons of pretreatment and midtreatment tracer distributions. To quantify tracer spatial stability, voxel-based Spearman rank correlation coefficients (ρ) were calculated for Cu-ATSM (ρCu-ATSM) and FLT (ρFLT) within each patient's GTV, comparing pre-treatment and midtreatment voxel SUV distributions. Spearman correlation coefficients were preferred over Pearson correlation coefficients because SUV distributions were often not normally distributed. Population-averaged ρ were calculated with the Fisher transformation, and 2-sided paired t tests compared patients’ ρCu-ATSM and ρFLT. We also investigated whether or not ρCu-ATSM and ρFLT were influenced by tumor volume, or by the level of uptake heterogeneity within the tumor, which we quantified using the standard deviation (SD) of the SUV distribution within the GTV (SUVSD).
In addition to assessing voxel correlations, we quantified the degree of spatial overlap between the high-uptake regions at pretreatment and midtreatment. For each tumor, various thresholds were used to segment high-uptake regions. Thresholding was not performed as a percentage of the SUVmax, as is typically done in PET segmentation; this type of thresholding can result in extremely small volumes for some tumor distributions. Instead, we performed volume-based thresholding of the sorted SUV distribution, from 10% to 90%, in 10% increments. For instance, a 70% threshold would include 30% of the GTV's highest uptake voxels. For each threshold level, both pretreatment and midtreatment high-uptake volumes were segmented, and Dice coefficients quantified the degree of spatial overlap. The Dice coefficient is defined as the ratio of the intersection of 2 regions to the average volume of the 2 regions. After calculation of each patient's Dice coefficients for both tracers and all threshold levels, 2-sided paired t tests determined whether, across the population, Dice coefficients for Cu-ATSM were significantly different from Dice coefficients for FLT.
We investigated whether or not the magnitudes of Cu-ATSM and FLT uptake were significantly lower at mid-treatment than at pretreatment. The maximum voxel SUV in the GTV (SUVmax), the mean SUV of a 1-cm3 sphere centered at SUVmax (SUVpeak), and the mean SUV of the GTV (SUVmean) were calculated for pretreatment and midtreatment PET scans (midtreatment SUV measurements were assessed before deformable registration). Two-sided paired t tests determined whether changes in the SUV measures from pretreatment to midtreatment were statistically significant across the population, with a significance level of P≤.05.
Results
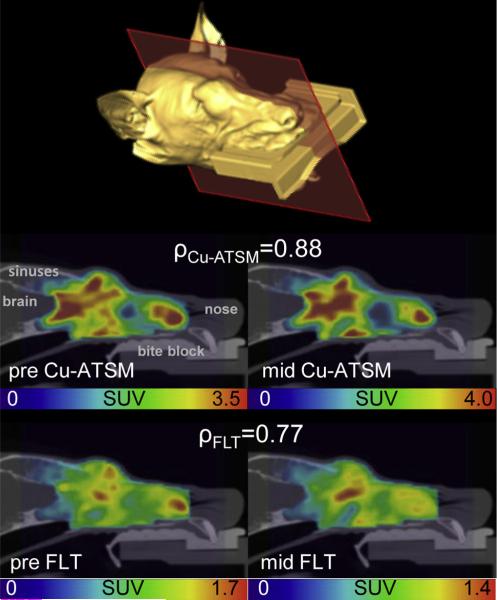
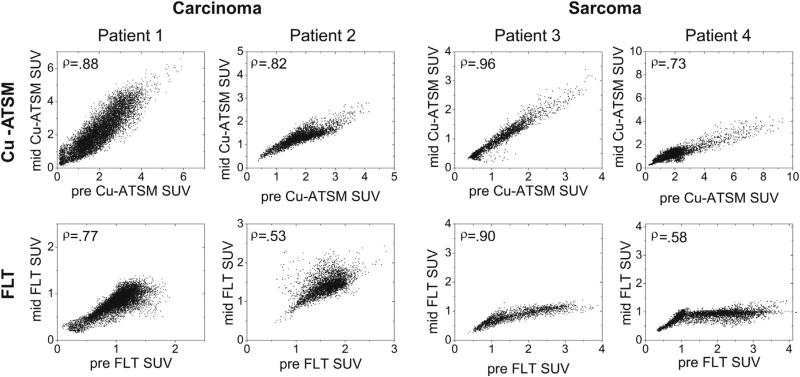
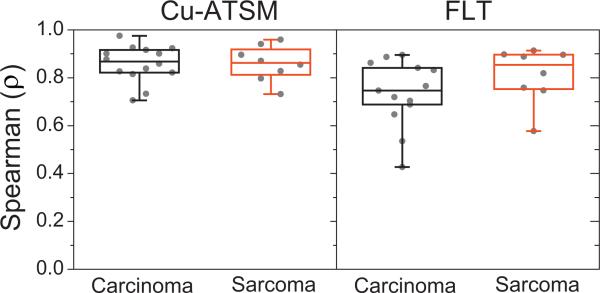
A patient's pretreatment and midtreatment PET/CT images are shown in Figure 1. Voxel scatter plots comparing pre-treatment and midtreatment Cu-ATSM and FLT PET distributions are shown for 4 patients in Figure 2. The population-averaged ρCu-ATSM (±SD) was 0.88 ± 0.07 for all patients, 0.88 ± 0.08 for carcinoma patients, and 0.88 ± 0.07 for sarcoma patients. The population-averaged ρFLT was 0.79 ± 0.13 for all patients, 0.76 ± 0.14 for carcinoma patients, and 0.84 ± 0.12 for sarcoma patients. All patients’ ρCu-ATSM and ρFLT are shown in Figure 3. Carcinoma and sarcoma populations were not significantly different in terms of ρCu-ATSM or ρFLT values. Using paired t tests, we found that patients’ ρCu-ATSM were consistently higher than their respective ρFLT values (P=.001). We did not find significant correlations between tumor volume and ρCu-ATSM or ρFLT (R ≈ .2), or between SUVSD and ρCu-ATSM or ρFLT (|R|<.2), indicating that tracer stability was not likely affected by tumor volume or tumor heterogeneity.
Fig. 1.
Example sagittal positron emission tomography/ computed tomography slices are shown from a carcinoma patient's pretreatment (pre) and midtreatment (mid) copper(II)-diacetyl-bis(N4-methylthiosemicarbazone) (Cu-ATSM) (middle) and 3′-deoxy-3′-18F-fluorothymidine (FLT) (bottom) scans. An isosurface is shown for anatomic reference. This patient is the same as Patient 1 in Figure 2 and had ρCu-ATSM and ρFLT values similar to the population averages. SUV = standardized uptake value.
Fig. 2.
Voxel-based scatter plots comparing pretreatment (pre) and midtreatment (mid) copper(II)-diacetyl-bis(N4-methylthiosemicarbazone) (Cu-ATSM) standardized uptake value (SUV) distributions (top row) and 3′-deoxy-3′-18F-fluorothymidine (FLT) SUV distributions (bottom row) for 4 different patients — 2 carcinomas and 2 sarcomas. Spearman rank correlation coefficients are shown in upper left corners.
Fig. 3.
Quartile box plots of all patients’ ρCu-ATSM (left) and ρFLT (right), representing the degree of tracer spatial stability through midtreatment, separated by histologic tumor type. Cu-ATSM = copper(II)-diacetyl-bis (N4-methylthiosemicarbazone); FLT = 3′-deoxy-3′-18F-fluorothymidine.
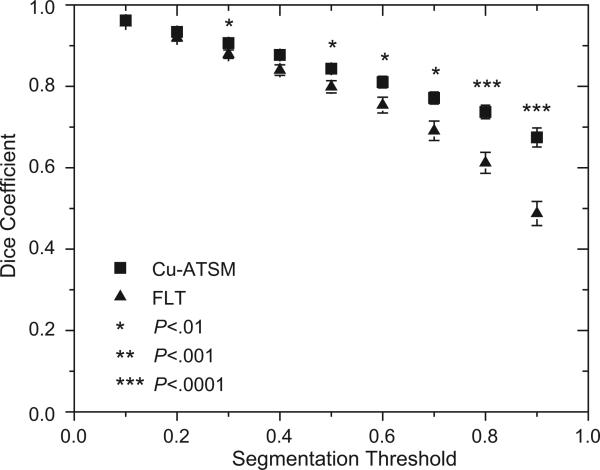
Figure 4 shows the population-averaged Cu-ATSM and FLT Dice coefficients, quantifying the degree of overlap between pretreatment and midtreatment high-uptake regions, plotted as a function of segmentation method. For example, with the use of a 70% threshold (ie, the hottest 30% of the tumor volume), 77% of the pretreatment Cu-ATSM–avid regions, on average, overlapped with the mid-treatment Cu-ATSM–avid regions; for FLT and a 70% threshold, the average overlap was 69%. Paired t tests found that for a threshold of 30% and for thresholds greater than 50%, patients’ Cu-ATSM Dice coefficients were consistently greater than their respective FLT Dice coefficients (P<.01).
Fig. 4.
Population-averaged Dice coefficients quantifying the overlap between high-uptake regions at pretreatment and midtreatment plotted as a function of segmentation method. Also shown are standard errors and results from paired t tests comparing patients’ respective copper(II)-diacetyl-bis(N4-methylthiosemicarbazone) (Cu-ATSM) and 3′-deoxy-3′-18F-fluorothymidine (FLT) Dice coefficients.
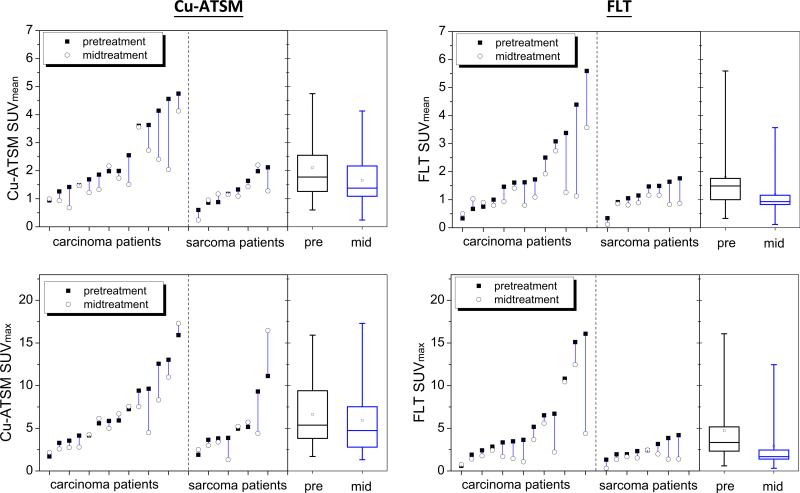
The resulting pretreatment and midtreatment SUVmean and SUVmax measurements are presented in Figure 5. On average, Cu-ATSM SUVmean decreased by 18% at mid-treatment, or 1.2%/Gy when normalized by the prescribed dose. FLT SUVmean decreased by 24% (2.5%/Gy) at mid-treatment. The average decreases in SUVmax were 9% (0.6%/Gy) for Cu-ATSM and 36% (3.8%/Gy) for FLT. Table 1 shows the results from paired t tests comparing pretreatment and midtreatment SUV measures. On average, patients had significantly lower FLT uptake after 2 fractions of hypofractionated IMRT regardless of histology. A significant reduction in Cu-ATSM uptake was observed for carcinoma patients, whereas sarcoma patients showed no significant changes in Cu-ATSM uptake. Dose level (42 Gy vs 50 Gy) had no significant effect on changes in Cu-ATSM and FLT SUV measures.
Fig. 5.
Parallel line plots comparing each patient's pretreatment (solid square) and midtreatment (empty circle) standardized uptake value (SUV) measures for copper(II)-diacetyl-bis(N4-methylthiosemicarbazone) (Cu-ATSM) SUVmean and SUVmax (left) and 3′-deoxy-3′-18F-fluorothymidine (FLT) SUVmean and SUVmax (right), separated by histology. Also included are quartile box plots representing population distributions of respective SUV measures.
Discussion
Spatial stability of tracer distributions
We assessed the spatial stability of Cu-ATSM and FLT distributions during treatment in canine sinonasal tumors. These patients were ideal for this study for several reasons: anesthesia during imaging eliminated motion, given that motion blurring can cause 2 images to appear more similar than they really are (24); the bone surrounding the nasal cavity guided accurate image registration, because registration inaccuracies can significantly degrade voxel-based correlations (25); and precise immobilization techniques enabled repeatable positioning.
Overall, spatial distributions of Cu-ATSM uptake were very stable from pretreatment to midtreatment. Only 3 patients had ρCu-ATSM values less than 0.8. Even the highest uptake regions of the tumors (thresholds of 90%) had high average overlap (67%) between pretreatment and midtreatment. Therefore, in canine sinonasal tumors, Cu-ATSM dose-painting targets are spatially stable early during radiation therapy, so that neither multiple PET scans before therapy nor treatment adaptation based on additional PET imaging early in therapy are necessary. Our results are consistent with the results of Okamoto et al (16), who found average voxel correlations from FMISO test-retest scans to be 0.89 in patients with head and neck cancer. By contrast, Nehmeh et al (14) found the average voxel-based correlations from FMISO test-retest scans in patients with head and neck cancer to be 0.6 over the whole tumor volume, and 0.3 when only the most hypoxic subvolumes were considered.
On average, pretreatment and midtreatment FLT distributions were strongly correlated. This indicates that, for most patients, the most proliferative regions of the tumor generally remained the most proliferative regions early in therapy. This was surprising, considering that FLT uptake at midtreatment was often low (the average midtreatment SUVmean was only 1.2), and one would expect correlations to deteriorate as tumor uptake approached background levels. Considerable interpatient heterogeneity in ρFLT, however, was observed, with 3 patients’ ρFLT values lower than 0.6. In addition, patients’ ρFLT were significantly lower than their respective ρCu-ATSM, and FLT Dice coefficients were significantly lower than Cu-ATSM Dice coefficients for the high-uptake thresholds. Even the highest measured ρFLT (0.91) was only slightly better than the average ρCu-ATSM (0.88), and the highest FLT uptake regions (threshold of 90%) only had moderate overlap (49%) from pretreatment to midtreatment. This indicates that proliferative response to radiation is not spatially uniform throughout the tumor, and that the magnitude of intratumor heterogeneity in proliferative response appears to vary considerably across patients. Further investigation is warranted on whether intratumor proliferative response heterogeneity could provide useful information for defining dose painting targets.
Changes in tracer uptake magnitude
The reason for histology-dependent changes in Cu-ATSM SUV measures is uncertain. We have previously shown in this patient population that sarcoma tumors tend to have lower pretreatment uptake of Cu-ATSM and 2-deoxy-2-[18F]fluoro-D-glucose (FDG) than carcinomas (26), although it is not clear if or how this relates to changes in Cu-ATSM uptake during therapy. Other animal models have also demonstrated cell-line dependence in reoxyge-nation patterns (27). The reduction in Cu-ATSM uptake, however, may also be a consequence of cell kill. SUV values are affected not only by the biological property of interest (eg, hypoxia) but by the number of tumor cells available to take up the tracer (ie, cellular density). Consequently, decreases in SUV during therapy cannot be fully attributed to either biological changes or anatomic changes alone, but rather to some combination of both. On the basis of our analysis of megavoltage CTs acquired during therapy (data not shown), carcinoma tumors had a greater tendency to shrink during therapy than did sarcomas. This suggests that cell kill may have been a larger factor in carcinomas than in sarcomas, perhaps influencing the histology-specific changes in Cu-ATSM SUV.
We observed significant drops in FLT SUV measures for both histologies during treatment. Other studies have found similar results (18, 19). This reduction in proliferation could be interpreted as radiation-induced DNA damage checkpoint control (28), but it may also represent a drop in cell density. It is interesting to note that FLT uptake decreased significantly in both carcinoma and sarcoma tumors, whereas Cu-ATSM uptake decreased only in carcinoma tumors. If the lower tracer uptake were primarily caused by cell kill, one would have expected that, regardless of histology, if FLT uptake decreased significantly, then Cu-ATSM uptake would have likewise decreased. In addition, we would have expected that tumors with large changes in Cu-ATSM uptake would also experience similarly large changes in FLT uptake (ie, Cu-ATSM response would correlate with FLT response across patients). However, this was not observed: changes in FLT SUV were not correlated with changes in Cu-ATSM SUV (R≈.2, data not shown). This suggests that changes in FLT uptake were driven primarily by functional response rather than by anatomic response.
Limitations
Several of the limitations of this study are addressed in our previous paper involving the same patient cohort (26). Limitations include potential influences from the use of anesthesia and 100% O2 during imaging (29) (although patients were awake and breathing air during the 3-hour Cu-ATSM uptake period) and uncertainties in extrapolating results from canine tumors to human tumors (30). Perhaps the foremost limitation is Cu-ATSM's inconsistent specificity for hypoxia in different tumor types (31). Studies have found certain tumor types to have poor spatial correlations of Cu-ATSM and FMISO uptake patterns, especially with shorter Cu-ATSM uptake periods (32). We used a 3-hour uptake period for Cu-ATSM based on a preliminary analysis we performed in canine patients; we found that Cu-ATSM up-take at 24 hours after injection had higher spatial correlations to Cu-ATSM uptake at 3 hours after injection than at 1 hour after injection (R≈.85; data not shown). Finally, we emphasize that although the tracer distributions were spatially stable early during treatment, tracer distributions at later midtreatment time points are likely to be less stable.
Conclusion
In conclusion, spatial distributions of Cu-ATSM and FLT PET remained mostly stable after a few fractions of IMRT, despite significant decreases in midtreatment SUV measures. Cu-ATSM spatial distributions were significantly more stable than were FLT distributions.
Summary.
There is concern that biological targets for dose painting can change locations over time, compromising the quality of dose painting plans. This study investigated the stability of copper(II)-diacetyl-bis(N4-methylthiosemicarbazone) (Cu-ATSM) and 3′-deoxy-3′-18F-fluorothymidine (FLT) positron emission tomography uptake distributions in canine sinonasal tumors during radiation therapy. We show that Cu-ATSM spatial distributions are very stable during radiation therapy. FLT distributions are generally stable but not as stable as Cu-ATSM distributions.
Table 1.
Results from paired t tests comparing patients' pretreatment and midtreatment SUV measures
| Tracer | SUV measure | Carcinoma (n = 14) | Sarcoma (n = 8) | All patients (N = 22) |
|---|---|---|---|---|
| Cu-ATSM | SUVmean | P=.006 | P=.34 | P=.004 |
| SUVmax | P=.08 | P=.83 | P=.17 | |
| SUVpeak | P=.02 | P=.81 | P=.05 | |
| FLT | SUVmean | P=.02 | P=.008 | P=.003 |
| SUVmax | P=.02 | P=.01 | P=.004 | |
| SUVpeak | P=.04 | P=.02 | P=.01 |
Abbreviations: Cu-ATSM = copper(II)-diacetyl-bis(N4-methylthiosemicarbazone); FLT = 3'-deoxy-3'-18F-fluorothymidine; SUV = standardized uptake value.
Significant values (P≤05; bolded) indicate significant decreases in SUV measures at midtreatment.
Acknowledgments
Supported by R01 CA136927.
Footnotes
Conflict of interest: none.
References
- 1.Chao KS, Ozyigit G, Tran BN, et al. Patterns of failure in patients receiving definitive and postoperative IMRT for head-and-neck cancer. Int J Radiat Oncol Biol Phys. 2003;55:312–321. doi: 10.1016/s0360-3016(02)03940-8. [DOI] [PubMed] [Google Scholar]
- 2.Pucar D, Hricak H, Shukla-Dave A, et al. Clinically significant prostate cancer local recurrence after radiation therapy occurs at the site of primary tumor: Magnetic resonance imaging and step-section pathology evidence. Int J Radiat Oncol Biol Phys. 2007;69:62–69. doi: 10.1016/j.ijrobp.2007.03.065. [DOI] [PubMed] [Google Scholar]
- 3.Ling CC, Humm J, Larson S, et al. Towards multidimensional radiotherapy (MD-CRT): Biological imaging and biological conformality. Int J Radiat Oncol Biol Phys. 2000;47:551–560. doi: 10.1016/s0360-3016(00)00467-3. [DOI] [PubMed] [Google Scholar]
- 4.Hall EJ, Giaccia AJ. Radiobiology for the Radiologist. 6th ed. Lippincott Williams & Wilkins; Philadelphia: 2006. [Google Scholar]
- 5.Nordsmark M, Overgaard M, Overgaard J. Pretreatment oxygenation predicts radiation response in advanced squamous cell carcinoma of the head and neck. Radiother Oncol. 1996;41:31–39. doi: 10.1016/s0167-8140(96)91811-3. [DOI] [PubMed] [Google Scholar]
- 6.Krohn KA, Link JM, Mason RP. Molecular imaging of hypoxia. J Nucl Med. 2008;49(Suppl 2):129S–148S. doi: 10.2967/jnumed.107.045914. [DOI] [PubMed] [Google Scholar]
- 7.Thorwarth D, Eschmann SM, Paulsen F, et al. Hypoxia dose painting by numbers: A planning study. Int J Radiat Oncol Biol Phys. 2007;68:291–300. doi: 10.1016/j.ijrobp.2006.11.061. [DOI] [PubMed] [Google Scholar]
- 8.Chao KS, Bosch WR, Mutic S, et al. A novel approach to overcome hypoxic tumor resistance: Cu-ATSM-guided intensity-modulated radiation therapy. Int J Radiat Oncol Biol Phys. 2001;49:1171–1182. doi: 10.1016/s0360-3016(00)01433-4. [DOI] [PubMed] [Google Scholar]
- 9.Sovik A, Malinen E, Bruland OS, et al. Optimization of tumour control probability in hypoxic tumours by radiation dose redistribution: a modelling study. Phys Med Biol. 2007;52:499–513. doi: 10.1088/0031-9155/52/2/013. [DOI] [PubMed] [Google Scholar]
- 10.Thorwarth D, Alber M. Implementation of hypoxia imaging into treatment planning and delivery. Radiother Oncol. 2010;97:172–175. doi: 10.1016/j.radonc.2010.05.012. [DOI] [PubMed] [Google Scholar]
- 11.Bentzen SM. Theragnostic imaging for radiation oncology: Dose-painting by numbers. Lancet Oncol. 2005;6:112–117. doi: 10.1016/S1470-2045(05)01737-7. [DOI] [PubMed] [Google Scholar]
- 12.Dewhirst MW, Cao Y, Moeller B. Cycling hypoxia and free radicals regulate angiogenesis and radiotherapy response. Nat Rev Cancer. 2008;8:425–437. doi: 10.1038/nrc2397. [DOI] [PMC free article] [PubMed] [Google Scholar]
- 13.Roels S, Slagmolen P, Nuyts J, et al. Biological image-guided radiotherapy in rectal cancer: Is there a role for FMISO or FLT, next to FDG? Acta Oncol. 2008;47:1237–1248. doi: 10.1080/02841860802256434. [DOI] [PubMed] [Google Scholar]
- 14.Nehmeh SA, Lee NY, Schroder H, et al. Reproducibility of intratumor distribution of (18)F-fluoromisonidazole in head and neck cancer. Int J Radiat Oncol Biol Phys. 2008;70:235–242. doi: 10.1016/j.ijrobp.2007.08.036. [DOI] [PMC free article] [PubMed] [Google Scholar]
- 15.Lin Z, Mechalakos J, Nehmeh S, et al. The influence of changes in tumor hypoxia on dose-painting treatment plans based on 18F-FMISO positron emission tomography. Int J Radiat Oncol Biol Phys. 2008;70:1219–1228. doi: 10.1016/j.ijrobp.2007.09.050. [DOI] [PMC free article] [PubMed] [Google Scholar]
- 16.Okamoto S, Shiga T, Yasuda K, et al. High reproducibility of tumor hypoxia evaluated by 18F-fluoromisonidazole PET for head and neck cancer. J Nucl Med. 2013;54:201–207. doi: 10.2967/jnumed.112.109330. [DOI] [PubMed] [Google Scholar]
- 17.Kim JJ, Tannock IF. Repopulation of cancer cells during therapy: An important cause of treatment failure. Nat Rev Cancer. 2005;5:516–525. doi: 10.1038/nrc1650. [DOI] [PubMed] [Google Scholar]
- 18.Vera P, Bohn P, Edet-Sanson A, et al. Simultaneous positron emission tomography (PET) assessment of metabolism with 8F-fluoro-2-deoxy-d-glucose (FDG), proliferation with 8F-fluoro-thymidine (FLT), and hypoxia with 8fluoro-misonidazole (F-miso) before and during radiotherapy in patients with non-small-cell lung cancer (NSCLC): A pilot study. Radiother Oncol. 2011;98:109–116. doi: 10.1016/j.radonc.2010.10.011. [DOI] [PubMed] [Google Scholar]
- 19.Yue J, Chen L, Cabrera AR, et al. Measuring tumor cell proliferation with 18F-FLT PET during radiotherapy of esophageal squamous cell carcinoma: A pilot clinical study. J Nucl Med. 2010;51:528–534. doi: 10.2967/jnumed.109.072124. [DOI] [PubMed] [Google Scholar]
- 20.Everitt S, Hicks RJ, Ball D, et al. Imaging cellular proliferation during chemo-radiotherapy: A pilot study of serial 18F-FLT positron emission tomography/computed tomography imaging for non-small-cell lung cancer. Int J Radiat Oncol Biol Phys. 2009;75:1098–1104. doi: 10.1016/j.ijrobp.2008.12.039. [DOI] [PubMed] [Google Scholar]
- 21.Troost EG, Bussink J, Hoffmann AL, et al. 18F-FLT PET/CT for early response monitoring and dose escalation in oropharyngeal tumors. J Nucl Med. 2010;51:866–874. doi: 10.2967/jnumed.109.069310. [DOI] [PubMed] [Google Scholar]
- 22.Kubicek LN, Seo S, Chappell RJ, Jeraj R, Forrest LJ. Helical tomotherapy setup variations in canine nasal tumor patients immobilized with a bite block. Vet Radiol Ultrasound. 2012;53:474–481. doi: 10.1111/j.1740-8261.2012.01947.x. [DOI] [PMC free article] [PubMed] [Google Scholar]
- 23.Yang D, Brame S, El Naqa I, et al. Technical note: DIRART—A software suite for deformable image registration and adaptive radiotherapy research. Med Phys. 2011;38:67–77. doi: 10.1118/1.3521468. [DOI] [PMC free article] [PubMed] [Google Scholar]
- 24.McCall KC, Barbee DL, Kissick MW, Jeraj R. PET imaging for the quantification of biologically heterogeneous tumours: Measuring the effect of relative position on image-based quantification of dose-painting targets. Phys Med Biol. 2010;55:2789–2806. doi: 10.1088/0031-9155/55/10/001. [DOI] [PMC free article] [PubMed] [Google Scholar]
- 25.Nyflot MJ, Harari PM, Yip S, Perlman SB, Jeraj R. Correlation of PET images of metabolism, proliferation and hypoxia to characterize tumor phenotype in patients with cancer of the oropharynx. Radiother Oncol. 2012;105:36–40. doi: 10.1016/j.radonc.2012.09.012. [DOI] [PMC free article] [PubMed] [Google Scholar]
- 26.Bradshaw TJ, Bowen SR, Jallow N, Forrest LJ, Jeraj R. Heterogeneity in intratumor correlations of 18F-FDG, 18F-FLT, and 61Cu-ATSM PET in canine sinonasal tumors. J Nucl Med. 2013;54:1931–1937. doi: 10.2967/jnumed.113.121921. [DOI] [PMC free article] [PubMed] [Google Scholar]
- 27.Murata R, Shibamoto Y, Sasai K, et al. Reoxygenation after single irradiation in rodent tumors of different types and sizes. Int J Radiat Oncol Biol Phys. 1996;34:859–865. doi: 10.1016/0360-3016(95)02155-8. [DOI] [PubMed] [Google Scholar]
- 28.Iliakis G, Wang Y, Guan J, et al. DNA damage checkpoint control in cells exposed to ionizing radiation. Oncogene. 2003;22:5834–5847. doi: 10.1038/sj.onc.1206682. [DOI] [PubMed] [Google Scholar]
- 29.Kersemans V, Cornelissen B, Hueting R, et al. Hypoxia imaging using PET and SPECT: the effects of anesthetic and carrier gas on [Cu]-ATSM, [Tc]-HL91 and [F]-FMISO tumor hypoxia accumulation. PLoS One. 2011;6:e25911. doi: 10.1371/journal.pone.0025911. [DOI] [PMC free article] [PubMed] [Google Scholar]
- 30.Hansen K, Khanna C. Spontaneous and genetically engineered animal models: use in preclinical cancer drug development. Eur J Cancer. 2004;40:858–880. doi: 10.1016/j.ejca.2003.11.031. [DOI] [PubMed] [Google Scholar]
- 31.Dilworth JR, Hueting R. Metal complexes of thiosemicarbazones for imaging and therapy. Inorganica Chimica Acta. 2012;389:3–15. [Google Scholar]
- 32.O'Donoghue JA, Zanzonico P, Pugachev A, et al. Assessment of regional tumor hypoxia using 18F-fluoromisonidazole and 64Cu(II)-diacetyl-bis(N4-methylthiosemicarbazone) positron emission tomography: Comparative study featuring microPET imaging, Po2 probe measurement, autoradiography, and fluorescent microscopy in the R3327-AT and FaDu rat tumor models. Int J Radiat Oncol Biol Phys. 2005;61:1493–1502. doi: 10.1016/j.ijrobp.2004.12.057. [DOI] [PubMed] [Google Scholar]


