Abstract
Introduction
The aim of this study was to explore the relationships between TregFoxP3+ cells and Th17 cells and occurrence of lung cancer.
Material and methods
The proportions of TregFoxP3+ and Th17 cells, the expression of FoxP3 and RORγt mRNA, and the levels of related cell factors such as transforming growth factor-β (TGF-β), interleukin IL-17 (IL-17) and IL-23 were determined respectively by flow cytometry analysis, real-time-polymerase chain reaction (PCR), and ELISA in peripheral blood of 18 healthy people and 26 patients with non-small cell lung cancer (NSCLC).
Results
The levels of TregFoxP3+ and Th17, expression of FoxP3 and RORγt mRNA, and ratios of TregFoxP3+/Th17 and FoxP3/RORγt in peripheral blood with NSCLC were higher than those in healthy controls (p < 0.05). The proportion of Th17 cells from NSCLC patients was positively correlated with that of TregFoxP3+ (r = 0.81, p < 0.05). The receiver-operating characteristic (ROC) curve demonstrates that the increased level of TregFoxP3+/Th17 in the peripheral blood may be a useful indicator in early diagnosis of non-small cell lung carcinoma. The TregFoxP3+/Th17 and FoxP3/RORγt levels for patients in stage IV were higher than those of patients in stages I, II, and III (p < 0.05). The levels of TGF-β, IL-17, and IL-23 were higher in NSCLC patients than those in healthy controls.
Conclusions
The results suggest that ratios of Treg/Th17 correlate with the stage of NSCLC.
Keywords: carcinoma, non-small cell lung, TregFoxP3+, RORγt, Th17
Introduction
Non-small cell lung cancer (NSCLC) accounts for 80–85% of lung cancer cases. However, surgery, radiotherapy and chemotherapy treatment are not satisfactory because the immunity is inhibited to some extent in patients with NSCLC. The inhibition degree is closely related to tumor progression and prognosis. Non-small cell lung cancer patients often have immunosuppression, which leads to Th1/Th2 imbalance and Th2 drift, affecting anti-tumor immunity [1–3]. Regulatory T cells may contribute to this imbalance and may redirect immunity towards Th2. The cell differentiation pathways and immune effector mechanisms of Treg and Th17 are similar to Th1 and Th2. Therefore, it is important to explore whether there is Treg and Th17 imbalance and its regulatory mechanism of tumor immunity in NSCLC.
CD4+ T cells play a key role in immune regulation, including Th1, Th2, Th17 and Treg cells. Treg expresses a variety of surface molecules. Although FoxP3 is not a superficial molecule, FoxP3 is widely recognized as a specific marker of Treg cells [4, 5]. TregFoxP3 inhibits effector T cell proliferation, proinflammatory cytokine production and antibody secretion. It is of great importance in the prevention of autoimmune responses and maintenance of immune balance. Natural Treg cell (nTreg) mediates peripheral tolerance and induces Treg (iTreg) to inhibit inflammation. It is reported that high expression of nTreg in peripheral blood may be associated with anti-tumor immunity block. The iTreg increase is of anti-inflammatory effect. Both iTreg and nTreg contribute to the tumor tolerance [6]. Th17 regulates expression and secretion of effect factor interleukin-17 (IL-17), and is related to occurrence and development of inflammatory and autoimmune diseases. Further, it is shown that IL-6 promotes naive T cells to express high IL-17, and mediates Treg into Th17. TregFoxP3 promotes differentiation of Th17 cell through the secretion of transforming growth factor-β (TGF-β). It is shown that the proportion of TregFoxP3 and Th17 in CD4+ T cells increases in patients with tumors. Though they both increase, it is found in mouse models that TregFoxP3 increases more significantly than Th17 [7].
It was shown recently that TregFoxP3+ maintains immune tolerance in cancer patients. Th17 is a newly found cell group that participates in autoimmune diseases, cancer, inflammation, and transplant rejection [8]. In this study, the proportion of TregFoxP3+ and Th17, mRNA expression and related cell factor levels of FoxP3 and RORγt in peripheral blood of NSCLC patients were detected, in order to explore their regulatory effects in tumor development and immune response.
Material and methods
Samples
Twenty-six NSCLC patients (diagnosed in the same hospital and confirmed by pathological examination) from January 2011 to December 2011 were enrolled in this study. Peripheral blood was taken before surgery with heparin anticoagulant. According to the TNM classification for NSCLC (American Joint Cancer Committee, AJCC), patients were divided into two groups. Patients with stage I, II and III NSCLC were the early-mid group. And those with stage IV NSCLC were the advanced group. Fifteen patients had squamous carcinoma and 11 patients had adenocarcinoma, according to the WHO classification criteria. None of the enrolled patients had received radiotherapy or other immunotherapy previously and they did not have any immune-related disease. For the healthy control group, 18 healthy individuals were selected randomly from the Department of Physical Examination in Qianfoshan Hospital, Shandong Province. All the healthy individuals did not receive immunotherapy and did not have autoimmune disease history. The characteristics of the patients are summarized in Table I. Conduct of clinical trials for this study was approved by the Medical Ethical Committee of Qianfoshan Hospital. All participants signed the informed consent.
Table I.
Clinical data of the healthy control group and the NSCLC group
| Parameter | Healthy control group (n = 18) | NSCLC group (n = 26) |
|---|---|---|
| Age ( ± s) | 54.2 ±5.4 | 56.4 ±4.7 |
| Gender (male/female) | 12/6 | 17/9 |
| Histological classification: | ||
| Squamous carcinoma | – | 15 |
| Adenocarcinoma | – | 11 |
| TNM stage: | ||
| I–II | – | 6 |
| III | – | 12 |
| IV | – | 8 |
Antibodies, reagents and equipments
Anti-Human-CD4-FITC, anti-Human-CD25-PE, anti-Human-IL-17A-APC, anti-Human-FoxP3-APC and anti-Mouse-IgG1-APC were purchased from eBioscience (San Diego, CA, USA).
Phorbol-12-myristate-13-acetate (PMA), ionomycin (Ion) and monensin were purchased from Sigma (St. Louis, MO, USA). The Foxp3 Staining Buffer Set and Fixation/Permeabilization were also obtained from eBioscience. RPMI-1640 cell culture medium was purchased from Hyclone (Utah, USA). Trizol, PrimeScript RT reagent Kit with gDNA and SYBR Premix Ex Taq (Tli RNaseH Plus) were purchased from TaKaRa, Japan. Anti-human TGF-β, IL-17, IL-23 ELISA kit was purchased from Hangzhou Unitech Biological Technology Co., Ltd.
The Beckman Coulter Epics XL-4-type flow cytometer was purchased from Beckman, High Wycombe, USA. The ABI PRISM 7300 Real-Time PCR System was purchased from Applied Biosystems Inc, California, USA. The SPECTRA MAX190 microplate reader was purchased from MD, Northern California, USA.
Isolation of peripheral blood mononuclear cells
Peripheral blood (4 ml) with heparin was diluted by adding an equal amount of PBS. Then the diluted peripheral blood was added into the liquid surface of the lymphocyte separation buffer slowly along the wall of the centrifuge tube, followed by centrifugation at 2000 rpm for 20 min until the cells were layered. The middle layer was carefully transferred to a 15 ml centrifuge tube, with addition of 5-fold volume of PBS buffer. After mixing, centrifugation at 1500 rpm for 10 min was performed. The supernatant was discarded and the precipitation was peripheral blood mononuclear cells (PBMCs). The cell number was adjusted to a concentration of 2 × 10⁶/ml.
Th17 cell labeling
Peripheral blood mononuclear cells (1 ml) were seeded onto a 24-well cell culture plate. Then cells were cultured in 1640 medium supplemented with 10% fetal bovine serum at 37°C with 5% CO2. Stimulus reagents PMA (50 ng/ml), ionomycin (1 µg/ml) and monensin (2 µg/ml) were also added. Cells were cultured in the stimulus medium for 5 h before they were collected by centrifugation. Then cells were resuspended in 100 µl PBS buffer and incubated with FITC-labeled anti-human CD4 antibody in the dark for 30 min. After fixation and permeabilization, APC-labeled anti-human IL-17A and mouse IgG1 isotype-APC antibodies were added and incubated for 30 min. After washing, cells were resuspended in PBS before cytometric analysis.
TregFoxp3+ cell labeling
Peripheral blood mononuclear cells (1 ml) were centrifuged, resuspended in 100 µl PBS buffer and incubated with FITC-labeled anti-human CD4 and PE-labeled anti-human CD25 antibodies at room temperature in the dark for 30 min. After fixation and permeabilization, APC-labeled anti-FoxP3 and mouse IgG1 isotype-APC antibodies were added and incubated at room temperature in the dark for 30 min. After washing, cells were resuspended in PBS before cytometric analysis.
Flow cytometric analysis of Th17 cells and TregFoxp3+ cells
After proper labeling, peripheral blood TregFoxP3+ cells were detected by CD4+ CD25+ gating and Th17 cells by IL-17A+ gating. The proportion of CD4+ CD25+ FoxP3+ cell subsets in CD4+ cell subsets and the percentage of IL-17A+ cell subsets in CD4+ cell subsets were analyzed respectively.
Quantitative real-time-polimerase chain reaction
Peripheral blood mononuclear cells were isolated as described above. Total RNA was extracted by Trizol. Then the RNA was reversed transcribed to form cDNA. The PCR procedures for the reverse transcription were 42°C for 2 min, 37°C for 15 min, 85°C for 5 s. Quantitative real-time RT-PCR was conducted using an ABI PRISM 7500 Real-Time PCR System. The PCR conditions were initial template denaturation at 95°C for 30 s, then 40 cycles of 95°C for 5 s, 60°C for 31 s, 72°C for 90 s, and a final extension at 72°C for 5 min. β-Actin was used as an internal control. Sequences of primer pairs used in this experiment were summarized in Table II.
Table II.
Primer sequences for real-time quantitative PCR
| Primer name | Primer sequences | Product length [bp] |
|---|---|---|
| FoxP3 | Forward: 5’-CTGGCAAATGGTGTCTGCAAGT-3’ Reverse: 5’-CTGCCCTTCTCATCCAGAAGATG-3’ |
107 |
| RORγt | Forward: 5’-CTGCAAGACTCATCGCCAAAG-3’ Reverse: 5’-TTTCCACATGCTGGCTACACA-3’ |
83 |
| β-Actin | Forward: 5’-TGACGTGGACATCCGCAAAG-3’ Reverse: 5’-CTGGAAGGTGGACAGCGAGG -3’ |
205 |
Serum TGF-β, IL-17, IL-23 level detection by ELISA
Experiments were performed according to the instructions of the anti-human TGF-β, IL-17 and IL-23 ELISA kit. Briefly, 50 µl of sample dilution buffer, 50 µl of standard sample, 50 µl of sample and 50 µl of antibodies were added to each well and incubated for 3 h. After washing, 100 µl of peroxidase were added and incubated for 45 min, followed by another washing. Chromogenic substrate was added and then the terminated buffer was added. The OD value at 450 nm and 570 nm was measured and the concentration of the test sample was calculated accordingly.
Statistical analysis
SPSS 18.0 software, two samples independent t-test, nonparametric rank sum test and linear correlation analysis were used for statistical analysis. The results were expressed as ± s. A value of p of less than 0.05 was considered statistically significant.
Results
The level of TregFoxP3+ cells and Th17 cells and the ratio of TregFoxP3+/Th17 are elevated in the peripheral blood of NSCLC patients
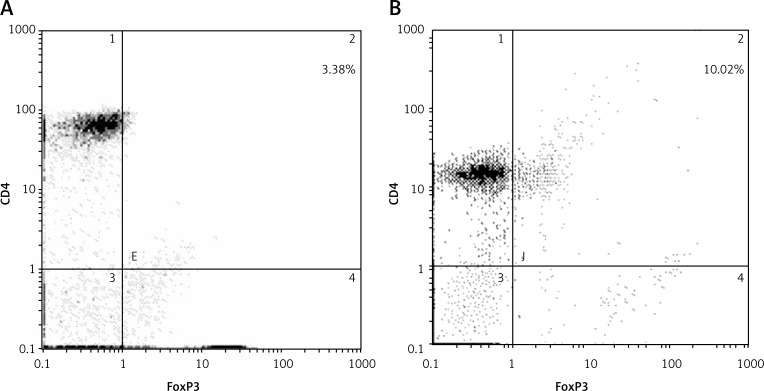
To find out whether there is an imbalanced level of TregFoxP3+ cells and Th17 cells in NSCLC patients, we first analyzed the levels of TregFoxP3+ cells and Th17 cells and their ratio in peripheral blood of NSCLC patients compared with healthy controls. The cells were analyzed by flow cytometry and the results are shown in Figure 1 and Figure 2. The proportion of TregFoxP3+ cells in CD4+ cells in the healthy control group and NSCLC group were 3.38% (Figure 1A) and 10.02% (Figure 1B) respectively. The percentage of Th17 cells in CD4+ cells in the healthy control group and NSCLC group were 2.13% (Figure 2A) and 5.07% respectively (Figure 2B). Statistically the proportions of TregFoxP3+ and Th17 cells in the peripheral blood of the 26 NSCLC patients were significantly higher than those in the peripheral blood of the healthy control group (p < 0.05). Also the ratio of TregFoxP3+/Th17 of the NSCLC patients was higher than that of the healthy control group. The difference was statistically significant (p < 0.05) (Table III). These data indicate that in the peripheral blood of patients with NSCLC, the TregFoxp3 + Th17 cells account for a higher proportion of mononuclear cells.
Figure 1.
Proportions of TregFoxP3+ in the healthy control group (A) and the NSCLC group (B). Isolated PBMCs were labeled by anti-CD4, anti-CD25 and anti-FoxP3 antibodies before cytometric analysis. Representative flow cytometric results are shown. The cells positive for CD4 and FoxP3 were gated (upper right quadrant). Experiments were conducted three times. A p value of less than 0.05 was considered statistically significant
Figure 2.
Proportions of Th17 in the healthy control group (A) and the NSCLC group (B). Isolated PBMCs were labeled by anti-CD4 and anti-Th17A antibodies before cytometric analysis. Representative flow cytometric results are shown. The cells positive for CD4 and Th17A were gated (upper right quadrant). Experiments were conducted three times. A p value of less than 0.05 was considered statistically significant
Table III.
Proportions of TregFoxP3+ and Th17 ( ± s,%) and the TregFoxP3+/Th17 ratio of the healthy control group and the NSCLC group
| Variable | Healthy control group (n = 18) | NSCLC group (n = 26) | Value of p |
|---|---|---|---|
| TregFoxP3+ | 3.65 ±0.97 | 7.02 ±2.41 | < 0.05 |
| Th17 | 2.21 ±0.64 | 3.61 ±0.82 | < 0.05 |
| TregFoxP3+/Th17 | 1.54 ±0.45 | 1.92 ±0.51 | < 0.05 |
The expression level of FoxP3 mRNA and RORγt mRNA and the ratio of FoxP3/RORγt are elevated in the peripheral blood of NSCLC patients
FoxP3 and RORγt are lineage-defining transcription factors for Treg and Th17 respectively. To further verify the higher level of Treg and Th17 in the peripheral blood of patients with NSCLC at the gene level, we next checked the expression of FoxP3 mRNA and RORγt mRNA. As revealed by real-time quantitative PCR results (Table IV), in the PBMCs of NSCLC patients, the FoxP3 and RORγt mRNA expression levels were 4.31 ±0.71% and 1.38 ±0.56% respectively, while in the healthy control group, the FoxP3 and RORγt mRNA expression levels were 0.68 ±0.16% and 0.43 ±0.14% respectively. Statistically the FoxP3 and RORγt mRNA expression levels in the PBMCs of NSCLC patients were significantly higher than those in the healthy control group (p < 0.05). Similarly, the FoxP3/RORγt ratio in the NSCLC group (2.37 ±0.48%) was higher than in the healthy control group (0.51 ±0.12%). There was a significant difference between the two groups (p < 0.05). These results are consistent with the cytometric results and further confirm the higher proportion of TregFoxp3+ Th17 cells in the peripheral blood of patients with NSCLC.
Table IV.
Level of FoxP3 and RORγt mRNA ( ± s,%) and FoxP3/RORγt ratio of the healthy control group and the NSCLC group
| Variable | Healthy control group (n = 18) | NSCLC group (n = 26) | Value of p |
|---|---|---|---|
| FoxP3 | 0.68 ±0.16 | 4.31 ±0.71 | < 0.05 |
| RORγt | 0.43 ±0.14 | 1.38 ±0.56 | < 0.05 |
| FoxP3/RORγt | 0.51 ±0.12 | 2.37 ±0.48 | < 0.05 |
TregFoxP3+ cells and Th17 cells are positively linearly correlated in the peripheral blood of NSCLC patients
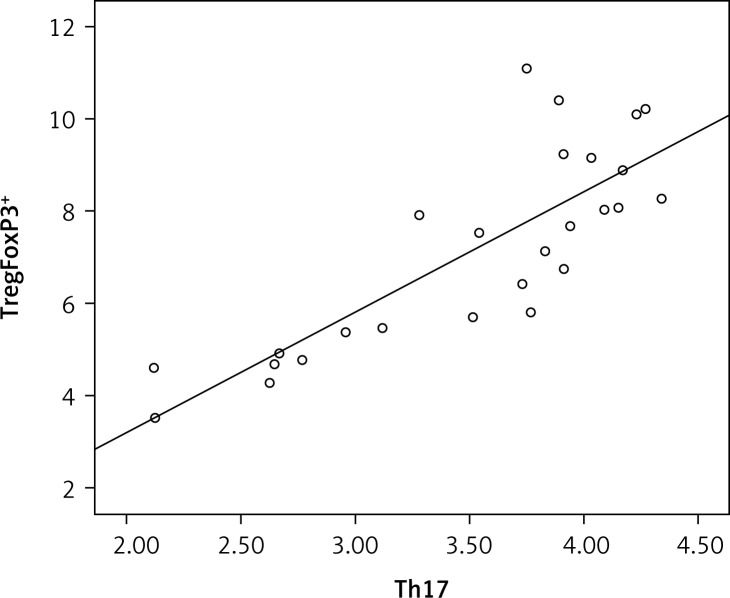
To address the issue of whether TregFoxP3+ cells and Th17 cells are correlated, the linear correlation method was used. As shown in Figure 3, there was a strong positive linear correlation between the TregFoxP3+ cells and Th17 cells (r = 0.81, r2 = 0.674, p < 0.05). These data reveal that a TregFoxP3+/Th17 imbalance exists in NSCLC patients.
Figure 3.
TregFoxP3 + and Th17 correlation analysis in NSCLC patients. The linear correlation method was used. The sign and the absolute value of a correlation coefficient describe the direction and the magnitude of the relationship between two variables. The value of a correlation coefficient ranges between –1 and 1. The greater the absolute value of a correlation coefficient, the stronger the linear relationship. In our study the correlation coefficient (r) between TregFoxP3 + and Th17 was 0.81
The performance of TregFoxP3+/Th17 ratio as a diagnostic indicator of NSCLC by ROC curve
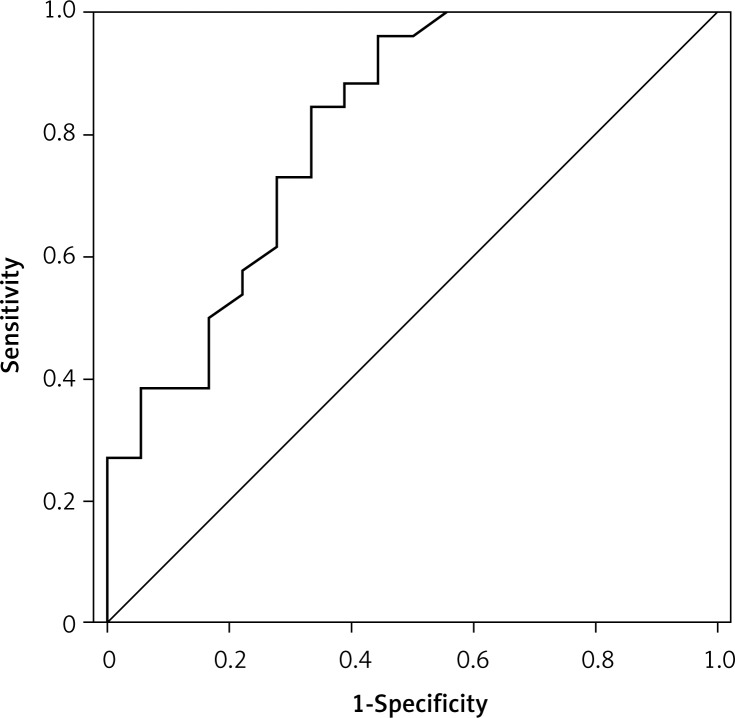
A receiver operating characteristic (ROC) curve analysis is a useful method for diagnostic decision making. To evaluate the performance of TregFoxP3+/Th17 ratio as an NSCLC diagnostic indicator and to assess its clinical significance, we examined the TregFoxP3+/Th17 ratio of 26 NSCLC patients and 18 healthy people by ROC curve analysis. As shown in Figure 4, the area under the ROC curve (AUC) was 0.809 (p = 0.001). The best diagnostic critical value was 1.695. The sensitivity and specificity were 0.846 and 0.667 respectively. This indicates that the TregFoxP3+/Th17 ratio may be a useful indicator of early diagnosis of NSCLC.
Figure 4.
Receiver-operating characteristic (ROC) curve analysis to assess the performance of Treg- FoxP3+/Th17 in the diagnosis of non-small cell lung carcinoma. The TregFoxP3+/Th17 ratio was used as an indicator variable. The ROC curve was constructed by plotting the true positive rate (sensitivity) and false positive rate (specificity) associated with each unique value of TregFoxP3+/Th17 ratio. An indicator variable with high discriminatory ability will have a curve with an AUC near 1, and an indicator variable with low discriminatory ability will have an AUC near 0.5. In this study, the AUC was 0.809
TregFoxP3+/Th17 ratio was different among NSCLC patients with different TNM staging
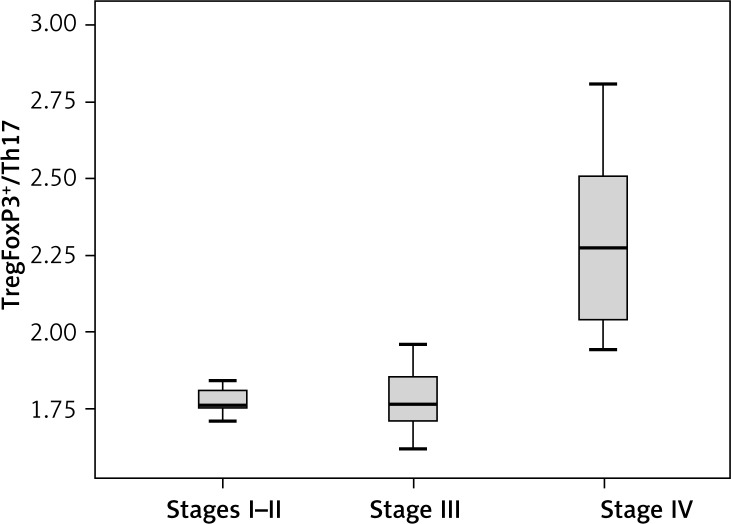
To check whether the TregFoxP3+/Th17 ratio is imbalanced in NSCLC patients, we compared the TregFoxP3+/Th17 ratio in different TNM staging NSCLC patients. The non-parametric rank sum test was used. In the 26 NSCLC patients, 6 cases were at stage I–II, 12 cases were at stage III and 8 cases were at stage IV. The results showed that the TregFoxP3+/Th17 ratio in stage IV NSCLC patients was significantly higher than that in stage I–II and stage III NSCLC patients (p < 0.05) (Figure 5).
Figure 5.
TregFoxP3+/Th17 among different TNM stages in NSCLC patients. The non-parametric rank sum test was conducted. According to TNM staging, 6 patients in stage I–II, 12 patients in stage III and 8 patients in stage IV were enrolled in this analysis. Experiments were performed three times. A p value of less than 0.05 was considered statistically significant
FoxP3/RORγt ratio was different among NSCLC patients with different TNM staging
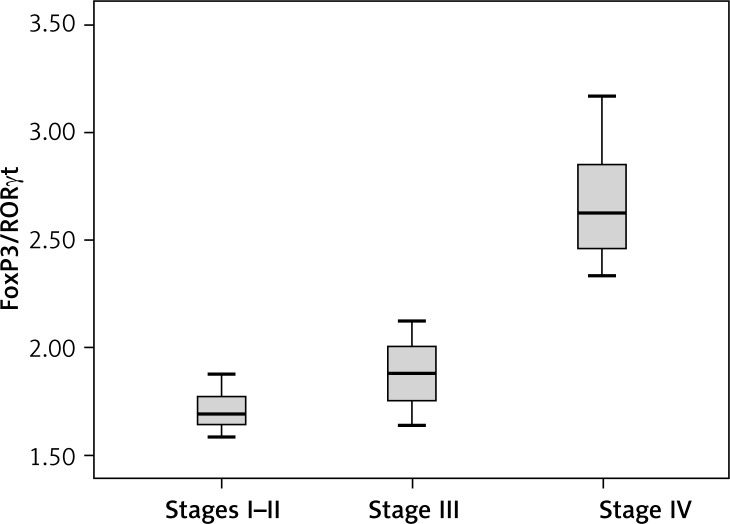
Furthermore, to check whether the FoxP3/RORγt ratio is also imbalanced in NSCLC patients, we next compared the FoxP3/RORγt ratio in NSCLC patients with different TNM staging. We used the non-parametric rank sum test. In the 26 NSCLC patients, 6 cases were at stage I–II, 12 cases were at stage III and 8 cases were at stage IV. As shown in Figure 6, the FoxP3/RORγt ratio in stage IV NSCLC patients was significantly higher than that in stage I–II and stage III NSCLC patients (p < 0.05). This result was similar to that of the TregFoxP3+/Th17 ratio, suggesting that the imbalance in stage IV NSCLC patients was more significant.
Figure 6.
FoxP3/RORγt among different TNM stages in NSCLC patients. The non-parametric rank sum test was conducted. According to TNM staging, 6 patients in stage I–II, 12 patients in stage III and 8 patients in stage IV were enrolled in this analysis. Experiments were performed three times. A p value of less than 0.05 was considered statistically significant
ELISA detection of expression levels of TGF-β, IL-17 and IL-23 in the serum of patients with NSCLC
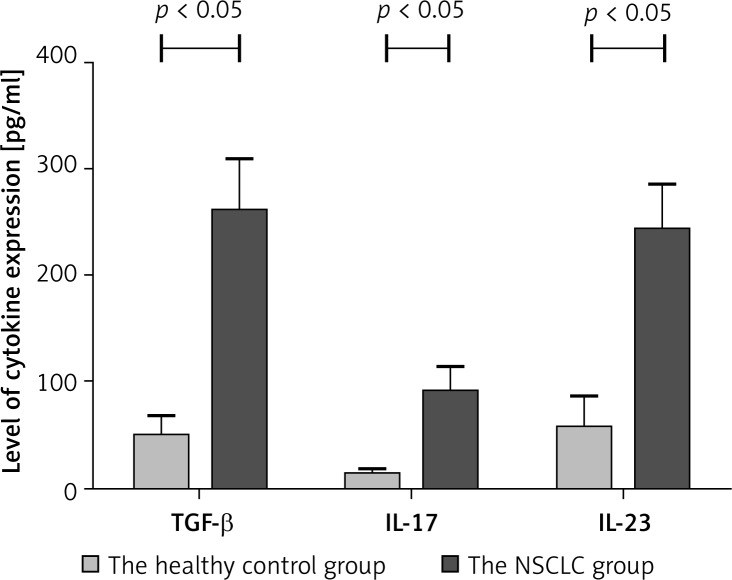
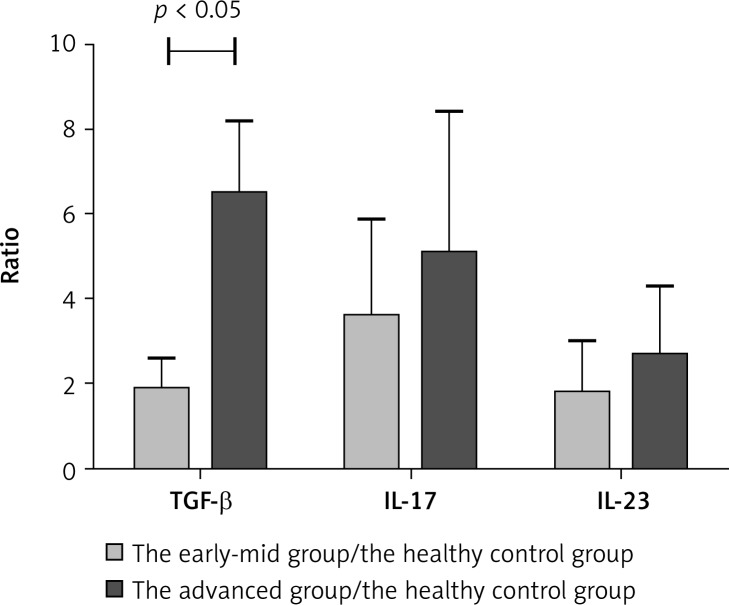
Transforming growth factor-β expression is relevant with TregFoxP3+ cells. Interleukin-17 and IL-23 expression is associated with Th17 cells. Th17 cells secrete IL-17 and their expansion is regulated by IL-23. TregFoxP3+/Th17 imbalance in NSCLC patients may be related to the regulation of both cytokines. Therefore we detected the expression levels of TGF-β, IL-17 and IL-23 in the serum of patients with NSCLC by ELISA. In the serum of NSCLC patients, expression levels of TGF-β, IL-17 and IL-23 were higher than those in the healthy control group (Figure 7). There was a significant difference (p < 0.05). Also we compared the expression levels TGF-β, IL-17 and IL-23 in the early-mid group, the advanced group and the healthy control group. As shown in Figure 8, the TGF-β level in the early-mid group and the advanced group was significantly higher than the healthy control group (p < 0.05), while the difference in the IL-17 and IL-23 level was not significant among the three groups.
Figure 7.
The level of TGF-β, IL-17 and IL-23 in the serum of the healthy control group and the NSCLC group ( ± s, pg/ml). ELISA assay was performed to detect the expression levels of TGF-β, IL-17 and IL-23. Experiments were performed three times and the data were expressed as ± s. A p value of less than 0.05 was considered statistically significant
Figure 8.
The ratio of TGF-β, IL-17 and IL-23 in the early-mid group/healthy control group and the advanced stage group/healthy group. The relative level of TGF-β, IL-17 and IL-23 was compared between the early-mid group and the healthy control group; and between the advanced stage group and the healthy group. Experiments were performed three times. A p value of less than 0.05 was considered statistically significant
Discussion
In vitro studies have shown that Treg cells can induce immune tolerance against tumor-specific antigens and affect the activation and proliferation of CD4+ T cells through the secretion of inhibitory cytokines IL-10 and TGF-β [9]. Transforming growth factor-β is mainly involved in the induction, maintenance and function of TregFoxP3 cells [10, 11]. Also TGF-β plays an important role in immunosuppression through inhibition of killer T cell maturation and macrophage activation [5, 12, 13].
Initially, IL-23 was considered to be required for the induction and differentiation of Th17 cells. Langrish et al. found that in p19 gene defective mice (p19–/– mice), in which the expression of IL-23 was deficient, Th17 cells could be generated normally [14]. However, the survival of Th17 cells was seriously affected. On the other hand, further studies found that IL-23 can not only promote the function of Th17 cells but also can recruit Th17 cells to sites of inflammation [15, 16]. Furthermore, in vivo data showed that IL-23 participated in the Th17 cell mediated immune response against bacterial infections and in Th17 cell mediated chronic inflammation in disease [17, 18].
Our results showed that, compared with the healthy control group, the proportion of TregFoxP3+ cells and Th17 cells, the expression levels of FoxP3 mRNA and RORγt mRNA, the TregFoxP3+/Th17 ratio and the FoxP3/RORγt ratio were significantly higher in the peripheral blood of the NSCLC patients. These data suggest that TregFoxP3+ cells and Th17 cells account for a higher proportion in the peripheral blood mononuclear cells of patients with NSCLC. TregFoxP3+ cells were positively linearly correlated with Th17 cells. The ROC curves showed that the TregFoxP3+/Th17 ratio may be a useful indicator for early diagnosis of NSCLC. So far there are no reports indicating the TregFoxP3+/Th17 ratio as an early diagnosis indicator. However, in our study the AUC in the ROC curve was 80.5%, making the TregFoxP3+/Th17 ratio valuable for diagnosis. The NSCLC patients in stage IV had a significantly higher ratio of TregFoxP3+/Th17 and FoxP3/RORγt than patients in stage I–II and stage III. This suggests that the ratios of Treg/Th17 in NSCLC patients correlate with TNM staging of NSCLC. With the progression of NSCLC, the induction of Treg cells is strongly promoted while the induction of Th17 cells is relatively weak. The expression of cytokines was also elevated in NSCLC patients. Compared with the healthy control group, the expression levels of TGF-β, IL-17 and IL-23 in the serum of NSCLC patients were significantly higher. The Treg cell related TGF-β level in the early-mid group and the advanced group was significantly higher than the healthy control group, while there was no significant difference in the expression levels of the Th17 cell related cytokine IL-17 and IL-23 among the three groups. These results indicate that TGF-β participates in the positive feedback regulation during Treg differentiation and plays an important role in immunosuppression. Also the weak induction of Th17 cells in advanced lung cancer may be caused by the limited expression of IL-17 and IL-23. In fact, in advanced lung cancer, tumor cells secreted a large number of cytokines, forming the immune tolerance environment to favor the growth of cancer cells. It is possible that these cytokines suppressed the expression of inflammatory cytokines such as IL-17, IL-23 and IL-6, resulting in the inhibited expression of Th17 cells in advanced NSCLC [19].
Taken together, we speculate that TregFoxP3+ can change the micro-environment of the immune response, leading to aggravated immunosuppression and further promoting the proliferation and metastasis of tumor cells. On the other hand, in advanced NSCLC, strong expression of TregFoxP3+ cells competitively inhibited the differentiation of Th17 cells [20–22], weakening the inflammatory response that inhibits tumor growth and at the same time promoting the immune tolerance environment suifor tumor growth. In summary, to a certain extent, the expression levels of TregFoxP3+ cells and Th17 cells reflect the invasion and the metastasis of lung cancer and its ability to escape immune surveillance. Further studies on this will be beneficial and valuable for the early diagnosis and prognosis of NSCLC.
References
- 1.Ghayumi MA, Mojtahedi Z, Fattahi MJ, Fattahi MJ. Th1 and Th2 cytokine profiles in malignant pleural effusion. Iran J Immunol. 2011;8:195–200. [PubMed] [Google Scholar]
- 2.Shao Q, Ning H, Lv J, et al. Regulation of Th1/Th2 polarization by tissue inhibitor of metalloproteinase-3 via modulating dendritic cells. Blood. 2012;119:4636–44. doi: 10.1182/blood-2011-08-376418. [DOI] [PubMed] [Google Scholar]
- 3.Li J, Diao H, Zhao D, et al. Reduced tumourigenicity of EG7 after RANTES gene transfer and the underlying mechanism. Arch Med Sci. 2010;6:829–36. doi: 10.5114/aoms.2010.19287. [DOI] [PMC free article] [PubMed] [Google Scholar]
- 4.Chen D, Huang X, Yang M, Gan H, Gunawan EJ, Tang W. Treg/Th17 Functional disequilibrium in Chinese uremia on hemodialysis: a link between calcification and cardiovascular disease. Renal Failure. 2012;34:697–702. doi: 10.3109/0886022X.2012.672155. [DOI] [PubMed] [Google Scholar]
- 5.Fu HY, Li C, Yang W, et al. FOXP3 and TLR4 protein expression are correlated in non-small cell lung cancer: implications for tumor progression and escape. Acta Histochem. 2013;115:151–7. doi: 10.1016/j.acthis.2012.06.002. [DOI] [PubMed] [Google Scholar]
- 6.Wang W, Hodkinson P, McLaren F, et al. Small cell lung cancer tumour cells induce regulatory T lymphocytes, and patient survival correlates negatively with FOXP3+ cells in tumour infiltrate. Int J Cancer. 2012;131:E928–37. doi: 10.1002/ijc.27613. [DOI] [PubMed] [Google Scholar]
- 7.Maruyama T, Kono K, Mizukami Y, et al. Distribution of Th17 cells and FoxP3(+) regulatory T cells in tumor-infiltrating lymphocytes, tumor-draining lymph nodes and peripheral blood lymphocytes in patients with gastric cancer. Cancer Sci. 2010;101:1947–54. doi: 10.1111/j.1349-7006.2010.01624.x. [DOI] [PMC free article] [PubMed] [Google Scholar]
- 8.Kesselring R, Thiel A, Pries R, et al. Human Th17 cells can be induced through head and neck cancer and have a functional impact on HNSCC development. Br J Cancer. 2010;103:1245–54. doi: 10.1038/sj.bjc.6605891. [DOI] [PMC free article] [PubMed] [Google Scholar]
- 9.Kim C, Cadet P. Environmental toxin 4-nonylphenol and autoimmune diseases: using DNA microarray to examine genetic markers of cytokine expression. Arch Med Sci. 2010;3:321–7. doi: 10.5114/aoms.2010.14250. [DOI] [PMC free article] [PubMed] [Google Scholar]
- 10.Ciebiada M, Kasztalska K, Gorska-Ciebiada M, Barylski M, Gorski P. Expression of IL-7 receptor in human peripheral regulatory T cells. Arch Med Sci. 2013;9:555–60. doi: 10.5114/aoms.2012.31387. [DOI] [PMC free article] [PubMed] [Google Scholar]
- 11.Shimizu K, Nakata M, Hirami Y, Yukawa T, Maeda A, Tanemoto K. Tumor-infiltrating Foxp3+ regulatory T cells are correlated with cyclooxygenase-2 expression and are associated with recurrence in resected non-small cell lung cancer. J Thorac Oncol. 2010;5:585–90. doi: 10.1097/JTO.0b013e3181d60fd7. [DOI] [PubMed] [Google Scholar]
- 12.Lord JD, Hackman RC, Gooley TA, et al. Blood and gastric FOXP3+ T cells are not decreased in human gastric graft-versus-host disease. Biol Blood Marrow Transplant. 2011;17:486–96. doi: 10.1016/j.bbmt.2010.09.015. [DOI] [PMC free article] [PubMed] [Google Scholar]
- 13.Kulach A, Dabek J, Wilczok T, et al. Changes in transforming growth factor beta; and its receptors'mRNA expression in monocytes from patients with acute coronary syndromes. Arch Med Sci. 2010;5:526–38. doi: 10.5114/aoms.2010.14463. [DOI] [PMC free article] [PubMed] [Google Scholar]
- 14.Veldhoen M, Hocking RJ, Atkins CJ, Locksley RM, Stockinger B. TGF-beta in the context of an inflammatory cytokine Milieu supports de novo differentiation of IL17-producing T vells. Immunity. 2006;24:179–83. doi: 10.1016/j.immuni.2006.01.001. [DOI] [PubMed] [Google Scholar]
- 15.Teng MW, von Scheidt B, Duret H, Towne JE, Smyth MJ. Anti-IL-23 monoclonal antibody synergizes in combination with targeted therapies or IL-2 to suppress tumor growth and metastases. Cancer Res. 2011;71:2077–86. doi: 10.1158/0008-5472.CAN-10-3994. [DOI] [PubMed] [Google Scholar]
- 16.Hirota K, Duarte JH, Veldhoen M, et al. Fate mapping of IL-17-producing T cells in inflammatory responses. Nature Immunol. 2011;12:255–63. doi: 10.1038/ni.1993. [DOI] [PMC free article] [PubMed] [Google Scholar]
- 17.Martin-Orozco N, Muranski P, Chung Y, et al. T Helper 17 cells promote cytotoxic T cell activation in tumor immunity. Immunity. 2009;31:787–98. doi: 10.1016/j.immuni.2009.09.014. [DOI] [PMC free article] [PubMed] [Google Scholar]
- 18.Xu L, Wang C, Wen Z, et al. CpG Oligodeoxynucleotides enhance the efficacy of adoptive cell transfer using tumor infiltrating lymphocytes by modifying the Th1 polarization and local infiltration of Th17 cells. Clin Dev Immunol. 2010;2010:410893. doi: 10.1155/2010/410893. [DOI] [PMC free article] [PubMed] [Google Scholar]
- 19.Ankathatti Munegowda M, Deng Y, Mulligan SJ, Xiang J. Th17 and Th17-stimulated CD8+ T cells play a distinct role in Th17-induced preventive and therapeutic antitumor immunity. Cancer Immunol Immunother. 2011;60:1473–84. doi: 10.1007/s00262-011-1054-y. [DOI] [PMC free article] [PubMed] [Google Scholar]
- 20.Tao H, Mimura Y, Aoe K, et al. Prognostic potential of FOXP3 expression in non-small cell lung cancer cells combined with tumor-infiltrating regulatory T cells. Lung Cancer. 2012;75:95–101. doi: 10.1016/j.lungcan.2011.06.002. [DOI] [PubMed] [Google Scholar]
- 21.Chi LJ, Lu HT, Li GL, et al. Involvement of T helper type 17 and regulatory T cell activity in tumour immunology of bladder carcinoma. Clin Exp Immunol. 2010;161:480–9. doi: 10.1111/j.1365-2249.2010.04215.x. [DOI] [PMC free article] [PubMed] [Google Scholar]
- 22.Kennedy CL, Najdovska M, Jones GW, et al. The molecular pathogenesis of STAT3-driven gastric tumourigenesis in mice is independent of IL-17. J Pathol. 2011;225:255–64. doi: 10.1002/path.2933. [DOI] [PubMed] [Google Scholar]


