

Abstract
Transcription of the HER2 oncogene can be repressed by estrogen (E2). We now show that, a splice isoform of the nuclear receptor coactivator AIB1, AIB1-Δ4, is able to reverse E2 repression of HER2 gene expression in breast cancer cells. The first 224 amino acids of AIB1 that are absent in AIB1-Δ4, bind a co-repressor, ANCO1. Using chromatin immunoprecipitation assay approaches in MCF7 and BT474 cell lines, we demonstrate that AIB1 and AIB1-Δ4 can bind to the E2 regulatory site in the first intron of the HER2 gene, after E2 treatment, but only full-length AIB1 recruits ANCO1. Consistent with E2-induced chromatin repression, the AIB1-ANCO1 complex recruits HDAC3 and HDAC4 to the intronic estrogen response element and the proximal promoter acquires the repressive chromatin mark H3K9me3 and loses H3K4me1. In contrast, AIB1-Δ4 does not recruit ANCO 1, HDAC3, or HDAC4 and the proximal promoter retains activation marks of H3K4me1. In cell lines with low levels of ANCO1 (T47D), E2 does not repress HER2 gene transcription but the repressive response can be restored by overexpression of ANCO1. ANCO1 can also repress other E2-responsive genes, indicating that AIB1, AIB1-Δ4 and ANCO1 are important determinants of endocrine and growth factor responsiveness in breast cancer.
Estrogen (E2) -mediated regulation of gene transcription occurs through E2 binding to and activating the E2 receptor (ERα), which subsequently binds E2 response elements in DNA leading to the recruitment of various additional factors. Induction of transcription requires the recruitment of coactivators such as amplified in breast cancer 1 (AIB1 also known as SRC-3 or NCOA-3), a member of the p160 family of steroid receptor coactivators (1). AIB1 potentiates transcriptional activation through local chromatin remodeling and by enhancing assembly of activating transcriptional complexes (1). High levels of AIB1 in breast cancer have been correlated with formation of hormone-dependent and independent tumors, higher-grade tumors and shorter disease free survival (2–5). Consistent with a role in hormone-independent tumors, AIB1 potentiates IGF-1 and EGF signaling (6, 7) and is able to coactivate other nonsteroid receptor transcription factors including activator protein-1, nuclear factor κB, and E2F1 (8). Loss of AIB1 also leads to reduced phosphorylation of the ErbB (also known as HER) family of receptors both in vitro and in vivo (9). In transgenic models, loss of AIB1 prevents HER2-induced mammary neoplasia (9). Taken together, the data suggest that AIB1 plays a central role in E2 and HER family signaling and crosstalk in breast and other cancers.
We have previously identified a splice variant of AIB1, termed AIB1-Δ4, that results in a truncated AIB1 protein where the N-terminal 224 amino acids are not present (10). AIB1-Δ4 is a more potent coactivator of steroid and growth factor-dependent transcription (10). In both breast and endometrial cells AIB1-Δ4 can act to increase the efficacy of estrogenic compounds (11) and the agonist effects of the selective E2 receptor modulator, tamoxifen (11). In mouse models, overexpression of AIB1-Δ4 leads to increased crosstalk with estrogen receptor (ER) α in epithelial and stromal responses and increased expression of proliferative markers, including proliferating cell nuclear antigen, phospho-histone H3 and cyclin D1 (12). In addition to its effects in the nucleus, AIB1-Δ4 has been shown to act as a molecular bridge in the cytoplasm between epidermal growth factor receptor (EGFR) and focal adhesion kinase (FAK) (13). Overexpression of AIB1-Δ4 can drive a more metastatic phenotype in breast cancer cells and is found to be increased in more metastatic cell line variants (13, 14).
HER2 (neu, c-ERBB2) is part of a four-member family (HER1 [EGFR], HER3, HER4) of receptor tyrosine kinases that act to regulate survival and proliferation along multiple pathways including the phosphotidylinosital 3-kinase (PI3K) and mitogen-activated protein kinase pathways (15). Clinically important for breast cancer, the HER2 receptor is overexpressed or amplified in approximately 20% of invasive breast cancer (16). In animal models, HER2 can act as a potent oncogene with overexpression leading to cellular transformation and mammary tumor development. Overexpression of AIB1 with HER2 is associated with clinical resistance to endocrine therapy (17). Approximately half of HER2-positive tumors express the E2 receptor (18) and HER2 gene expression can be down-regulated by E2 in the MCF7 breast cancer cell line (19) through direct transcriptional repression of the HER2 gene (20). The repression of HER2 gene expression involves a number of regulatory elements in the gene including an estrogen response element (ERE) in the first intron that can bind ERα coupled with AIB1 (20). Why AIB1 lacks coactivator function in this context has not been determined although we have previously postulated that the N-terminus of AIB1 can bind a repressor molecule (14). Several candidate repressor factors that bind to the conserved N-terminal amino acid portion of the SRC-proteins have been reported (1, 5). One of these, ankyrin, repeats-containing cofactor 1 (ANCO1, also known as ankyrin repeat domain 11 ANKRD11) is a unique transcriptional coregulator because it can interact with both transcriptional coactivators and transcriptional corepressors (21, 22). Initial characterization of ANCO1 identified it as an interacting partner of the SRC family of transcriptional coactivators through their N-terminal basic helix-loop-helix (bHLH) and Per-Arnt-Sim domains (21). ANCO1's inhibitory function is due in part to its interaction with the histone deactylase proteins, namely HDAC3, 4, and 5 (22). ANCO1 acts as a bridging molecule between the SRC coactivators and the HDACs (21). Further studies have identified an inhibitory role for ANCO1 with the coactivator protein alteration/deficiency in activation 3 (ADA3), suggesting ANCO1 action may extend to various classes of transcriptional coregulators (23). Additional studies have identified a role for ANCO1 as an enhancer of the transcriptional coactivator p53 (24). A potential tumor suppressor role for ANCO1 has been proposed given that it is positioned at a genomic region with high levels of loss of heterozygosity in Ewing's sarcoma (25), is silenced by DNA methylation in breast tumor samples (26), and has been found to be a gene disrupted by structural rearrangement in peripheral T-cell lymphoma (27).
In the current study we wanted to determine the role and interactions of AIB1-Δ4, AIB1, and ANCO1 in the E2 regulation of the HER2 gene. We show that the relative levels of these cofactors, in several breast cancer cell lines, determines the extent of E2 repression and E2-induced changes in chromatin dynamics both at the intronic ERE and the proximal promoter of the HER2 gene. We also show that changes in these coregulator levels can alter heregulin-induced PI3 kinase (PI3K) signaling, an important determinant of trastazumab therapy responsiveness (28). Finally we show that changes in the levels of ANCO1 can alter the responsiveness of other cellular genes to E2 suggesting that AIB1 recruitment of ANCO1 is a widespread mechanism of modulating E2 gene expression and phenotype in breast cancer.
Materials and Methods
Plasmids
Flag-AIB1 and Flag-AIB1-Δ4 have been previously described (14). The pLNCX2-myc-ANCO1-GFP plasmid was kindly provided by Juan Young (University of Miami Hussman Institute for Human Genomics). For ANCO1 gene silencing, pLKO.1 lentiviral shRNA constructs were purchased from a commercial source (Thermo Scientific).
Cell lines, transient transfection, and transduction
MCF7, HEK293T, and BT474 cells were cultured in DMEM (Invitrogen) containing 10% fetal bovine serum. T47D cells were cultured in RPMI 1640 medium (Gibco) containing 10% fetal bovine serum. 72 hours prior to E2 treatment, cell media was changed to phenol red–free DMEM containing 5% charcoal-stripped fetal bovine serum (CSS), (MCF7 cells) or phenol red–free RPMI 1640 containing 5% CSS (T47D cells). Cells were treated with either vehicle of 10 nM E2 (Sigma) for the indicated time periods. For experiments using heregulin b1 (HRGb1) (Sigma), cells were treated at 10ng/mL for 20 min. For experiments overexpressing ANCO1, cells were retrovirally transduced. For experiments with overexpression of AIB1 and ANCO1, cells were retrovirally transduced for expression of ANCO1 and then transiently transfected for expression of AIB1 using Fugene 6. ANCO1 gene silencing was performed by lentiviral transduction of cells with shRNA specifically targeting ANCO1.
Immunoprecipitation and immunoblotting
Immunoblotting and immunoprecipitation were performed with the following antibodies: Flag M2 (Sigma), GFP (Zymed), AIB1 (Cell Signaling), ANCO1 (Abcam), phospho-AKT (Cell Signaling), AKT (Cell Signaling), phospho-ERK (Cell Signaling), and ERK (Cell Signaling). Immunoprecipitation of AIB1-Δ4 was performed using an antibody specifically recognizing this isoform (previously described in [14]). For immunoprecipitation and immunoblot analysis, cells were washed once with cold PBS and whole-cell lysates were prepared by lysis in 1% NP-40 lysis buffer containing 1 mM Na3VO4 and 1 complete protease inhibitor tablet (Roche). For immunoprecipitation, 1 mg protein was used per sample and antibody bound immunocomplexes were precipitated with Gammabind Plus Sepharose (GE Healthcare). Following immunoprecipitation, complexes were washed 3 times in lysis buffer and subjected to sodium dodecyl sulfate-PAGE (SDS-PAGE) and immunoblotting.
RNA extraction and qRT-PCR
Total RNA was isolated using the Illustra RNAspin Mini Kit (GE Healthcare) following the manufacturers' protocol. Reverse transcription was performed using the iScript cDNA synthesis kit (Bio-Rad) using 1 mg of total RNA. Samples were analyzed by real-time PCR (Mastercycler Realplex, Eppendorf) using IQ SYBR Green Supermix (Bio-Rad). Cycling conditions were 95°C for 3 minutes followed by 40 cycles of 95°C for 20 seconds, 56°C for 30 s, and 72°C for 40 seconds. The fold change for each gene was calculated using the cycle threshold (ΔΔCT) as previously described. For each sample, real-time quantitative reverse transcription PCR (qRT-PCR) was performed in triplicate for each gene of interest and for β-actin the reference gene to normalize for input cDNA.
Quantitation of AIB1 and AIB1-Δ4 using Scorpion primer-based qRT-PCR
Quantitation of AIB1 and AIB1-Δ4 using Scorpion primers was performed as previously described (14). Briefly, cells were treated ± 10 nM E2, total RNA was isolated, reverse transcribed and quantitative PCR was performed. Data for expression of AIB1 and AIB1-Δ4 were determined and their expression was normalized to actin expression levels to provide relative expression.
Chromatin immunoprecipitation assays
For chromatin immunoprecipitation (ChIP) assays MCF7, T47D, or BT474 cells were grown in 15-cm dishes in either phenol red-free DMEM containing 5% CSS for MCF7 and BT474 cells, or phenol red-free RPMI 1640 containing 5% CSS for T47D cells. Cells were then stimulated with either vehicle or 10 nM E2 for indicated times. Cells were fixed with a formaldehyde-fixing solution (3.7% formaldehyde, 100 mM NaCl, 50 mM Tris/HCl ph8.0, 1 mM EDTA, 0.5 mM EGTA) for 10 minutes at 37°C. Fixing was stopped by addition of 0.125 M glycine in 1× PBS for 5 minutes at room temperature. Cells were washed 3× in ice-cold 1× PBS then resuspended in SDS lysis buffer (50 mM Tris pH, 8.0; 10 mM EDTA pH, 8.0; 1% SDS). Cells were sonicated and resuspended in ChIP dilution buffer (20 mM Tris pH, 8.0; 2 mM EDTA pH, 8.0; 150 mM NaCl; 1% Triton X-100) and precleared with 60 mL of protein G-agarose/salmon sperm DNA (Millipore) for 1 hour. One milligram of protein was immunoprecipitated with 5 mg of suggestd antibodies overnight at 4°C and immunoprecipitated with 60 mL protein G-agarose/salmon sperm DNA for 2 hours. Agarose was washed once with low-salt buffer (20 mM Tris pH, 8.0; 2 mM EDTA pH, 8.0; 150 mM NaCl; 0.1% SDS; 1% Triton X-100), twice with high-salt buffer (20 mM Tris pH, 8.0; 2 mM EDTA pH, 8.0; 500 mM NaCl; 0.1% SDS; 1% Triton X-100) once with LiCl salt buffer (10 mM Tris pH, 8.0; 1 mM EDTA pH, 8.0; 250 mM LiCl; 1% sodium deoxycholate; 1% NP-40) and twice with TE buffer (10 mM Tris pH, 8.0; 1 mM EDTA pH, 8.0). Samples were eluted with elution buffer (1% SDS, 0.1M NaHCO3) for 15 minutes on a rotator and 10 minutes on a vortexer at room temperature. Cross-links were reversed with 200 mM NaCl overnight at 65°C and proteins were digested with 1 mg of proteinase K for 1 h at 45°C. DNA was purified using the GENECLEAN Turbo kit (Qbiogene Inc). Samples were analyzed by qPCR to analyze recruitment to the suggested EREs. Primers used for analysis have been previously described (29). Antibodies used for ChIP assays were as follows: ERα (HC-20, Santa Cruz), AIB1 (C-20, Santa Cruz), ANCO1 (ab50852, Abcam), HDAC3 (ab47237, Abcam), HDAC4 (ab1437, Abcam), Pol II (N-20, Santa Cruz), Pol II (CTD4H8, sc-47701x, Santa Cruz), histone 3 lysine 4 mono-methylation (H3K4me1, ab8895, Abcam), and histone 3 lysine 9 tri-methylation (H3K9me3, ab8898, Abcam). AIB1-Δ4 antibody was developed in our laboratory and previously described (13).
Results
AIB1-Δ4 reverses E2-mediated repression of HER2 gene transcription
To determine whether AIB1-Δ4 altered the E2 repression of the HER2 gene we transfected varying concentrations of an AIB1-Δ4 expression vector into MCF-7 breast cancer cells and treated with or without E2 for 6 hours. qRT-PCR was performed to quantify HER2 mRNA levels. Despite the high endogenous levels of AIB1 in MCF-7 cells (2), results suggested that with increased expression of AIB1-Δ4 there is a dose-dependent reversal of E2-induced repression of HER2 mRNA levels (Figure 1A). Previous data suggests that AIB1-Δ4 can influence gene expression by recruitment to gene regulatory elements (14) or by peripheral effects on cytoplasmic signaling (13). To determine whether this reversal of HER2 repression could be a direct effect of AIB1-Δ4 on nuclear transcription we examined whether AIB1-Δ4 was recruited directly to the HER2 gene promoter by performing ChIP assays using an antibody that interacts with the AIB1-Δ4 isoform but not with AIB1 as shown previously (14). We compared these ChIP results with those of an antibody that recognizes AIB1. Results suggest increased recruitment of ERα (Figure 1B) AIB1 (Figure 1C) and AIB1-Δ4 (Figure 1D) to the HER2 ERE upon E2 stimulation. These data suggest that both endogenous AIB1 and AIB1-Δ4 are engaged at the HER2 intronic ERE in response to E2 exposure in MCF7 cells and that AIB1-Δ4 is capable of regulating HER2 gene transcription. We hypothesized that AIB1-Δ4, unlike AIB1, does not repress transcription because it lacks repressor binding and in fact, was reversing estrogen-mediated repression and maintaining HER2 transcription when complexed with the ERα.
Figure 1.
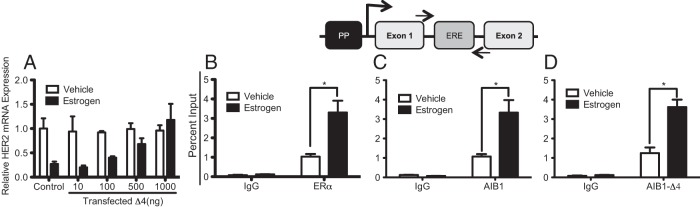
AIB1-Δ4 Reverses E2-mediated repression of HER2 gene transcription through HER2 Intronic ERE. A, AIB1-Δ4 was overexpressed at varying concentrations as indicated. MCF7 cells were treated ± 10 nM E2 for 6 hours and relative HER2 mRNA levels were measured by q-RT-PCR. B–D, ChIP assays for recruitment of endogenous ERα, AIB1 and AIB1-Δ4. The schematic highlights the structure of the HER2 gene and location of the primers used for ChIP-qPCR. For these assays MCF7 cells were treated ± 10 nM E2 for 45 minutes. Data are plotted as percent input and represents the average of biological triplicates ± SEM. *, P < .05.
ANCO1 interacts with AIB1 but not AIB1-Δ4
A candidate N-terminal repressor of AIB1 that may mediate HER2 repression is the corepressor ANCO1 (21). As an initial analysis we confirmed the interaction previously published between AIB1 and ANCO1 and determined whether ANCO1 interacted with AIB1-Δ4. We examined the interaction of AIB1 or AIB1-Δ4 and ANCO1 by coimmunoprecipitation in HEK293T cells expressing either Flag-AIB1 or Flag-AIB1-Δ4 with ANCO1-GFP. Immunoprecipitation was performed with antibodies to either Flag or GFP and immunoblotted for either GFP or Flag, respectively. Results confirmed the interaction between AIB1 and ANCO1 and indicated that AIB1-Δ4 did not interact with ANCO1 (Figure 2A). To confirm that ANCO1 was binding to the N-terminal region of AIB1, coimmunoprecipitation was performed in HEK293T cells overexpressing ANCO1-GFP and a construct expressing only the N-terminal (1–198aa) region of AIB1 (Flag-N-term). Results indicate that ANCO1 interacts with the N-terminal region of AIB1 that is present in the full-length protein and lacking in AIB1-Δ4 (Figure 2B). Next, we examined the interaction of endogenous AIB1 or AIB1-Δ4 and ANCO1 in MCF7 cells. As expected, endogenous AIB1 interacted with ANCO1 in MCF-7 cell extracts but no interaction was seen between ANCO1 and AIB1-Δ4 (Figure 2C). Although the results suggest that endogenous ANCO1 interacts with AIB1 and not AIB1-Δ4, we are aware that this could be due to the low levels of endogenous AIB1-Δ4 interacting with ANCO1 being below the level of detection. However, the lack of endogenous AIB1-Δ4 interaction with ANCO1 is consistent with our overexpression studies where also no interaction is observed with robust levels of AIB1-Δ4. Overall, the data suggests that ANCO1 interacts with AIB1 through its bHLH-Per-Arnt-Sim domain in the N-terminal region, which is spliced out of AIB1-Δ4, and is a candidate factor to mediate E2 repression of HER2 gene expression.
Figure 2.

ANCO1 interacts with AIB1 but not AIB1-Δ4. A, HEK293T cells were infected with vectors expressing Flag-AIB1 or Flag-AIB1-Δ4 along with ANCO1-GFP (see Materials and Methods). Reciprocal immunoprecipitations for GFP and Flag followed by immunoblotting for Flag and GFP respectively suggested interaction between AIB1 and ANCO1 but highlighted a lack of interaction between AIB1-Δ4 and ANCO1. B, HEK293T cells overexpressing ANCO1 GFP and the Flag-tagged N-terminal fragment of AIB1 (1–198aa) were subjected to immunoprecipitation and immunoblotting as indicated. C, Interaction of endogenous AIB1 and ANCO1. MCF7 cells were subjected to reciprocal immunoprecipitations as indicated.
The AIB1/ANCO1 complex is recruited to the HER2 ERE
We next wanted to determine the role for the AIB1 and ANCO1 complex in regulating the HER2 oncogene through an intronic ERE located between exons 1 and 2. To study this we performed ChIP assays to examine recruitment of proteins to the HER2 intronic ERE both in the absence and presence of E2. MCF7 cells were used for these experiments and were treated ± 10 nM E2 for 45 minutes. ANCO1 was recruited to the HER2 ERE strongly in the presence of E2 (Figure 3A). Given that ANCO1 has previously been shown to be important in attenuating AIB1-mediated transcriptional activation, we wanted to determine whether an AIB1/ANCO1 complex was present at the HER2 ERE. To determine this we performed sequential ChIP-reChIP assays. The results show significant recruitment of an AIB1/ANCO1 complex to the HER2 ERE in the presence of E2 (Figure 3B). However, AIB1-Δ4 does not recruit ANCO1 either in the presence or absence of E2 (Figure 3B). Previously published work had suggested a role for ANCO1 in acting as a scaffold, linking AIB1 and other transcriptionally repressive molecules such as histone deacetylases 3 and 4 (21). Thus, we wanted to determine whether these HDAC proteins were recruited to the absence and presence of E2. MCF7 cells were used for these experiments and were treated ± 10 nM E2 for 45 minutes. ChIP assays indicated recruitment of both HDAC3 and HDAC4 to the intronic ERE region during E2 repression of HER2 gene transcription (Figure 3, C and D). Sequential ChIP-reChIP assays also showed that AIB1/HDAC3 and AIB1/HDAC4 complexes were recruited to the HER2 ERE (Figure 3E). However, sequential ChIP assays with AIB1-Δ4 showed no recruitment of HDAC3 and HDAC4 (Figure 3E). Together, these results show that ANCO1 is recruited to the intronic HER2 ERE. In addition, HDAC3 and HDAC4 are recruited and can mediate the transcriptional repression that occurs upon E2 treatment.
Figure 3.
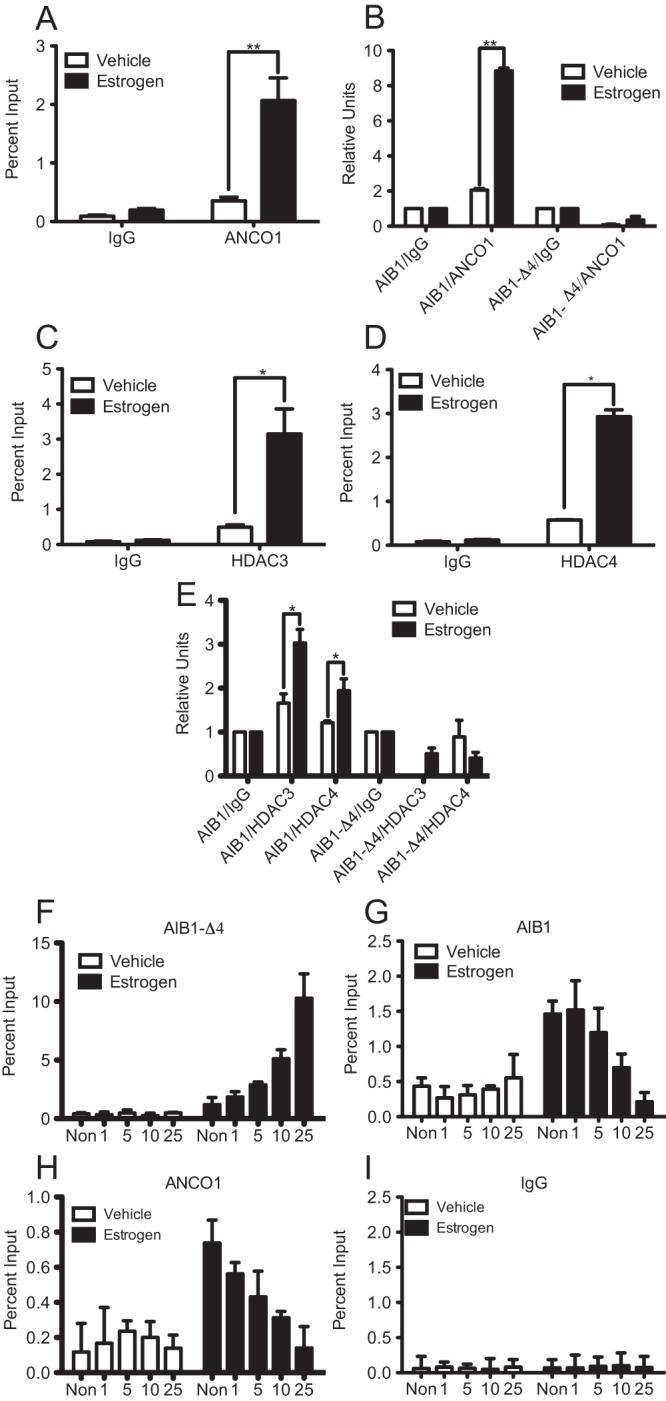
ANCO1 is recruited to HER2 intronic ERE and is antagonized by AIB1-Δ4. All ChIP assays were performed in MCF7 cells treated with 10 nM E2 for 45 minutes and qPCR was performed with primers flanking the intronic HER2 ERE. A, Single ChIP assay for ANCO1. B, Sequential ChIP-reChIP assays were performed for AIB1 and ANCO1. C and D, Single ChIP assays for HDAC3 and HDAC4 respectively. E, Sequential ChIP-reChIP assays for AIB1/HDAC3 and AIB1/HDAC4. F–I, MCF7 cells were transfected with varying amounts of Flag-AIB1-Δ4 (1, 5, 10, or 25 μg) or a nontransfected control (Non), treated with 10 nM E2 for 45 minutes and subjected to ChIP assay for AIB1-Δ4 (F), AIB1 (G), ANCO1 (H), and IgG (I) (as negative control). For A, C, D, and F–I, graphs are plotted as percent input and represent the average of triplicates from three independent experiments ± SEM. For B and D, graphs represent fold relative to IgG for triplicates from two independent experiments ± SEM. *, P < .05; **, P < .01.
Given that AIB1, which can bind ANCO1, and AIB1-Δ4, which cannot bind ANCO1, are both recruited to the HER2 ERE, we also wanted to determine whether AIB1 and AIB1-Δ4 could compete for binding at the HER2 ERE. To address this question we transfected MCF7 cells with varying concentrations of Flag-AIB1-Δ4, then examined binding of AIB1, AIB1-Δ4, and ANCO1 to the HER2 ERE by ChIP assay. Results suggest that with increasing amounts of transfected AIB1-Δ4, more AIB1-Δ4 binds at the HER2 ERE (Figure 3F). Conversely, with increasing amounts of AIB1-Δ4, binding of AIB1 (Figure 3G) and ANCO1 (Figure 3H) were reduced, IgG was used as a negative control (Figure 3I). Together, our results imply that AIB1-Δ4, in contrast to full length AIB1, does not contribute to epigenetic changes that mediate E2-induced transcriptional repression of HER2, most likely because it does not recruit ANCO1. In addition, there appears to be antagonism between recruitment of an AIB1/ANCO1 complex and AIB1-Δ4 at the HER2 intronic ERE.
E2 treatment causes chromatin changes at the HER2 proximal promoter
Although our studies have suggested that the AIB1/ANCO1 complex mediates E2-induced repression through the intronic ERE, we also wanted to determine whether this coincided with changes directly at the HER2 proximal promoter, which is an additional site of HER2 gene regulation (30, 31) This proximal promoter resides close to the transcription start site and is located upstream of the intronic ERE (Figure 4A). To determine this, we performed ChIP assays for RNA polymerase II (Pol II) and changes in local chromatin histone marks indicative of a change in chromatin dynamics in MCF7 cells. Figure 4A provides a schematic of the HER2 gene indicating the position of the intronic ERE, the proximal promoter, and position of primers used for ChIP assays examining changes in protein engagement in this region. As expected, E2 treatment lead to a decrease in total Pol II levels at the HER2 proximal promoter (Figure 4B). Also, ChIP assays with an antibody that can recognize the phosphorylated C terminal tail of Pol II (CTD4H8) suggested decreased recruitment of phosphorylated Pol II at the HER2 proximal promoter upon E2 treatment (Figure 4C). The CTD4H8 antibody, while being able to bind to phosphorylated Pol II can also bind to unphosphorylated Pol II, indicating this may partially be examining the recruitment or release of total Pol II. Examining the local chromatin environment, E2 treatment leads to a decrease in H3K4me1, a hallmark of a relaxed chromatin structure and active gene transcription (Figure 4D). In contrast, recruitment of H3K9me3, a hallmark of closed local chromatin structure and repressed gene transcription, increased upon E2 treatment (Figure 4E). Together, these results suggest that E2 treatment not only leads to changes in gene transcription of HER2 and recruitment of repressive molecules to the intronic ERE but also changes at the proximal promoter, which are consistent with decreased transcription, a closed chromatin structure, and a transcriptionally repressed gene.
Figure 4.
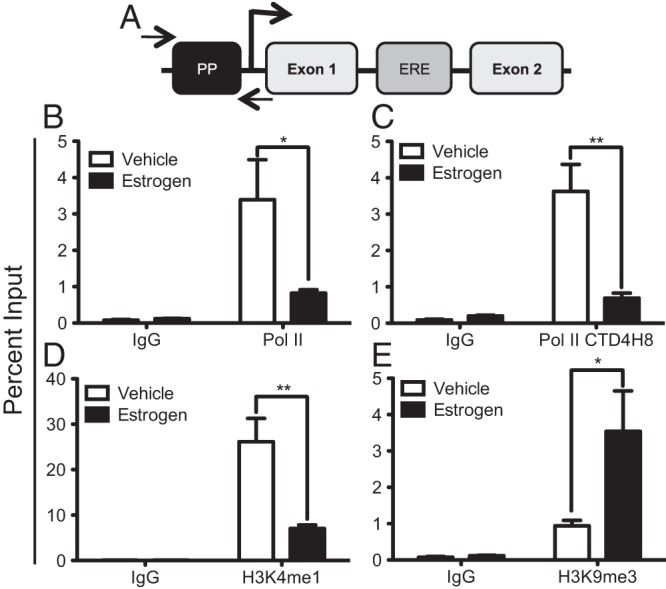
E2 treatment induces local chromatin changes at the HER2 proximal promoter. MCF7 cells were stimulated with 10 nM E2 for 45 minutes and ChIP assays were performed. Data are plotted as percent input and represent the mean of triplicates from three independent experiments ± SEM. A, Schematic of HER2 gene indicating location of the intronic ERE and proximal promoter. Arrows indicate relative location of primers used to amplify the proximal promoter (PP) region. ChIP assay for total RNA Polymerase II (B) and phosphorylated Pol II (C). ChIP assays for both active, H3K4me1 (D) and repressed, H3K9me3 (E) histone marks. *, P < .05; **, P < .01; ns, not significant.
Silencing of ANCO1 leads to changes in HER2 mRNA levels and histone recruitment
The data thus far suggest a role for AIB1 and ANCO1 crosstalk in mediating transcriptional repression of HER2. To determine whether altering the levels of ANCO1 affected the transcriptional output of the HER2 gene and recruitment of the proteins responsible for mediating this effect, we examined whether silencing of ANCO1 would make AIB1 functionally equivalent to AIB1-Δ4 and reverse E2-mediated repression of HER2. MCF7 cells were transfected with either nontargeting control shRNA or shRNA to ANCO1 and then treated with E2 over a course of 9 h. In cells transfected with control shRNA and treated with E2, HER2 mRNA levels were decreased as previously seen (Figure 5A). In the cells transfected with ANCO1 shRNA, treatment with E2 led to markedly reduced levels of transcriptional repression thus, suggesting that ANCO1 was important in mediating this effect (Figure 5A). Consistent with this notion, the silencing of ANCO1 led to changes in the recruitment of the factors previously described as engaged at the HER2 ERE and proximal promoter. In ANCO1 shRNA expressing cells, ChIP assays revealed induction of recruitment of ERα and AIB1 to the intronic HER2 ERE upon E2 stimulation (Figure 5, B and C), as well as recruitment of AIB1-Δ4 (Figure 5D). However, ANCO1 was not recruited upon E2 stimulation (Figure 5E) and the other components of the repressive complex, HDAC3 and HDAC4, were also not recruited to the HER2 ERE (Figure 5, F and G). The lack of recruitment of repressive molecules to the intronic ERE also coincided with local chromatin changes at the HER2 proximal promoter. ChIP assays for Pol II and the phosphorylated form of Pol II were both recruited to the proximal promoter and did not change upon E2 stimulation (Figure 5, H and I). The active H3K4me1 mark was present at the proximal promoter and remained present upon E2 stimulation and the repressive H3K9me3 mark was absent from the proximal promoter (Figure 5, J and K). Together, these results show that ANCO1 is important in mediating E2 repression of HER2 and upon reduction of ANCO1, ERα no longer recruits a repressive complex to the HER2 intronic ERE. Upon silencing ANCO1, however, AIB1-Δ4 is still recruited to the intronic ERE. These data suggest a pivotal role for ANCO1 in mediating E2-mediated repression of gene transcription and the maintenance of a repressed chromatin state.
Figure 5.

Silencing of ANCO1 leads to derepression of HER2 mRNA levels and loss of recruitment of repressive proteins. A, ANCO1 was silenced in MCF7 cells by shRNA. After knockdown cells were stimulated with 10 nM E2 for a 9 hours time course and HER2 mRNA levels were examined by q-RTPCR. Data represent the average of three independent replicates ± SD. B–K, For all ChIP assays cells were treated with 10 nM E2 for 45 minutes. Data represent the mean of triplicates from three independent experiments ± SEM. Assays were performed for ERα (B), AIB1 (C), AIB1-Δ4 (D), ANCO1 (E), HDAC3 (F), and HDAC4 (G), and qPCR was performed to the HER2 intronic ERE. ChIP assays were performed for Pol II (H), phosphorylated Pol II (I), H3K4me1 (J), and H3K9me3 (K), and qPCR was performed for the HER2 proximal promoter. *, P < .05; **, P < .01. L, MCF7 cells were infected with either control or ANCO1 shRNA then treated with vehicle, 10 nM E2, 10 ng/mL heregulin, or the combination of E2 plus heregulin. After treatment cells were collected and immunoblots were performed using the antibodies indicated.
ANCO1 levels determine levels of heregulin induced PI3 kinase signaling
We also wanted to determine whether altering the levels of ANCO1 could affect signaling through HER2 due to ANCO1's role in regulating the level of HER2 mRNA levels. To examine this we used shRNA to knockdown ANCO1 in MCF7 cells, then treated the cells with E2, heregulin, or the combination of E2 plus heregulin. Following treatment, cells were collected and immunoblotted for the suggested proteins. Levels of phospho-AKT and phospho-ERK were reduced when the cells were treated with the combination of E2 and heregulin under control conditions (Figure 5L, lane 4). In contrast, when ANCO1 expression was silenced, phospho-AKT and phospho-ERK were not reduced in the presence of the combination of estrogen and heregulin (Figure 5L; lane 4 vs 8). This suggests that when ANCO1 levels are reduced, E2 is unable to repress HER2, allowing the maintenance of heregulin induced HER2 signaling to occur.
Endogenous ANCO1 levels in breast cancer cell lines determine HER2 expression in response to estrogen
The above studies were performed in the ERα-positive MCF7 breast cancer cell line and we next wanted to determine whether ANCO1 regulation of HER2 occurred in other ERα-positive breast cancer cell lines. As a first step we examined ANCO1 protein expression levels in various breast cancer cell lines by immunoblotting (Figure 6A). The cell lines showed different levels of ANCO1, with the ERα-positive and progesterone receptor (PR) –positive T47D line indicating the lowest levels of expression and the ERα-positive HER2-positive BT474 cell line showing intermediate levels of ANCO1 (Figure 6A). We also determined the basal levels of HER2 in the cell lines used for further study. Both MCF7 and T47D had similar levels of HER2 mRNA (Figure 6B), and BT474 cells had markedly increased levels of HER2 mRNA compared with either MCF7 or T47D cells (Figure 6B). We were interested in whether the low level of endogenous ANCO1 in T47D cells affected E2-mediated repression of HER2. To examine this, T47D cells were treated with E2 during a 9 hours time course and HER2 mRNA levels were examined. In contrast to MCF7 cells, E2 treatment did not lead to repression of HER2 mRNA levels (Figure 6C). One possible explanation of the lack of E2-meditated repression could be due to increased levels of AIB1-Δ4 in T47D cells. However, results suggest that compared with both MCF7 and BT474 cells, T47D cells have, in fact, reduced levels of both AIB1 and AIB1-Δ4 mRNA (Figure 6D). We next examined the transcription complexes on the HER2 ERE in T47D cells. ERα, AIB1, and AIB-Δ4 recruitment to the HER2 intronic ERE was induced by E2 stimulation (Figure 6, E–G). As we had previously seen in ANCO1 shRNA-treated MCF7 cells (Figure 5), the low endogenous levels of ANCO1 in T47D cells did not lead to significant recruitment of ANCO1 to the HER2 ERE (Figure 6H). Also, the lack of ANCO1 recruitment led to the absence of recruitment of HDAC3 and HDAC4 to the HER2 ERE (Figure 6, I and J). Changes in the local chromatin environment at the HER2 proximal promoter in T47D cells also mirrored the previous results with ANCO1 silencing. Recruitment of both total and phosphorylated Pol II remained unchanged, suggesting the maintenance of HER2 transcription independent of E2 stimulation (Figure 6, K and L). H3K4me1 levels were high at the proximal promoter and remained unchanged upon E2 stimulation (Figure 6M). The repressive H3K9me3 chromatin mark was absent, indicative of a transcriptionally active gene (Figure 6N).
Figure 6.

E2 does not repress HER2 in T47D cells. A, Immunoblot for ANCO1 protein levels in various breast cancer cells lines. B, Relative basal HER2 mRNA expression in various breast cancer cell lines. C, HER2 mRNA expression level after E2 (10 nM) treatment for 9 hours in T47D cells. Data represent the average of three independent replicates ± SD. D, Relative expression levels of AIB1 and AIB1-Δ4 in MCF7, T47D and BT474 cells as assayed by qPCR using Scorpion primer technology. Data represent mean of averages from two independent experiments ± SEM. For all ChIP assays T47D cells were stimulated with 10 nM E2 for 45 minutes. ChIP assays for ERα (E), AIB1 (F), AIB1-Δ4 (G), ANCO1 (H), HDAC3 (I), and HDAC4 (J) were performed followed by qPCR for the HER2-intronic ERE. ChIP assays for Pol II (K), phosphorylated Pol II (L), H3K4me1 (M), and H3K9me3 (N) were performed followed by qPCR for the HER2 proximal promoter. Data represent the mean of three independent experiments ± SEM. *, P < .05; **, P < .01; ns, not significant.
Overexpression of ANCO1 in T47D cells restores E2-mediated transcriptional repression of HER2
The low levels of endogenous ANCO1 in T47D cells led to a lack of E2-mediated transcriptional repression of HER2. We next wanted to determine whether this effect was just a consequence of low levels of expression of ANCO1 or conversely if in these cells the HER2 gene regulatory elements had undergone other repressive epigenetic changes. Thus, we determined whether increasing levels of ANCO1 in T47D cells could reverse the lack of E2-mediated transcriptional repression. T47D cells were infected with an ANCO1-expressing retrovirus and HER2 mRNA levels were examined. E2 stimulation during a 9 hours time course led to repression of HER2 mRNA levels similar to that previously seen in MCF7 cells (Figure 7A). In addition, we examined the recruitment of factors to the HER2 intronic ERE and proximal promoter. ERα, AIB1, and AIB1-Δ4 were all recruited to the intronic ERE upon E2 stimulation (Figure 7, B–D). Overexpression of ANCO1 led to its recruitment to the ERE along with both HDAC3 and HDAC4 (Figure 7, E–G) and the recruitment of both total and active Pol II were reduced upon E2 stimulation (Figure 7, H and I). The active H3K4me1 mark at the promoter was reduced upon E2 stimulation and the H3K9me3 mark was induced upon E2 stimulation (Figure 7, J and K). These results suggest that the repression of HER2 by E2 is dependent on cells having sufficient expression of ANCO1.
Figure 7.

Overexpression of ANCO1 in T47D cells restores E2-induced repression of HER2 transcription. A, T47D cells were infected with GFP-ANCO1, treated with 10 nM E2 for the suggested times, and HER2 mRNA expression was determined by qRT-PCR. For all ChIP assays, T47D cells overexpressing ANCO1 were stimulated with 10 nM E2 for 45 minutes. Following ChIP, qPCR was performed for either the HER2-intronic ERE (B-G) or the proximal promoter (H–K), and data represent average of three independent experiments ± SD. *, P < .05; **, P < .01.
E2 regulates HER2 transcription in HER2-amplified cells
Our previous results have suggested that ANCO1 can play an important role in regulating expression of HER2 in both MCF7 and T47D cells. Although these cells express detectable HER2 they are not defined as HER2-positive by clinical criteria, as neither is gene amplified for HER2. Thus, we wanted to determine whether E2 could induce repression in a HER2-amplified cell line. For these experiments we used BT474 cells that are amplified for HER2 and are ERα positive. First, we examined the ability of E2 to repress HER2 mRNA expression. Cells were treated ± 10 nM E2 for the suggested times, mRNA was extracted, and qRT-PCR was performed for HER2. Results suggested that E2 was able to repress HER2 transcription as had been shown above in other cell lines (Figure 8A). We also wanted to know whether altering ANCO1 levels had an effect on HER2 mRNA levels in BT474 cells. ANCO1 was knocked down BT474 cells using shRNA and HER2 mRNA were measured by qRT-PCR. Results suggested that knockdown of ANCO1 lead to increased levels of HER2 mRNA in the presence of E2 (Figure 8B). Next, we wanted to determine whether a similar mechanism seen in MCF7 and T47D cells also occurred in BT474 cells. ChIP assays were performed and results suggest that ERα (Figure 8C), AIB1 (Figure 8D), AIB1-Δ4 (Figure 8E), and ANCO1 (Figure 8F) are all recruited to the HER2-intronic ERE in the presence of E2. Also, the repressive HDAC3 (Figure 8G) and HDAC4 (Figure 8H) were recruited to the intronic ERE in the presence of E2. This recruitment led to changes at the proximal promoter with release of Pol II (Figure 8I), phosphorylated Pol II (Figure 8J), and the active H3K4me1 chromatin mark (Figure 8K), and recruitment of the repressive histone mark, H3K9me3 (Figure 8L). Together, these data suggest that E2 has the ability to repress HER2 transcription in the HER2-amplified BT474 cell line and this repression occurs through a mechanism of recruitment of repressive molecules to the intronic ERE, which then act to change the local chromatin environment of the proximal promoter to repress transcription.
Figure 8.

E2 Represses HER2 transcription in HER2-amplified BT474 cells. A, BT474 cells were treated with 10 nM E2 for the indicated times and, RNA was collected and HER2 expression was determined by qRT-PCR. Data are the mean of triplicates ± SD. B, BT474 cells were infected with control or ANCO1 shRNA, treated with 10 nM E2 for 9 hours and mRNA expression was assayed by q-RTPCR. For all ChIP assays, BT474 cells were stimulated with 10 nM E2 for 45 minutes. Following ChIP qPCR was performed for either the HER2-intronic ERE (C–H) or the HER2 proximal promoter (I–M). Data represent average of three independent experiments ± SEM. *, P < .05; **, P < .01.
ANCO1 can regulate other E2-regulated genes
Although we initially focused on the regulation of the HER2 gene, we were also interested in whether ANCO1 could have an effect on other E2-regulated genes. To address this, we knocked down ANCO1 with shRNA in MCF7 cells, treated with E2, and examined mRNA expression other ERα target genes. We examined genes both induced and repressed in the presence of E2. For genes induced by estrogen, knockdown of ANCO1 increased levels of PR (Supplemental Figure 1A) but not pS2 (Supplemental Figure 1B). For genes repressed in the presence of E2, ANCO1 knockdown did not effect estrogen-mediated repression of cyclin G2 (CCNG2) (Supplemental Figure 1C) but did impair the ability of estrogen to repress kruppel-like factor 6 (KLF6) (Supplemental Figure 1D). Our data highlight the potential tumor suppressor role of ANCO1 as a repressor of the HER2 oncogene and regulator of other genes important in clinical breast cancer such as the progesterone receptor.
ANCO1 and clinical breast cancer outcome
We wanted to determine whether ANCO1 expression was correlated with clinical outcome of breast patients with cancer. In silico analysis of ANCO1 expression levels in clinical breast cancer specimens revealed that ANCO1 levels were significantly lower in patients who had their tumors recur (Supplemental Figure 2A) and in patients who did not survive their disease (Supplemental Figure 2B).
Discussion
Our studies describe a novel role for the balance of AIB1-Δ4 and the AIB1/ANCO1 complex in determining the transcriptional output of HER2. Our data are consistent with a model proposing that in ERα positive breast cancer cells, that have high levels of AIB1 and ANCO1, HER2 gene expression and signaling can be repressed by E2 (Figure 9). Conversely, when E2-exposed cells have high levels of AIB1-Δ4, derepression of the HER2 gene can occur and HER2 gene transcription can be maintained even in the presence of E2 and subsequent signaling will be maintained, regardless of the presence of AIB1 or ANCO1. We do note that while the most dramatic changes occurred in the presence of ligand, occupancy of the proteins of interest did occur in the vehicle control, possibly due to the presence of low levels of E2 present in the serum. Of interest, our model suggests that for E2 repressed genes, AIB1 can be found in complexes whose activity can either be to repress or maintain transcription determined by the presence or absence of ANCO1. In contrast, AIB1-Δ4, due to its inability to bind ANCO1 can only be found in complexes where maintenance of transcription occurs and not transcriptional repression. It should be noted that our finding that E2 causes ER and AIB1 recruitment to the HER2 intronic ERE differs from previous reports where AIB1 recruitment in response to E2 was not observed at the HER2 intronic ERE (29). We conjecture these differences may be due to variability of expression or the regulation of ANCO1 in different variants of the MCF7 cell line. In addition, this study focuses on the nuclear role of AIB1-Δ4. However, a previously described role for AIB1-Δ4 at the cell membrane in activating FAK signaling (13) may provide an interesting link between AIB1-Δ4 activity at the cell membrane and in the nucleus regulating gene transcription. High levels of FAK expression have been correlated with high levels HER2 expression (32) in human breast tumors and it would be of interest in future studies to determine whether AIB1-Δ4 mediated FAK signaling mediates AIB1-Δ4 induced increases in HER2 expression.
Figure 9.
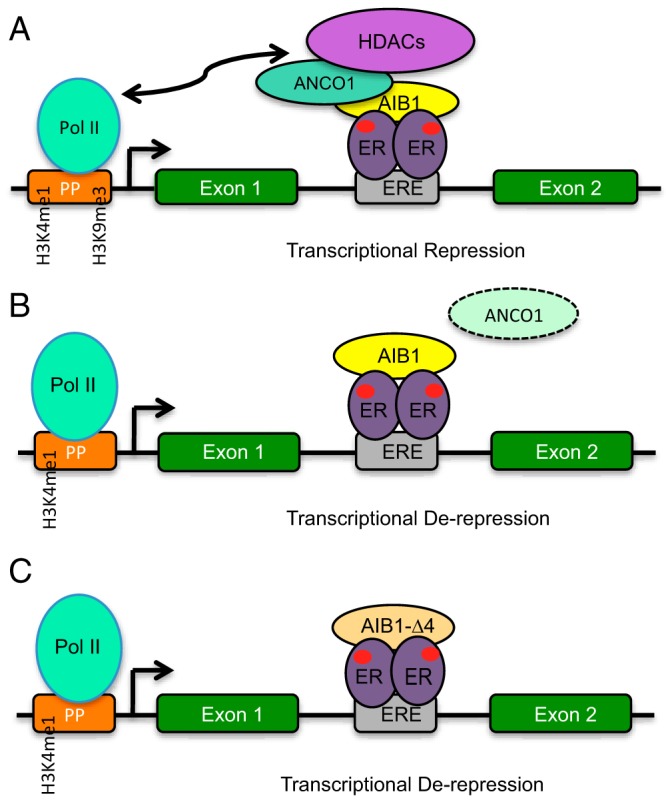
Model of AIB1/ANCO1 Action (A) In MCF7 and BT474 cells upon E2 treatment, the AIB1/ANCO1 complex recruits HDAC3, and HDAC4 to the HER2 intronic ERE with concurrent changes in Pol II binding and the local chromatin environment at the proximal promoter leading to a decrease in transcriptional activity. B, Model of AIB1/ANCO1 action when cellular ANCO1 levels are low such as in T47D cells or with silencing on ANCO1 in MCF7 cells. AIB1 can still bind to the HER2-intronic ERE and maintain transcriptional output. C, Model of AIB1-Δ4 action. AIB1-Δ4 does not bind to ANCO1, does not recruit repressive molecules and is able to maintain transcriptional output of the HER2 gene.
The binding of the AIB1/ANCO1 complex to the intronic ERE in HER2 leads to recruitment of the transcriptionally repressive HDAC3 and HDAC4 molecules. Interestingly, the binding of the AIB1/ANCO1 complex and these repressive molecules at the intronic ERE is accompanied by epigenetic changes observed at the HER2 proximal promoter upon E2 stimulation. The approximately 3.5-kb distance between the ERE located in intron 1 and the proximal promoter would suggest the possibility of a chromatin loop forming between these two elements; however, previous studies were unable to detect such a repressive loop (29). Alternative mechanisms by which binding of factors at the intronic ERE can interact with the local chromatin environment at the proximal promoter without looping thus seem likely. It may be possible that an AIB1/ANCO1 chromatin-modifying complex may physically link the intronic ERE and the proximal promoter, disrupting or altering a local repressive nucleosome structure. This chromatin-modifying complex likely requires other factors such as the transcription factor Pax2, whose binding site overlaps that of the HER2-intronic ERE (29).
Given that E2 regulates (represses and induces) a significant portion (approximately 27%) of the MCF7 transcriptome (33), we conjectured that ANCO1 could also affect other E2-responsive genes. In this regard, we examined the mRNA expression of two E2-induced genes, trefoil factor 1 (also known as pS2) (34) and PR (35), and two E2-repressed genes cyclin G2 (CCNG2) (36) and KLF6 (37). Our results suggest a differential effect of ANCO1 on E2-regulated genes as knockdown had effects on some genes (PR, KLF6) but not others (ps2, CCNG2). Together, this data suggests that ANCO1 plays an important role in determining not only the levels of HER2 in a cell but also the regulation of a subset of E2-dependent genes and subsequent E2 regulation of cell signaling. It is particularly interesting that some genes that are induced by E2, such as PR, are highly sensitive to changes in ANCO1 levels whereas pS2 induction by E2 is unaffected. This suggests that the cellular environment of coactivators, corepressors such as ANCO1, and epigenetic modifiers will play an important role in determining the magnitude and direction of E2 regulation of specific gene subsets. It is also of note that the PR gene's super sensitivity to changes in AIB1/ANCO1 levels is consistent with previous work from our laboratory demonstrating that PR is highly responsive to coactivation by AIB1-Δ4 (10). Future studies will be directed at determining whether it is the primary sequence surrounding the ERE, the cofactors recruited, or other epigenetic events that determine ANCO1 involvement in E2 responses. Furthermore, it is possible that ANCO1-repressive effects are not confined to AIB1 (SRC-3). The bHLH and Pas A/B domain, which is lacking in AIB-Δ4, is highly conserved between SRC family members (8), and thus ANCO1 repressive effects may also be exerted on SRC-1 and SRC-2. It will be of interest to determine whether ANCO1 could serve as a modulator for transcriptional ouptut from other nuclear receptors or transcription factors bound by the different SRC family members.
Given the central role of HER2 and AIB1 in breast cancer etiology there are potential clinical implications of this study. Approximately half of HER2-positive breast cancers express ERα (18) and our data would imply that the sensitivity of these tumors to E2 and HER2 inhibition will depend on the balance of AIB1, AIB1-Δ4, and ANCO1. In a wider context, the levels of ANCO1 in a tumor could determine a pattern of E2-regulated gene expression and signaling that would relate to disease outcome. Previous work has determined a correlation between high levels of AIB1 and HER2 in clinical breast cancer specimens (17). The study by Osborne et al (17) suggests that in patients who were not treated with adjuvant therapy, high levels of AIB1 are associated with better prognosis. This may suggest that in certain tumors high levels of AIB1, possibly in the presence of a repressor, such as ANCO1, may lead to repression of genes driving tumor progression. It would be interesting to determine whether in patients with better prognosis the high AIB1 levels correlate with high ANCO1 levels, thus providing a rationale that an AIB1/ANCO1 complex mediates repression of malignant progression. Our studies also suggest that AIB1/ANCO1 determines levels of PR in the cell and this could also be relevant to subsets of breast cancer. When considering the clinical implications of AIB1/ANCO1, future studies should focus on a potential correlation of ANCO1, AIB1, AIB1-Δ4, and PR expression levels with the various subtypes and stages of breast cancer. Previous analyses have demonstrated that high AIB1 and high HER2 levels correlate with poor survival and tamoxifen resistance in breast cancer. In addition, high HER2-activated PI3 kinases signaling that occurs with loss of ANCO1 is related to resistance to trastuzumab (28) and more aggressive cancer (28). To determine a potential role for ANCO1/AIB1 crosstalk in clinical breast cancer, we performed an in silico analysis examining a potential relationship between ANCO1 expression levels in tumor samples and disease outcome. The results from our analysis suggested worse outcomes in the subgroup with low levels of ANCO1 expression. Examining tumor recurrence incidence at 3 years post diagnosis, tumors that showed a recurrence had decreased levels of ANCO1 expression. Examining tumor samples from patients who were either alive or dead at 3 years post diagnosis, patients who had died due to their tumors showed decreased levels of ANCO1. Together, this data suggest a link between ANCO1 levels, disease recurrence, and disease mortality. Overall, our studies highlight a unique role for AIB1-Δ4 in the regulation of HER2 transcriptional regulation. In cellular scenarios where AIB1-Δ4 is high, such as in more metastatic breast cancer cells (14), the transcriptional activity of AIB1 target genes may remain activated through AIB1-Δ4, even in the presence of repressive signals. Strategies that would target AIB1-Δ4 and/or induce expression of ANCO1 could be useful in different stages and subtypes of breast cancer.
Additional material
Supplementary data supplied by authors.
Acknowledgments
This work was supported by NIH/NCI Grants R01 CA 113,477 (ATR) and T32 CA009686. This project was also supported by Award Number P30CA051008 from the National Cancer Institute.
Disclosure Summary: The authors have nothing to disclose.
Footnotes
- bHLH
- basic helix-loop-helix
- ChIP
- chromatin immunoprecipitation assays
- CSS
- charcoal-stripped fetal bovine serum
- E2
- estrogen
- ER
- estrogen receptor
- ERE
- estrogen response element
- FAK
- focal adhesion kinase
- H3K4me1
- histone 3 lysine 4 mono-methylation
- H3K9me3
- histone 3 lysine 9 trimethylation
- KLF6
- kruppel-like factor 6
- PI3K
- phosphotidylinosital 3-kinase
- pol II
- polymerase II
- PR
- progesterone receptor.
References
- 1. York B, O'Malley BW. Steroid receptor coactivator (SRC) family: masters of systems biology. J Biol Chem. 2010;285:38743–38750. [DOI] [PMC free article] [PubMed] [Google Scholar]
- 2. Anzick SL, Kononen J, Walker RL, et al. AIB1, a steroid receptor coactivator amplified in breast and ovarian cancer. Science. 1997;277:965–968. [DOI] [PubMed] [Google Scholar]
- 3. Torres-Arzayus MI, Font de Mora J, Yuan J, et al. High tumor incidence and activation of the PI3K/AKT pathway in transgenic mice define AIB1 as an oncogene. Cancer Cell. 2004;6:263–274. [DOI] [PubMed] [Google Scholar]
- 4. Torres-Arzayus MI, Zhao J, Bronson R, Brown M. Estrogen-dependent and estrogen-independent mechanisms contribute to AIB1-mediated tumor formation. Cancer Res. 2010;70:4102–4111. [DOI] [PMC free article] [PubMed] [Google Scholar]
- 5. Lahusen T, Henke RT, Kagan BL, Wellstein A, Riegel AT. The role and regulation of the nuclear receptor co-activator AIB1 in breast cancer. Breast Cancer Res Treat. 2009;116:225–237. [DOI] [PMC free article] [PubMed] [Google Scholar]
- 6. Lahusen T, Fereshteh M, Oh A, Wellstein A, Riegel AT. Epidermal growth factor receptor tyrosine phosphorylation and signaling controlled by a nuclear receptor coactivator, amplified in breast cancer 1. Cancer Res. 2007;67:7256–7265. [DOI] [PMC free article] [PubMed] [Google Scholar]
- 7. Oh A, List HJ, Reiter R, et al. The nuclear receptor coactivator AIB1 mediates IGF I-induced phenotypic changes in human breast cancer cells. Cancer Res. 2004;64:8299–8308. [DOI] [PubMed] [Google Scholar]
- 8. Xu J, Wu RC, O'Malley BW. Normal and cancer-related functions of the p160 steroid receptor co-activator (SRC) family. Nature reviews. Cancer. 2009;9:615–630. [DOI] [PMC free article] [PubMed] [Google Scholar]
- 9. Fereshteh MP, Tilli MT, Kim SE, et al. The nuclear receptor coactivator amplified in breast cancer-1 is required for Neu (ErbB2/HER2) activation, signaling, and mammary tumorigenesis in mice. Cancer Res. 2008;68:3697–3706. [DOI] [PMC free article] [PubMed] [Google Scholar]
- 10. Reiter R, Wellstein A, Riegel AT. An isoform of the coactivator AIB1 that increases hormone and growth factor sensitivity is overexpressed in breast cancer. J Biol Chem. 2001;276:39736–39741. [DOI] [PubMed] [Google Scholar]
- 11. Reiter R, Oh AS, Wellstein A, Riegel AT. Impact of the nuclear receptor coactivator AIB1 isoform AIB1-Delta3 on estrogenic ligands with different intrinsic activity. Oncogene. 2004;23:403–409. [DOI] [PubMed] [Google Scholar]
- 12. Nakles RE, Shiffert MT, Díaz-Cruz ES, et al. Altered AIB1 or AIB1Delta3 expression impacts ERα effects on mammary gland stromal and epithelial content. Mol Endocrinol. 2011;25:549–563. [DOI] [PMC free article] [PubMed] [Google Scholar]
- 13. Long W, Yi P, Amazit L, et al. SRC-3Delta4 mediates the interaction of EGFR with FAK to promote cell migration. Mol Cell. 2010;37:321–332. [DOI] [PMC free article] [PubMed] [Google Scholar]
- 14. Chien CD, Kirilyuk A, Li JV, et al. Role of the nuclear receptor coactivator AIB1-Delta4 splice variant in the control of gene transcription. J Biol Chem. 2011;286:26813–26827. [DOI] [PMC free article] [PubMed] [Google Scholar]
- 15. Zaczek A, Brandt B, Bielawski KP. The diverse signaling network of EGFR, HER2, HER3 and HER4 tyrosine kinase receptors and the consequences for therapeutic approaches. Histol Histopathol. 2005;20:1005–1015. [DOI] [PubMed] [Google Scholar]
- 16. Slamon DJ, Clark GM, Wong SG, Levin WJ, Ullrich A, McGuire WL. Human breast cancer: correlation of relapse and survival with amplification of the HER-2/neu oncogene. Science. 1987;235:177–182. [DOI] [PubMed] [Google Scholar]
- 17. Osborne CK, Bardou V, Hopp TA, et al. Role of the estrogen receptor coactivator AIB1 (SRC-3) and HER-2/neu in tamoxifen resistance in breast cancer. J Natl Cancer Inst. 2003;95:353–361. [DOI] [PubMed] [Google Scholar]
- 18. Montemurro F, Di Cosimo S, Arpino G. Human epidermal growth factor receptor 2 (HER2)-positive and hormone receptor-positive breast cancer: new insights into molecular interactions and clinical implications. Ann Oncol. 2013. [DOI] [PubMed] [Google Scholar]
- 19. Russell KS, Hung MC. Transcriptional repression of the neu protooncogene by estrogen stimulated estrogen receptor. Cancer Res. 1992;52:6624–6629. [PubMed] [Google Scholar]
- 20. Bates NP, Hurst HC. An intron 1 enhancer element mediates oestrogen-induced suppression of ERBB2 expression. Oncogene. 1997;15:473–481. [DOI] [PubMed] [Google Scholar]
- 21. Zhang A, Yeung PL, Li CW, et al. Identification of a novel family of ankyrin repeats containing cofactors for p160 nuclear receptor coactivators. J Biol Chem. 2004;279:33799–33805. [DOI] [PubMed] [Google Scholar]
- 22. Zhang A, Li CW, Chen JD. Characterization of transcriptional regulatory domains of ankyrin repeat cofactor-1. Biochem Biophys Res Commun. 2007;358:1034–1040. [DOI] [PMC free article] [PubMed] [Google Scholar]
- 23. Li CW, Dinh GK, Zhang A, Chen JD. Ankyrin repeats-containing cofactors interact with ADA3 and modulate its co-activator function. Biochem J. 2008;413:349–357. [DOI] [PubMed] [Google Scholar]
- 24. Neilsen PM, Cheney KM, Li CW, et al. Identification of ANKRD11 as a p53 coactivator. J Cell Sci. 2008;121:3541–3552. [DOI] [PubMed] [Google Scholar]
- 25. Savola S, Klami A, Tripathi A, et al. Combined use of expression and CGH arrays pinpoints novel candidate genes in Ewing sarcoma family of tumors. BMC Cancer. 2009;9:17. [DOI] [PMC free article] [PubMed] [Google Scholar]
- 26. Lim SP, Wong NC, Suetani RJ, et al. Specific-site methylation of tumour suppressor ANKRD11 in breast cancer. Eur J Cancer. 2012;48:3300–3309. [DOI] [PubMed] [Google Scholar]
- 27. Vasmatzis G, Johnson SH, Knudson RA, et al. Genome-wide analysis reveals recurrent structural abnormalities of TP63 and other p53-related genes in peripheral T-cell lymphomas. Blood. 2012;120:2280–2289. [DOI] [PMC free article] [PubMed] [Google Scholar]
- 28. Berns K, Horlings HM, Hennessy BT, et al. A Functional Genetic Approach Identifies the PI3K Pathway as a Major Determinant of Trastuzumab Resistance in Breast Cancer. Cancer Cell. 2007;12:395–402. [DOI] [PubMed] [Google Scholar]
- 29. Hurtado A, Holmes KA, Geistlinger TR, et al. Regulation of ERBB2 by oestrogen receptor-PAX2 determines response to tamoxifen. Nature. 2008;456:663–666. [DOI] [PMC free article] [PubMed] [Google Scholar]
- 30. Zuo T, Wang L, Morrison C, et al. FOXP3 Is an X-Linked Breast Cancer Suppressor Gene and an Important Repressor of the HER-2/ErbB2 Oncogene. Cell. 2007;129:1275–1286. [DOI] [PMC free article] [PubMed] [Google Scholar]
- 31. Newman SP, Bates NP, Vernimmen D, Parker MG, Hurst HC. Cofactor competition between the ligand-bound oestrogen receptor and an intron 1 enhancer leads to oestrogen repression of ERBB2 expression in breast cancer. Oncogene. 2000;19:490–497. [DOI] [PubMed] [Google Scholar]
- 32. Schmitz KJ, Grabellus F, Callies R, et al. High expression of focal adhesion kinase (p125FAK) in node-negative breast cancer is related to overexpression of HER-2/neu and activated Akt kinase but does not predict outcome. Breast Cancer Res. 2005;7:R194–203. [DOI] [PMC free article] [PubMed] [Google Scholar]
- 33. Carroll JS, Meyer CA, Song J, et al. Genome-wide analysis of estrogen receptor binding sites. Nat Genet. 2006;38:1289–1297. [DOI] [PubMed] [Google Scholar]
- 34. Nunez AM, Berry M, Imler JL, Chambon P. The 5′ flanking region of the pS2 gene contains a complex enhancer region responsive to oestrogens, epidermal growth factor, a tumour promoter (TPA), the c-Ha-ras oncoprotein and the c-jun protein. EMBO J. 1989;8:823–829. [DOI] [PMC free article] [PubMed] [Google Scholar]
- 35. Horwitz KB, Koseki Y, McGuire WL. Estrogen control of progesterone receptor in human breast cancer: role of estradiol and antiestrogen. Endocrinology. 1978;103:1742–1751. [DOI] [PubMed] [Google Scholar]
- 36. Stossi F, Likhite VS, Katzenellenbogen JA, Katzenellenbogen BS. Estrogen-occupied estrogen receptor represses cyclin G2 gene expression and recruits a repressor complex at the cyclin G2 promoter. J Biol Chem. 2006;281:16272–16278. [DOI] [PubMed] [Google Scholar]
- 37. Cicatiello L, Scafoglio C, Altucci L, et al. A genomic view of estrogen actions in human breast cancer cells by expression profiling of the hormone-responsive transcriptome. J Mol Endocrinol. 2004;32:719–775. [DOI] [PubMed] [Google Scholar]
Associated Data
This section collects any data citations, data availability statements, or supplementary materials included in this article.