Abstract
A mathematical model of renal hemodynamics was used to assess the individual contributions of the tubuloglomerular feedback (TGF) mechanism and the myogenic response to glomerular filtration rate regulation in the rat kidney. The model represents an afferent arteriole segment, glomerular filtration, and a short loop of Henle. The afferent arteriole model exhibits myogenic response, which is activated by hydrostatic pressure variations to induce changes in membrane potential and vascular muscle tone. The tubule model predicts tubular fluid and Cl− transport. Macula densa Cl− concentration is sensed as the signal for TGF, which acts to constrict or dilate the afferent arteriole. With this configuration, the model afferent arteriole maintains stable glomerular filtration rate within a physiologic range of perfusion pressure (80–180 mmHg). The contribution of TGF to overall autoregulation is significant only within a narrow band of perfusion pressure values (80–110 mmHg). Model simulations of ramp-like perfusion pressure perturbations agree well with findings by Flemming et al. (Flemming B, Arenz N, Seeliger E, Wronski T, Steer K, Persson PB. J Am Soc Nephrol 12: 2253–2262, 2001), which indicate that changes in vascular conductance are markedly sensitive to pressure velocity. That asymmetric response is attributed to the rate-dependent kinetics of the myogenic mechanism. Moreover, simulations of renal autoregulation in diabetes mellitus predict that, due to the impairment of the voltage-gated Ca2+ channels of the afferent arteriole smooth muscle cells, the perfusion pressure range in which single-nephron glomerular filtration rate remains stable is reduced by ∼70% and that TGF gain is reduced by nearly 40%, consistent with experimental findings.
Keywords: diabetes, hemodynamics, mathematical model, tubuloglomerular feedback, myogenic response
the generally stable glomerular filtration rate (GFR) is a result of renal autoregulation, as is the protection of glomerular capillaries from excessive intravascular pressure and shear stress. Renal autoregulation is mediated by several mechanisms: the myogenic response, which is a property of the preglomerular vasculature wherein a rise in intravascular pressure elicits a reflex constriction that generates a compensatory increase in vascular resistance and the tubuloglomerular feedback (TGF), a negative feedback response that balances glomerular filtration with tubular reabsorptive capacity (13, 21, 23). A third mechanism has been speculated to make a minor contribution; this mechanism appears to be much slower and remains poorly understood (23, 39). A fourth mechanism, which has been termed connecting tubule TGF, appears to induce dilation in the afferent arteriole when sodium concentration rises in the connecting tubule (35).
The major autoregulatory mechanisms, myogenic response and TGF, operate via depolarization of the afferent arteriole smooth muscle cells. By sharing a common effector, the two mechanisms are expected to interact. To study the two mechanisms and their interactions, we have developed a mathematical model that combines the myogenic response and TGF at the nephrovascular level in the rat kidney. The other two mechanisms, which are less well characterized, are not considered. We use the model to assess the relative contributions of myogenic response and TGF to overall autoregulation, under physiological and pathophysiological conditions.
MATHEMATICAL MODEL
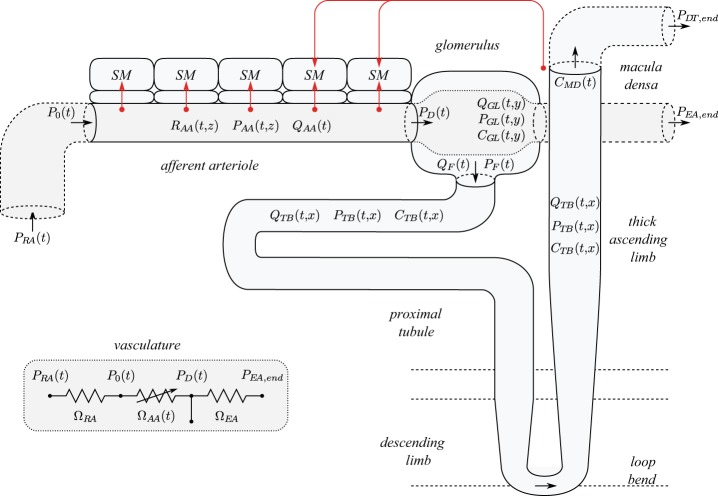
A schematic diagram of the renal autoregulation model is given in Fig. 1. The model consists of three major components: 1) an afferent arteriole segment (36), 2) glomerular filtration (14), and 3) a short loop nephron segment (24). These components are described below.
Fig. 1.
Schematic diagram of model configuration. Red arrows represent myogenic and TGF currents. R, P, Q, C, and Ω denote radius, fluid pressure, fluid flow, concentration, and resistance. Afferent arteriole segment is shown with a reduced number of smooth muscles (SM). Inset: Equivalent circuit of the model vasculature. See text for additional definitions.
Afferent Arteriole Submodel
The representation of the afferent arteriole segment is based on a model previously developed by us (36). It represents an afferent arteriole segment consisting of a series of NAA = 101 smooth muscle cell models (10), electrically coupled via gap junctions and via an endothelial cell layer. The cellular dynamics of each smooth muscle cell, influenced by the autoregulatory mechanisms, determine the vascular tone. The resulting vascular resistance is the main determinant of blood flow and single-nephron GFR (SNGFR; see Glomerular Submodel).
Each smooth muscle cell model incorporates cell membrane potential, transmembrane ionic transports, cytosolic Ca2+ regulation, and muscle contraction. The interactions between Ca2+ and K+ fluxes, which are mediated by voltage-gated and voltage-calcium-gated channels, respectively, give rise to the development of spontaneous oscillations in membrane potential. This in turn results in oscillations in cytoplasmic Ca2+ concentration and muscle tone.
Detailed descriptions of the afferent arteriole smooth muscle cell and vessel models can be found in Refs. 10, 36. Here we summarize key components of the model and highlight modifications from previous models.
Smooth muscle cell membrane potential.
The smooth muscle cells that form the afferent arteriole are indexed by i, where i = 1 and i = NAA denote the cells proximate to the renal artery (z = 0) and glomerulus (z = LAA), respectively. The rate of change of the membrane potential vmi of the i-th smooth muscle is a function of the sum of transmembrane currents
| (1) |
where Cm denotes the cell capacitance, and ILi, IKi, ICai, Im−mi, and Im−ei denote transmembrane leak current, potassium current, calcium current, gap junctional current between smooth muscle cells, and gap junctional current between smooth muscle cell and the endothelium, respectively. The remaining currents, IMRi and ITGFi, arise from the operation of the myogenic response and TGF (see below).
Myogenic response.
The model assumes that the activity of no-selective cation channels is shifted by changes in intravascular pressure, such that the smooth muscle membrane depolarizes with increasing intravascular pressure and vice versa. This process is represented by a pressure-dependent current IMRi in Eq. 1 given by
| (2) |
where PAAi denotes the intravascular pressure. The rate of change of IMRi at time t depends on the direction in which PAAi is changing at an earlier time t − τm. If PAAi(t − τm) ≥ 0, then the afferent arteriole responds to a pressure increase; conversely, if PAAi(t − τm) < 0, the afferent arteriole responds to a pressure decrease. The target current ĪMRi increases with pressure and saturates at sufficiently large perturbations; see Fig. 2A. The model assumes that the myogenic current is a function of local pressure only, whereas channel-mediated currents typically depend on membrane potential and resting potential. Because the cation channels that might be involved in the myogenic response have yet to be identified, the related resting potential too is unknown. Owing to these uncertainties, the simplifying assumption of a purely pressure-dependent myogenic current is made. Specifically, ĪMRi is given by the following sigmoidal function:
| (3) |
The reference pressure P̄AAi varies among the cells in as much as the baseline luminal pressure profiles, which reduces linearly along the vessel from 95 to 50 mmHg.
Fig. 2.
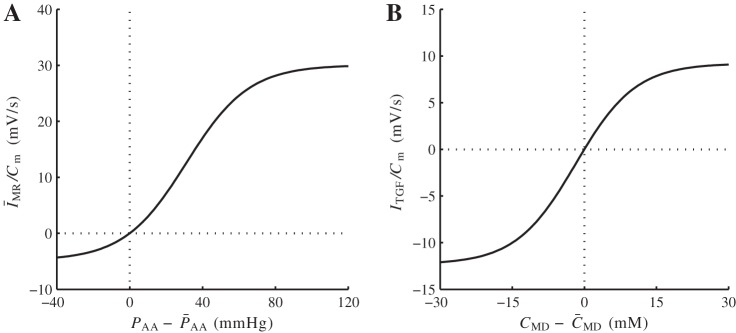
Autoregulatory currents, normalized by smooth muscle capacitance Cm. A: normalized myogenic response current. B: normalized tubuloglomerular feedback (TGF) current. See text for additional definitions.
To model the asymmetry in the vasoresponse time courses reported in Refs. 28, 27, the rate constants kinc and kdec in Eq. 2, which correspond to pressure increase and decrease, are set to 0.55 and 0.13 s−1, respectively. Similarly, the response delay τm is set to 0.3 s for pressure increase and to 1 s for pressure decrease.
Tubuloglomerular feedback.
The TGF signal is represented by the current ITGFi, which is applied to the smooth muscles spanning the distal 60 μm of the afferent arteriole. The current ITGFi is assumed to exhibit a sigmoidal dependence on intratubular macula densa [Cl−] (denoted CMD),
| (4) |
where C̄MD = 32 mM is the operating macula densa [Cl−]. The parameters ITGF,max, ITGF,min, and sTGF determine the dynamic range and open-loop gain of TGF.
Calcium dynamics and cross-bridge phoshorylation.
Parameters defining the myogenic response and tubuloglomerular feedback currents are given in Table 1. Free cytosolic Ca2+ concentration, denoted ci, is assumed in equilibrium with the buffer BT and is related to influx though the membrane channels ICai by
| (5) |
where αCa, which depends on the cytosolic volume and valence of the calcium ion, relates the calcium current to changes in cytosolic [Ca2+], and kCa is the first-order rate constant for cytosolic calcium extrusion (10). Cytosolic [Ca2+] determines the phosphorylation level ψi
| (6) |
which in turn determines the fraction of formed cross bridges, denoted ωi, according to
| (7) |
Parameters values can be found in Table 2.
Table 1.
Autoregulatory current parameters
| Parameter | Value | Units |
|---|---|---|
| IMR,min | −4.87 | mV/s |
| IMR,max | 30.1 | mV/s |
| sMR | 0.24 | mmHg−1 |
| ITGF,min | −12.3 | mV/s |
| ITGF,max | 9.22 | mV/s |
| sTGF | 0.85 | mM−1 |
See text for definitions.
Table 2.
Model parameters
| Parameter | Value | Units |
|---|---|---|
| Afferent arteriole submodel | ||
| LAA | 303 | μm |
| μAA | 16.7 | cP |
| ΩRA | 1.07 | mmHg·s·nl−1 |
| ΩEA | 12.0 | mmHg·s·nl−1 |
| τc | 675 | mmHg·s |
| kψ | 0.32 | s−1 |
| kCa | 190 | s−1 |
| αCa | 96.6 | nM/fC |
| Kd | 103 | nM |
| BT | 105 | nM |
| cM | 400 | nM |
| ψM | 0.55 | — |
| Glomerulus submodel | ||
| Ht | 0.45 | — |
| ΔPGL | 3.00 | mmHg |
| Kf | 2.14 | nl·min−1·mmHg−1 |
| αGL1 | 1.63 | mmHg·dl·g−1 |
| αGL2 | 0.29 | mmHg·dl2·g−2 |
| Tubule submodel | ||
| LTB | 15 | mm |
| ΩDT,ref | 42.9 | mmHg·s·nl−1 |
| μTB | 0.72 | cP |
| KM | 70 | mM |
See text for definitions.
Muscle mechanics.
To represent muscle mechanics, we have adopted the model formulated by Secomb and colleagues (1, 6, 7). In this model, vasomotion is driven by the balance between pressure-induced tension, TPi and wall tension, Twalli. Wall tension consists of a passive and an active components, Twalli= Tpassi + Tacti. The active wall tension component is given by
| (8) |
where Tact,maxi is the maximum active tension that can be generated at a given vessel circumference (see below). The muscle activation level is taken equal to the fraction of formed cross bridges ωi.
For a given smooth muscle luminal radius RAAi, the following wall tensions are developed
| (9) |
| (10) |
Parameter values are listed in Table 3. Tension arising from transmural pressure is given by the Laplace law:
| (11) |
The extravascular pressure Pext is assumed constant at 5 mmHg.
Table 3.
Muscle mechanics parameters
| Parameter | Value | Units |
|---|---|---|
| Cpass,0 | 18.2 | cm·mmHg |
| Cpass,1 | 9.76 | — |
| Cact,0 | 39.7 | cm·mmHg |
| Cact,1 | 1.00 | — |
| Cact,2 | 0.54 | — |
| RAA,c | 13.0 | μm |
See text for definitions.
The difference between pressure-induced tension and the wall tension gives rise to changes in vascular radius
| (12) |
Because the hydrostatic pressure PAAi decreases along the vessel, baseline TPi also decreases axially. Thus a scaling factor ξi, which decreases linearly from 4/3 to 2/3 along the vessel, is included to scale the wall tension accordingly.
Blood flow.
To compute vascular blood flow, we assumed that the model afferent arteriole is connected in series to a preafferent arteriolar resistor ΩRA and a postafferent arteriolar resistor ΩEA; see Fig. 1, inset. The overall resistance of the model afferent arteriole is computed from the radius profile
| (13) |
where μAA denotes blood viscosity.
The perfusion pressure PRA is assumed known a priori. The postefferent arteriolar pressure PEA,end is kept constant at 0 mmHg. We assumed simple Poiseuille flow so that arteriolar flow can be computed from the pressure drop along the afferent arteriole and the arteriolar resistance
| (14) |
Along the postglomerular vascular segment, blood flow is given by the difference between arteriolar flow and SNGFR (QF) and is related to pressure drop and vascular resistance as follows:
| (15) |
where PGL(t, LGL) is the hydrostatic pressure at the end of the glomerular capillary (see below). The relation between PAA(t, LAA) and PGL(t, LGL) is described in the glomerulus submodel below. The values of ΩRA and ΩEA are chosen such that in the base case they account for 5 and 50% of the pressure drop PRA − PEA,end, respectively.
Blood pressure at the entrance of the afferent arteriole is P0 = PRA − QAAΩRA, and the pressure gradient along the arteriolar lumen is given by the Poiseuille equation
| (16) |
Glomerulus Submodel
To model glomerular filtration, we adopted the model developed by Deen et al. (14). The glomerulus is represented as a single capillary extending from y = 0 to y = LGL, with the two end-points corresponding to the connections with the afferent and efferent arterioles, respectively. Let QGL and CGL denote the plasma flow rate and plasma protein concentration, respectively. Based on conservation of plasma mass, we have
| (17) |
where Kf is the ultrafiltration coefficient. PGL is the hydrostatic pressure, assumed to decrease linearly along the capillary PGL = PAA(t, LAA) − yΔPGL/LGL, where ΔPGL is constant. PF denotes the proximal tubule inflow pressure (computed in the tubule submodel below), and π denotes colloid osmotic pressure
| (18) |
Conservation of protein mass yields CGL(t, y)QGL(t, y) = CGL(t, 0)QGL(t, 0), which together with Eq. 17 results in
| (19) |
Plasma protein concentration entering the glomerulus is assumed fixed at 5.5 g/dl. Plasma enters at a rate determined by hematocrit Ht and arteriolar blood flow
| (20) |
By integrating Eq. 19, one obtains CGL(t, LGL), which is used to compute QGL(t, LGL) from the conservation of plasma mass. SNGFR is given by
| (21) |
Tubule Submodel
The tubule model, based on a previously applied TGF model (24), represents a proximal tubule followed by a short loop of Henle, extending from x = 0 (connection with the glomerulus) to x = LTB (site of macula densa). More specifically, the tubule model comprises the proximal convoluted tubule (5 mm), proximal straight tubule (2.5 mm), descending limb (1.5 mm), and thick ascending limb (5 mm) (see Fig. 1).
The model predicts intratubular pressure (PTB), water flow rate (QTB), and Cl− concentration (CTB). Tubular walls are assumed to be compliant, with a radius that depends passively on transmural pressure gradient
| (22) |
where αTB characterizes tubular compliance and βTB is the unpressurized radius.
Water transport.
Tubular water flow is assumed to be pressure driven. The proximal tubule and the initial segment of the descending limb of Henle's loop are water permeable. Taking the transmural water flux ΦTB into account, pressure and flow rate along the model nephron are given by
| (23) |
| (24) |
At the site of macula densa, the model tubule is connected to a resistance ΩDT, at the end of which pressure is assumed to be fixed at PDT,end = 2 mmHg. Thus tubular fluid pressure and flow at the macula densa are related by
| (25) |
Micropuncture studies indicate a strong passive dependence of distal tubule resistance on pressure (11). Consequently, ΩDT is modeled with a sigmoidal dependence on intratubular pressure
| (26) |
where PDT (given in mmHg) is the average of PTB(t, LTB) and PDT,end.
Transmural water flux depends on SNGFR and on perfusion pressure
| (27) |
where ΦTB,base is the baseline water flux profile. The factor SGTB models glomerulotubular balance (40, 42)
| (28) |
where QF is given in nl/min. The second factor SPN accounts for pressure natriuresis, where proximal tubular water reabsorption decreases when perfusion pressure increases,
| (29) |
where PRA is in mmHg. The slope −0.45 is chosen so that proximal tubule reabsorption is reduced by 55% when perfusion pressure is raised to 200 mmHg.
Chloride transport.
Chloride concentration along the tubule is given by conservation of mass
| (30) |
where RTB,ss is the steady-state tubular radius. Interstitial Cl− concentration, denoted CTB,ext, is set to 115 mM in the cortex and increases to 275 mM at the outer-inner medullary boundary (25). The first term in the last pair of parentheses corresponds to active solute transport characterized by Michaelis-Menten-like kinetics, and the second term represents transepithelial diffusion with transmural permeability κTB. Strictly speaking, Na+ ion is actively transported via the Na+-K+-ATP pump, with Cl− ion transported passively through the basolateral membrane. On the apical side, the NKCC2 transporter binds one Na+ ion for each K+ or NH4+ ion plus two Cl− ions. Thus the Michaelis-Menten term in Eq. 30 is an approximation, which appears to be sufficient. At the entrance of the proximal tubule (x = 0), tubular fluid [Cl−] is set to 115 mM.
To represent glomerulotubular balance, whereby the NaCl and water reabsorption along the proximal tubular varies in tandem, we assumed that along the proximal tubule, maximum active NaCl transport Vmax exhibits an analogous dependence on SNGFR and perfusion pressure as the transmural water flux ΦTB, given by
| (31) |
where Vmax,base is the baseline maximum transport rate along the proximal tubule.
Parameters
The model involves a large number of parameters. Parameters for the afferent arteriole model were adopted from Ref. 36; parameters for the glomerular filtration model were based on Refs. 2, 33; parameters for the tubule model were adopted from Ref. 24, 37. Baseline profiles of selected parameters and the resulting steady-state solution for the tubule model are shown in Fig. 3. Parameter values not found in, or modified from, the above references are given in Tables 3 and 4.
Fig. 3.
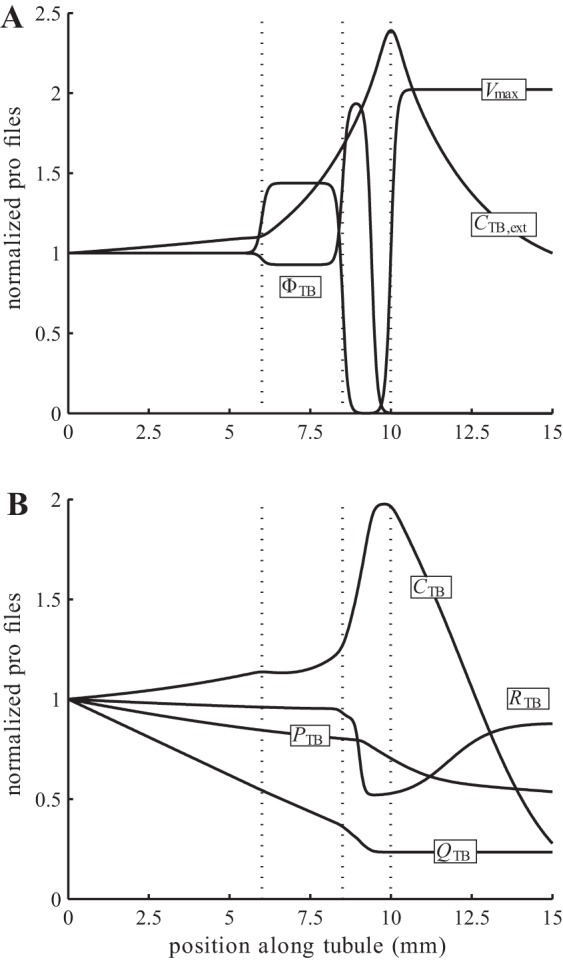
Baseline spatial profiles of model parameters and steady-state solution, normalized by respective boundary values. A: extratubular Cl− concentration. CTB,ext, water reabsorption rate ΦTB, and maximum active transport rate Vmax. B: steady-state tubular pressure PTB, flow rate QTB, radius RTB, and intratubular Cl− concentration CTB, obtained for single-nephron glomerular filtration rate (SNGFR) of 30 nl/min.
Table 4.
Tubular parameter profiles
| Parameter | Position/Values | Units | ||||
|---|---|---|---|---|---|---|
| Position | ||||||
| 0 < x <6 | 6 < x <8.5 | 8.5 < x <10 | 10 < x <15 | mm | ||
| αTB | 0.23 | 0.23 | 0.13 | 0.13 | μm/mmHg | |
| ΦTB,base | 22.8 | 21.2 | 44.2 | 0 | nl·min−1·cm−1 | |
| Vmax,base | 8.00 | 11.5 | 0 | 16.2 | nmol·s−1·cm−2 | |
| κTB | 1.00 | 1.00 | 0.15 | 0.15 | μm/s | |
| Position | ||||||
| x =0 | x =6 | x =8.5 | x =10 | x = 15 | mm | |
| βTB | 9.60 | 9.60 | 9.60 | 5.50 | 9.75 | μm |
| CTB,ext | 115 | 127 | 191 | 275 | 115 | μm |
See text for definitions.
The TGF current ITGFi has been constructed such that baseline open-loop TGF gain equals 3 and that SNGFR falls within the range 20–40 nl/min, (26, 20). The target myogenic current ĪMRi has been chosen as the lowest current necessary for the model to predict stable time-averaged SNGFR for perfusion pressures in the range 80–180 mmHg (21, 38). The two currents are shown in Fig. 2.
RESULTS
Base-Case Predictions
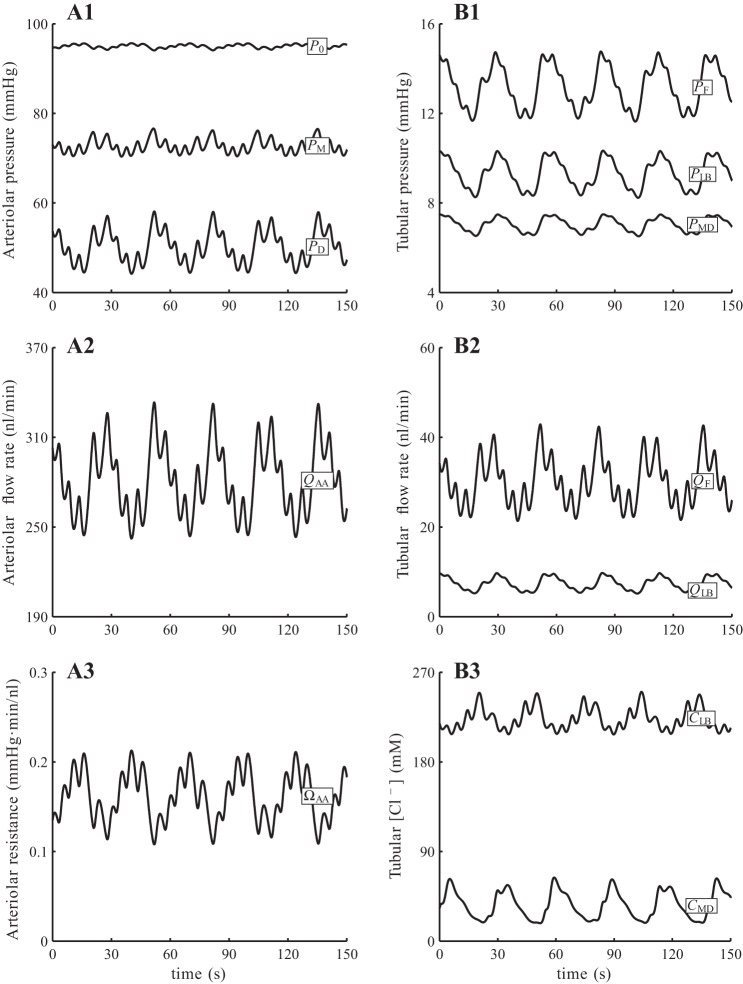
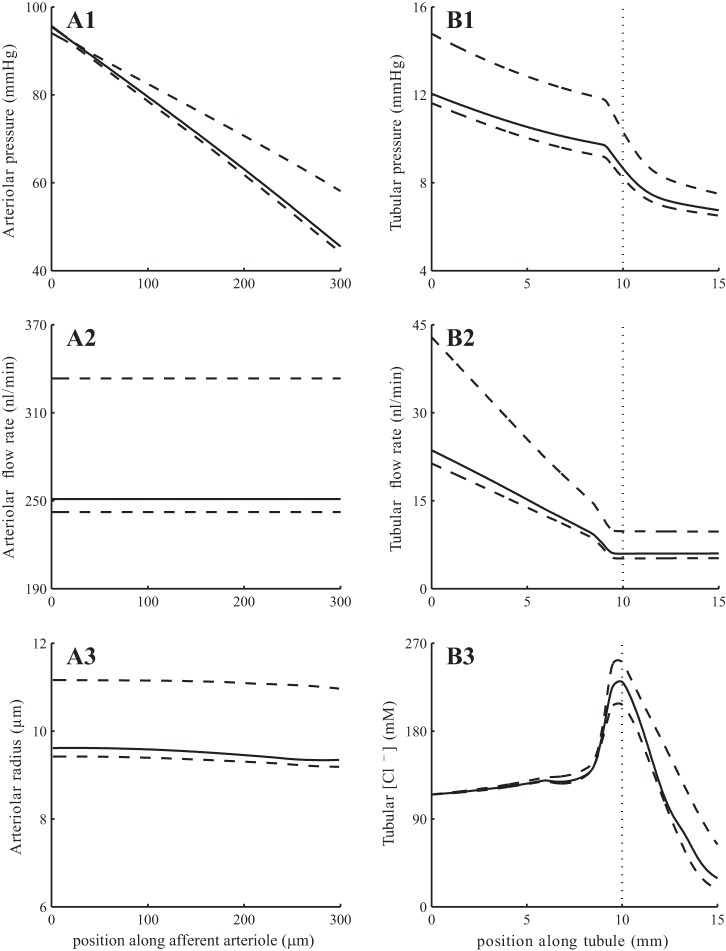
With baseline parameters and a steady perfusion pressure PRA = 100 mmHg, the model predicts an arteriole flow that oscillates at ∼280 nl/min. The oscillations involve a slow, TGF-mediated oscillation at 36 mHz and a fast, myogenic oscillation at 167 mHz; see Fig. 4. Both oscillations are initiated by periodic changes in afferent arteriole smooth muscle membrane potential, which translate into fluctuations in vascular tone. The resulting vasomotion alters the vascular resistance and blood delivery to the glomerulus, which transmits the fluctuations to SNGFR and downstream tubular transport. Time-averaged, minimum, maximum, and amplitude values of key model variables are listed in Table 5. A snapshot of the pressure, flow, and concentration profiles along the afferent arteriole and tubule, together with the corresponding envelopes (minimum and maximum values), is shown in Fig. 5.
Fig. 4.
Time course of baseline fluid pressure (A1 and B1), fluid flow (A2 and B2), arteriolar resistance (A3), and tubular fluid [Cl−] (B3) at selected locations. Present are a slow, TGF mediated oscillation (period ∼30 s) and a fast, myogenic oscillation (period ∼6 s). Subscripts 0, M, D denote afferent arteriole entrance, middle, and exit; subscripts F, LB, MD denote proximal tubule entrance, loop bend, and macula densa.
Table 5.
Baseline results obtained for steady perfusion pressure at 100 mmHg
| Average | Maximum | Minimum | Amplitude | Units | |
|---|---|---|---|---|---|
| P0 | 95.0 | 95.7 | 94.1 | 0.81 | mmHg |
| PM | 72.8 | 76.6 | 70.4 | 3.14 | mmHg |
| PD | 50.2 | 58.1 | 44.2 | 6.96 | mmHg |
| QAA | 281 | 333 | 242 | 45.6 | nl/min |
| PF | 13.2 | 14.8 | 11.6 | 1.58 | mmHg |
| PLB | 9.28 | 10.4 | 8.22 | 1.06 | mmHg |
| PMD | 7.03 | 7.50 | 6.51 | 0.49 | mmHg |
| QF | 30.2 | 43.0 | 21.4 | 10.8 | nl/min |
| QLB | 7.31 | 9.80 | 5.16 | 2.32 | nl/min |
| QMD | 7.31 | 9.74 | 5.22 | 2.26 | nl/min |
| CLB | 224 | 251 | 207 | 21.7 | mM |
| CMD | 35.4 | 63.8 | 17.8 | 23.0 | mM |
P, Q, and C denote pressure, flow rate, and [Cl−], respectively. Subscripts 0, M, and D denote afferent arteriole entrance, midpoint, and exit; subscripts F, LB, and MD denote proximal tubule entrance, loop bend, and macula densa.
Fig. 5.
Base-case spatial profiles for afferent arteriole and tubular fluid pressure (A1 and B1), fluid flow (A2 and B2), arteriolar resistance (A3), and tubular fluid [Cl−] (B3). Solid lines show profiles obtained at time 15 s; associated envelopes are shown in dashed lines. Dotted lines in B1–B3 indicate loop-bend position.
TGF gain is proportional to the slope of the TGF response curve at the operating point (Fig. 2B). When TGF gain is reduced to <60% of its baseline value by decreasing sTGF (Eq. 4) accordingly, TGF-mediated oscillations disappear, whereas myogenic oscillations persist (not shown).
Assessment of Renal Autoregulation
To assess the ability of the model to stabilize SNGFR, we computed time-averaged SNGFR and total arteriolar resistance for a range of steady renal perfusion pressure from 60 to 200 mmHg. These results are shown in Fig. 6, curve i. SNGFR exhibits a wide plateau, where it stays within 5% of its baseline value, for perfusion pressures 80–180 mmHg (21, 13). For this range of perfusion pressure, the glomerular capillary pressure remains ∼50 mmHg, whereas intravascular pressure varies from 65 to 125 mmHg in the middle of the arteriole (z = LAA/2), consistent with measurements by Carmines et al. (8). Afferent arteriole blood pressure profiles obtained for perfusion pressure 90, 130, and 170 mmHg are shown in Fig. 7.
Fig. 6.
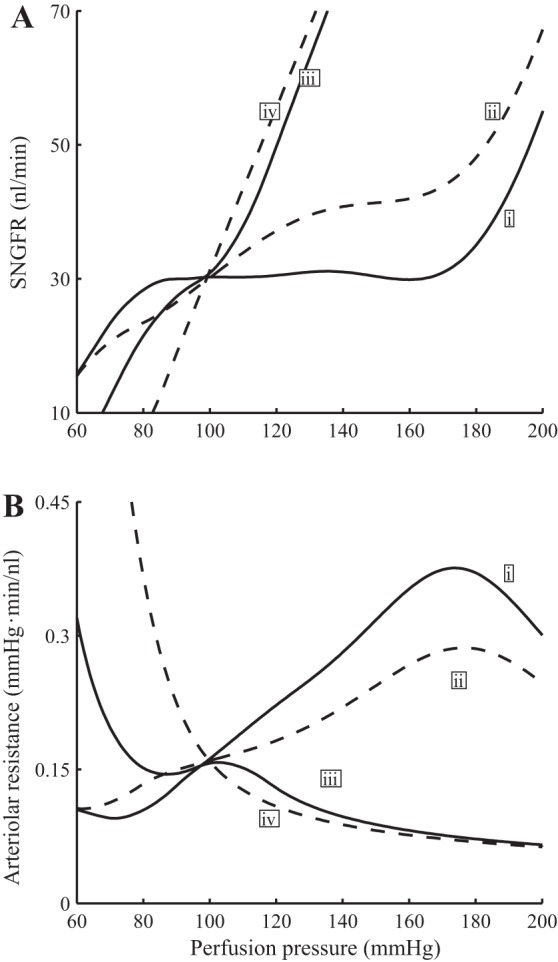
Time-averaged SNGFR (A) and vascular resistance (B) as functions of perfusion pressure. i, Base case (full autoregulation); ii, TGF inhibited; iii, myogenic response inhibited; iv, no autoregulation. Results indicate that the contribution of myogenic response is substantially larger than TGF in stabilizing SNGFR.
Fig. 7.
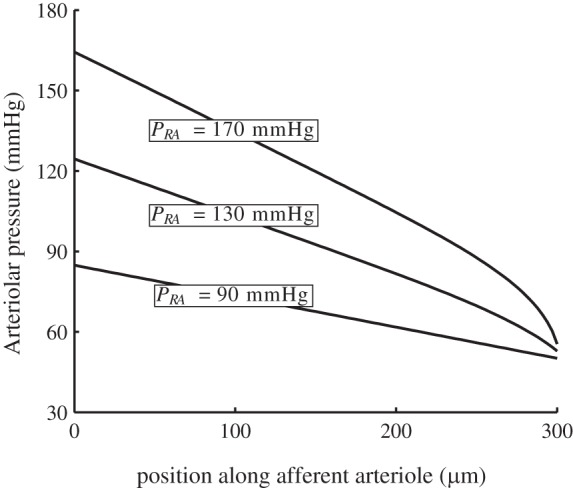
Time-averaged afferent arteriole blood pressure profiles for perfusion pressures 90, 130, and 170 mmHg. Afferent arteriole outflow pressure is well autoregulated despite large perfusion pressure variations.
To assess the individual contributions of the myogenic and TGF mechanisms to renal hemodynamic control, we conducted simulations in which we selectively inhibited these mechanism by setting the appropriate currents (IMR and ITGF) in Eq. 1 to zero. When both autoregulatory mechanisms are disabled (Fig. 6, curve iv), the SNGFR curve is predicted to rise with a slightly concave-upward shape as pressure increases, inasmuch as the higher blood pressure results in passive vasodilation, which lowers vascular resistance and yields a higher SNGFR. This result is consistent with findings by van Dokkum et al. (46) in the fawn-hooded rat (46).
When only TGF is inhibited, the model predicts a rise in SNGFR for perfusion pressure above baseline value, but the arteriolar resistance and SNGFR profiles generally follows the corresponding baseline profiles (see Fig. 6, curve ii). In contrast, when myogenic response is inhibited, SNGFR deviates substantially from its baseline value when perfusion pressure exceeds 110 mmHg or falls below 80 mmHg (see Fig. 6, curve iii). These results indicate that the contribution of TGF is significant only for a narrow range of pressure values around the baseline, where pressure natriuresis induces significant changes in macula densa [Cl−], thereby initiating a substantial TGF response and causing the appropriate changes in vascular tone to stabilize SNGFR. When perfusion pressure, and thus macula densa [Cl−], deviate substantially from baseline, however, the TGF signal becomes ineffective owing to its sigmoidal response (see Fig. 2B).
Response to Rapid Pressure Increase
We studied the response of the model to a rapid, step-like increase in input pressure from 80 to 160 mmHg. Figure 8 shows the imposed changes in the perfusion pressure and the resulting autoregulatory currents and vascular resistance time courses. For simplicity, the currents activating the myogenic response are shown only for the first and last smooth muscles of the afferent arteriole.
Fig. 8.
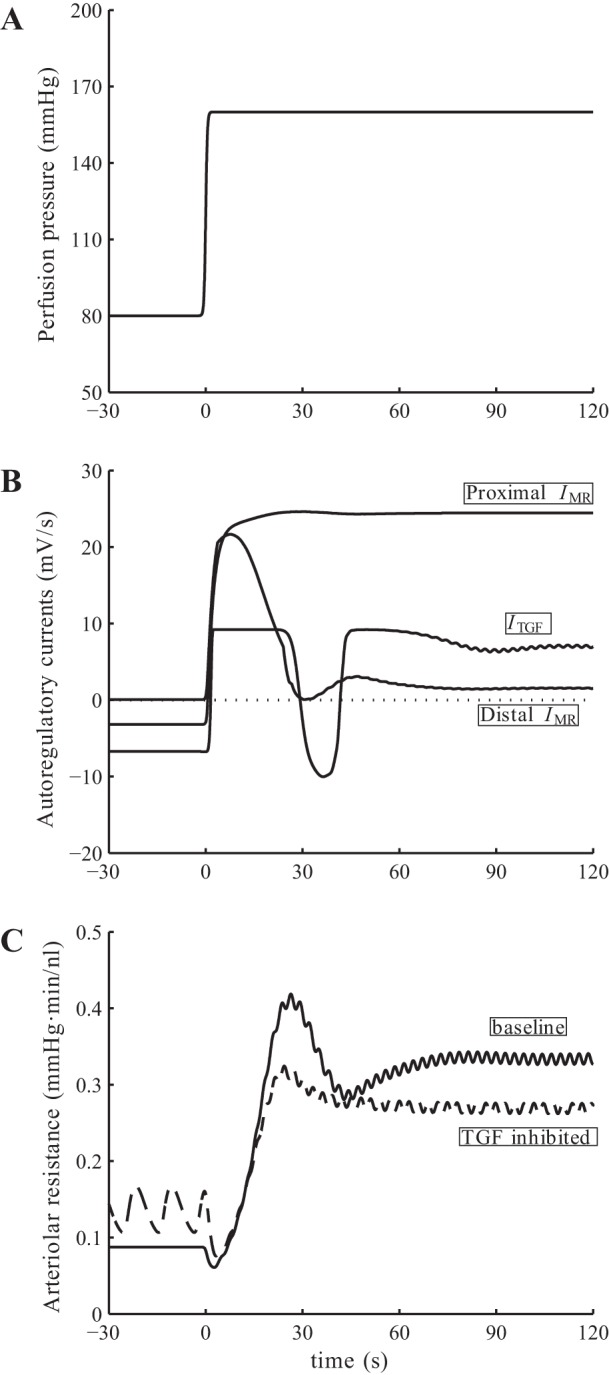
Model response to pressure up-step. A: input perfusion pressure. B: baseline myogenic and TGF currents. C: afferent arteriole resistance for base case and with TGF inhibited. Vascular resistance shows a biphasic response: an overshoot, followed by a transient oscillation. That oscillation disappears when TGF is inhibited.
After an initial delay, the pressure step induces a rapid vasoconstriction mediated by nearly maximal IMR and ITGF (Fig. 8B). That constrictive response leads to an overshoot in vascular resistance seen at 25 s (Fig. 8C). A slower response follows, during which the proximal part of afferent arteriole remains constricted and absorbs most of the applied perturbation, whereas the distal vascular segment dilates and gradually returns to its reference dimension. During that phase, a transient oscillation is also observed that quickly dissipates after one period (∼30 s), consistent with the biphasic responses reported by Just (23). About 1.5 min after the pressure step, the system attains a steady state with a SNGFR of 35.7 nl/min, which is 19% higher than baseline, resulting in a rise in macula densa [Cl−] and a sustained constrictive TGF response.
To determine the origin of the transient oscillation described above, we first noted that the TGF current is transiently activated following the initial overshoot, which suggests that the oscillation may be TGF-mediated. To assess the validity of that hypothesis, we repeated the pressure-step simulation with TGF inhibited. The model predicts an impaired autoregulatory response that is, when assessed in terms of arteriolar resistance, ∼80% of the baseline value. A similar initial overshoot in arteriolar resistance, with a smaller amplitude, is observed (see Fig. 8C). In contrast, in the absence of TGF, that overshoot in arteriolar resistance is followed by a gradual, monotonic decrease to its steady-state value. Hence, together these observations suggest that the transient postovershoot oscillation observed in the base case is mediated by TGF.
Furthermore, the above results suggest that the contributions of TGF and myogenic mechanism to the overall vasoconstrictive response are approximately 20 and 80%, respectively, for the particular pressure step applied (80–160 mmHg). Note that the exact split depends on the size of the pressure step. Recall that the contribution of TGF to steady-state perfusion pressure perturbations is significant only within a narrow band of pressure (Fig. 6). Thus, if the beginning and end pressure values of the pressure step both fall within this pressure band, then the contribution of TGF to the vasoconstrictive response is significantly larger (∼40%).
When the myogenic response is inhibited, with either TGF intact or similarly inhibited, the afferent arteriole responds to the pressure step perturbation with a passive dilation (results not shown), resulting in no attenuation of the applied perturbation and thus a substantially higher SNGFR.
Rate-Dependent Response to Pressure-Ramp Perturbations
Flemming et al. (16) measured the response of renal vascular conductance to ramp-shaped changes in renal perfusion pressure. Their results indicate that the changes in conductances are “markedly influenced by the velocity of pressure changes,” with faster pressure changes inducing larger conductance increases. Further, that effect is more pronounced during an increasing pressure-ramp compared with a decreasing ramp. To study the underlying mechanisms leading to such rate-dependent vasoresponse, we conducted the following simulations.
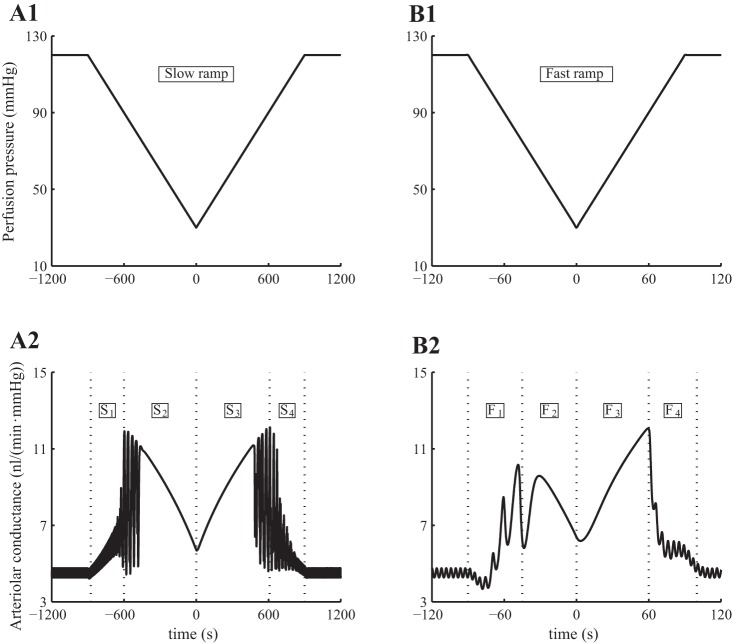
In separate simulations, we applied to the perfusion pressure of the model a fast ramp-shaped perturbation at 1 mmHg/s and a slow ramp-shaped perturbation at 0.1 mmHg/s. These pressure perturbations and the predicted vascular conductances are shown in Figs. 9, A1 and B1. The model exhibits two-phase responses to all ramps, fast and slow, increasing and decreasing. At perfusion pressure above 80 mmHg, the model maintains almost perfect autoregulation, with vascular conductance varying in the opposite direction of perfusion pressure. However, when the perfusion pressure drops below 80 mmHg, the model arteriole fails to sufficiently reduce wall tension to counteract the decrease in pressure-induced tension. Consequently, vascular conductance varies in tandem with perfusion pressure.
Fig. 9.
Model response to slow and fast pressure ramps. A1 and B1: input perfusion pressure; note different scaling of time axes. A2-B2: arteriolar vascular conductance. In both cases, the decreasing pressure ramp induces a 2-phase response in vascular conductance, with active vasodilation followed by passive vasoconstriction. An analogous 2-phase response is observed along the increasing pressure ramp. The response is markedly asymmetric for the fast ramp.
Consistent with measurements by Flemming et al. (16), the conductance time course of the model associated with the fast ramp exhibits a marked asymmetry but not for the slow ramp response. Specifically, the asymmetric response is characterized by 1) a shorter passive response interval during the decreasing pressure-ramp (marked “F2” in Fig. 9B2) than during the increasing ramp (marked “F3”), and 2) a higher maximum conductance during the increasing pressure ramp (at time 60 s) compared with the decreasing ramp (at time −45 s). The mechanisms that give rise to this asymmetry, which Flemming et al. (16) referred to as “hysteresis” but did not further investigate, are studied below.
Somewhat surprisingly, TGF appears to play no significant role in the observed conductance asymmetry. Simulations in which TGF was disabled predict qualitatively similar conductance time courses (results not shown).
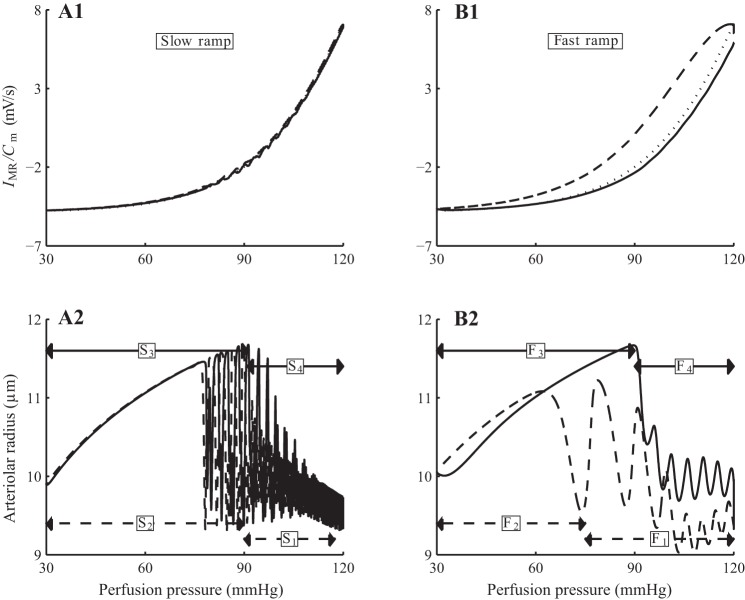
The asymmetry in the peak conductances can be attributed, in large part, to the asymmetry in the kinetics of the myogenic response. To illustrate this, we computed the trajectories of myogenic current (IMR) and perfusion pressure of the arteriolar smooth muscle cells. For simplicity, trajectories associated with the first cell are shown on Figs. 10, A1 and B1; the rest of the cell behave similarly and are not shown. For the slow ramp, the myogenic current trajectories produced by increasing and decreasing pressure ramps almost overlap, with the target myogenic current given by ĪMR (Eq. 2; see Fig. 10A1). In contrast, the increasing and decreasing fast ramps produce significantly different myogenic current trajectories (see Fig. 10B1). This mismatch is attributed to the rate-dependent kinetics of the myogenic mechanism, given in Eq. 2, which provides a faster response to increasing pressure than to decreasing pressure. As a result, the myogenic current trajectory corresponding to the increasing pressure-ramp almost reaches the target current, whereas the trajectory corresponding to the decreasing pressure ramp remains far above the target current; see Fig. 10B1. The separation is much less noticeable with the slow ramp, in which case the myogenic current is given sufficient time to equilibrate.
Fig. 10.
Model autoregulatary responses to slow and fast pressure ramps. A1 and B2: normalized myogenic current (IMR/Cm) as function of pressure. A2 and B2: arteriolar radius. Solid lines, responses during increasing pressure ramp; dashed lines, responses during decreasing pressure ramp. Owing to the slower myogenic response to pressure reductions, the myogenic current fails to equilibrating during the decreasing fast pressure ramp.
The trajectories of the arteriolar radius follow those of the myogenic current (Fig. 10, A2 and B2). The two-phase responses during the increasing and decreasing slow ramps are indicated by the labels S1 and S2, etc. (Fig. 10A2), which correspond to the time-intervals identified by the same labels in the conductance profile in Fig. 9A2. Analogous labels, F1, F2, etc., are used in the fast-ramp response to facilitate comparison between Figs. 10B2 and 9B2.
Renal Hemodynamics in Diabetes
We conducted simulations to assess the extent to which functional impairment in afferent arteriole voltage-gated Ca2+ (VGC) channels observed in diabetic rats (9) diminishes the vasoconstrictive response, thereby causing glomerular hyperfiltration. The model represents the voltage-dependent distribution of open Ca2+ channel states by
| (32) |
where v1 = −22.5 mV is the voltage at which half of VGC channels are open in the unimpaired state, and v2 = 25 mV determines the spread of the opening distribution. To represent VGC impairment, we increased v1 to −20.7 mV.
At the onset of diabetes, the proximal tubule is known to hypertrophize (43). As a result, water and salt reabsorption along the proximal tubule increases, a process that we simulated by increasing proximal tubule transmural water flux and maximum active transport rate by 78 and 150%, respectively. Diabetes is also associated with TGF resetting (41, 45), which we represented by lowering the operating macula densa [Cl−] (C̄MD in Eq. 4) from its baseline value of 32 to 27 mM. Finally, the ultrafiltration coefficient Kf is increased by 20% from the baseline value (4).
With this set of modified parameters, the model predicts hyperfiltration in diabetes, with a SNGFR of 48 nl/min, 60% above base case. Together with a higher proximal tubule reabsorption, however, loop-bend flow rate remains at 7 nl/min, whereas macula densa [Cl−] is reduced by 5 mM, consistent with experimental results by Vallon et al. (44) and Vallon and Thomson (45).
We then conducted simulations to further investigate TGF efficiency in diabetes. First, we noted that the open-loop TGF gain is given by the product of 1) the slope of the curve of SNGFR as a function of macula densa [Cl−], evaluated at the operating point, and 2) the inverse of the slope of the curve of macula densa [Cl−] as a function of prescribed SNGFR, again evaluated at the operating point. Thus, to determine TGF gain in the diabetic model, we computed the curves in 1 and 2; the results are shown in Fig. 11.
Fig. 11.
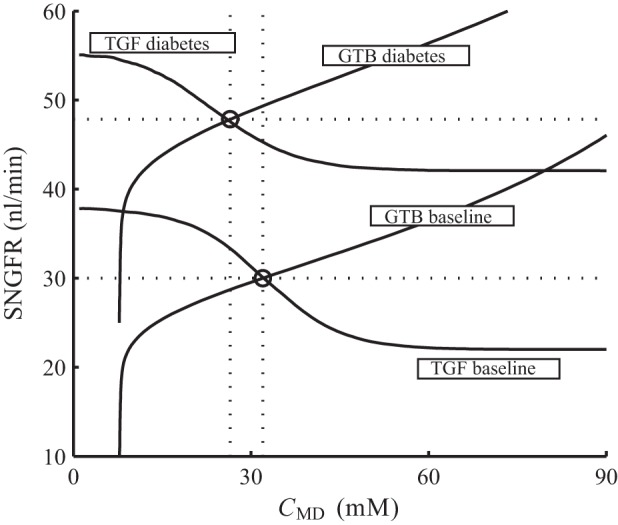
Glomerular hyperfiltration in diabetes. Solid lines: SNGFR under prescribed CMD (labeled “TGF baseline” and “TGF diabetes,”) and CMD under prescribed SNGFR (labeled “GTB baseline” and “GTB diabetes”). Baseline operating point is located at 30 nl/min and 32 mM, and diabetic operating point is at 48 nl/min and 27 mM (marked by circles).
The curves labeled “TGF baseline” and “TGF diabetes” are obtained, for the base and the diabetic cases, respectively, with macula densa [Cl−] prescribed. Owing in large part to VGC impairment, the diabetic model predicts a substantial degree of hyperfiltration. As a result, the diabetes curve is shifted upward from baseline (see Fig. 11).
The curves labeled “GTB baseline” and “GTB diabetes” are obtained with SNGFR prescribed; that is, the ordinate (SNGFR) is the inputs and abscissa (CMD) is the predicted values (Fig. 11). These simulation results are presented in this manner to facilitate comparison with data in Ref. 45, Fig. 2. The upward shift of the diabetes curve results from the elevated proximal tubular reabsorption and the consequently lowered macula densa [Cl−].
Open-loop TGF gains for the base case and for the diabetes case can be computed by evaluating the slopes of the curves in Fig. 11 at the respective operating points (denoted by open circles) as described above. The baseline TGF gain is 3, and the diabetic TGF gain is reduced by 41% to 1.74. That reduction of TGF gain is attributable, in comparable degrees, to the impaired responsiveness of the afferent arteriole to the TGF signal, due to impairment of VGC channels, and to proximal tubule hypertrophy: the operating-point slope of the “TGF diabetes” curve is 26% lower than base case, whereas the corresponding slope of the “GTB diabetes” curve is 20% lower.
To assess renal autoregulation under diabetic conditions, we first considered steady perfusion pressure and conducted simulations analogous to those used for Fig. 6. When both myogenic response and TGF are intact, the model predicts stable SNGFR for perfusion pressures between 85 and 115 mmHg, a plateau that is significantly narrower than the base case (compare Figs. 6 and 12). In particular, the ability of the myogenic response to stabilize SNGFR is significantly impaired in diabetes, as indicated by the shape of the SNGFR profile labeled ii, which corresponds to the case with TGF inhibited.
Fig. 12.
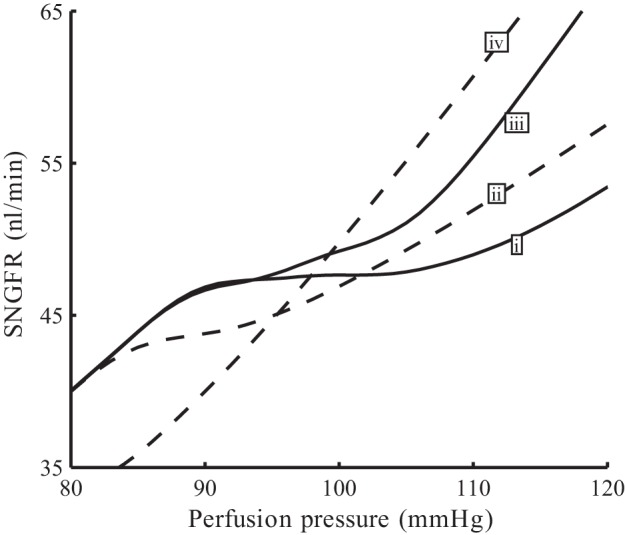
Autoregulatory plateaus of simulated diabetes. Time-averaged SNGFR as functions of perfusion pressure. i, Base case (full autoregulation); ii, TGF inhibited; iii, myogenic response inhibited; iv, no autoregulation.
We then compared the response of the model to fluctuations in blood pressure under normal and diabetic conditions, by imposing a sinusoidal oscillations to a mean perfusion pressure of 100 mmHg. The applied oscillations have a frequency of 1 Hz and an amplitude of 60 mmHg (Fig. 13A). Both the normal and diabetic models respond with sustained vasoconstriction, owing to the faster myogenic response to pressure elevations than to pressure decreases (10, 36, 28), such that after an initial transient elevation, afferent arteriole outflow pressure returns to the level before the perturbation is applied (Fig. 13, B and C). As previously discussed, the diabetic model exhibits glomerular hyperfiltration, as can be seen in the higher peak and average pressures (compare B and C). The peak pressure transmitted to the glomerular capillaries before the sustained vasoconstriction is fully established is ∼12.3 mmHg higher in the diabetic case than normal.
Fig. 13.
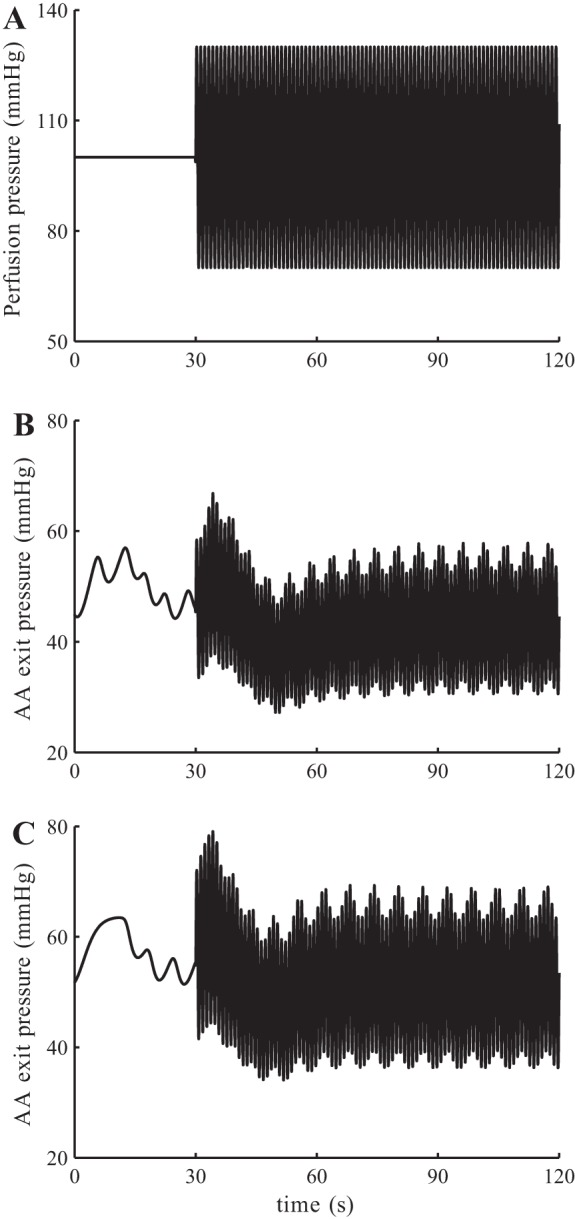
Simulations of normal and diabetic kidney response to blood pressure fluctuations. A: perfusion pressure, with sinusoidal oscillations at 1 Hz. B: model response with normal physiological parameters. C: model response with diabetic parameters.
Sensitivity Studies
The model comprises a large number of parameters. In the following set of sensitivity studies, we assessed the degree to which the model's autoregulation is impacted by variations in selected parameters, which characterize the myogenic response and TGF.
We first varied the target myogenic current ĪMR by ±10 and ±20%, as shown in Fig. 14A. When ĪMR is reduced from its baseline value, the model fails to attain a stable SNGFR for any significant pressure range (see Fig. 14B). When ĪMR is raised above its baseline value, the model overcompensates, as expected; the deviation from the stable SNGFR value is particularly marked when TGF is inhibited (see Fig. 14C).
Fig. 14.
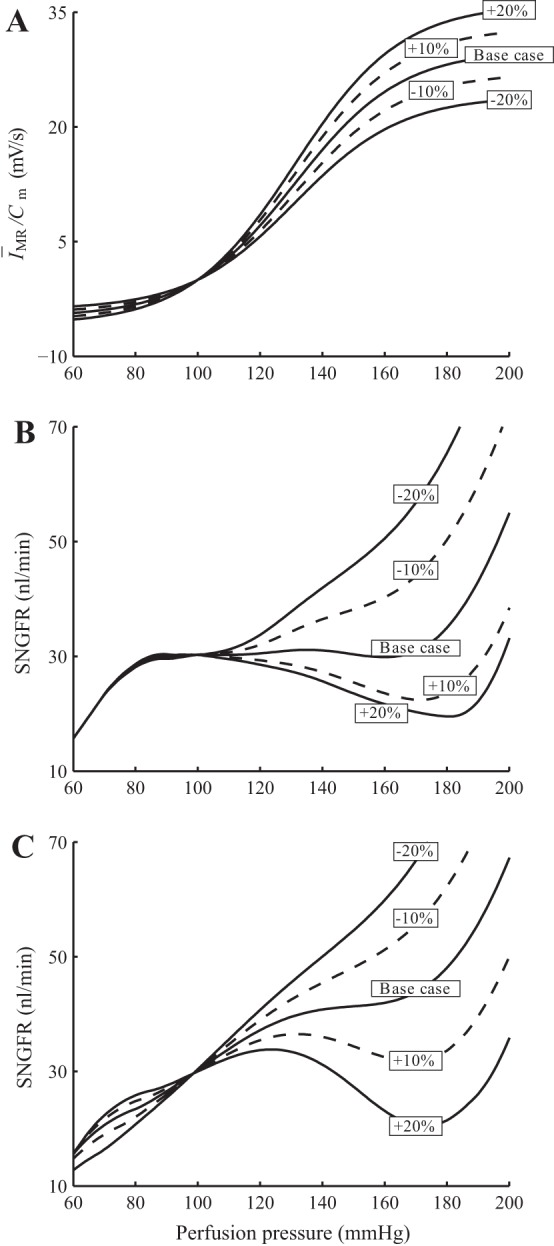
Sensitivity of model autoregulation effectiveness to variations in target myogenic current ĪMR. A: simulations are conducted with ĪMR changed by ±10 and ±20. B: SNGFR for a range of perfusion pressure with both myogenic and TGF intact. C: TGF inhibited.
Pressure natriuresis affects distal fluid and chloride delivery and thus has a substantial impact on the TGF signal. We conducted simulations in which we altered the sensitivity of proximal tubular reabsorption to perfusion pressure (see Fig. 15). We observed that the resulting autoregulation plateaus are similar to base case; compare Figs. 6 and 15. This is not surprising because, as previously noted, TGF has a significant contribution to overall autoregulation over only a narrow band of perfusion pressure. Thus it would be interesting to study how this pressure range is affected by the sensitivity of pressure natriuresis: To what extent does this range increase when the slope of the pressure natriuresis is halved? As shown in Fig. 15C, inset, reducing the pressure natriuresis slope by half increases the pressure range slightly but does not double it. Owing to the nonlinear response of the afferent arteriole smooth muscles, pressure natriuresis has a larger (but still minor) effect on SNGFR at lower perfusion pressure. Indeed, for perfusion pressure higher than 110 mmHg, variations in pressure natriuresis response have negligible impact on SNGFR.
Fig. 15.
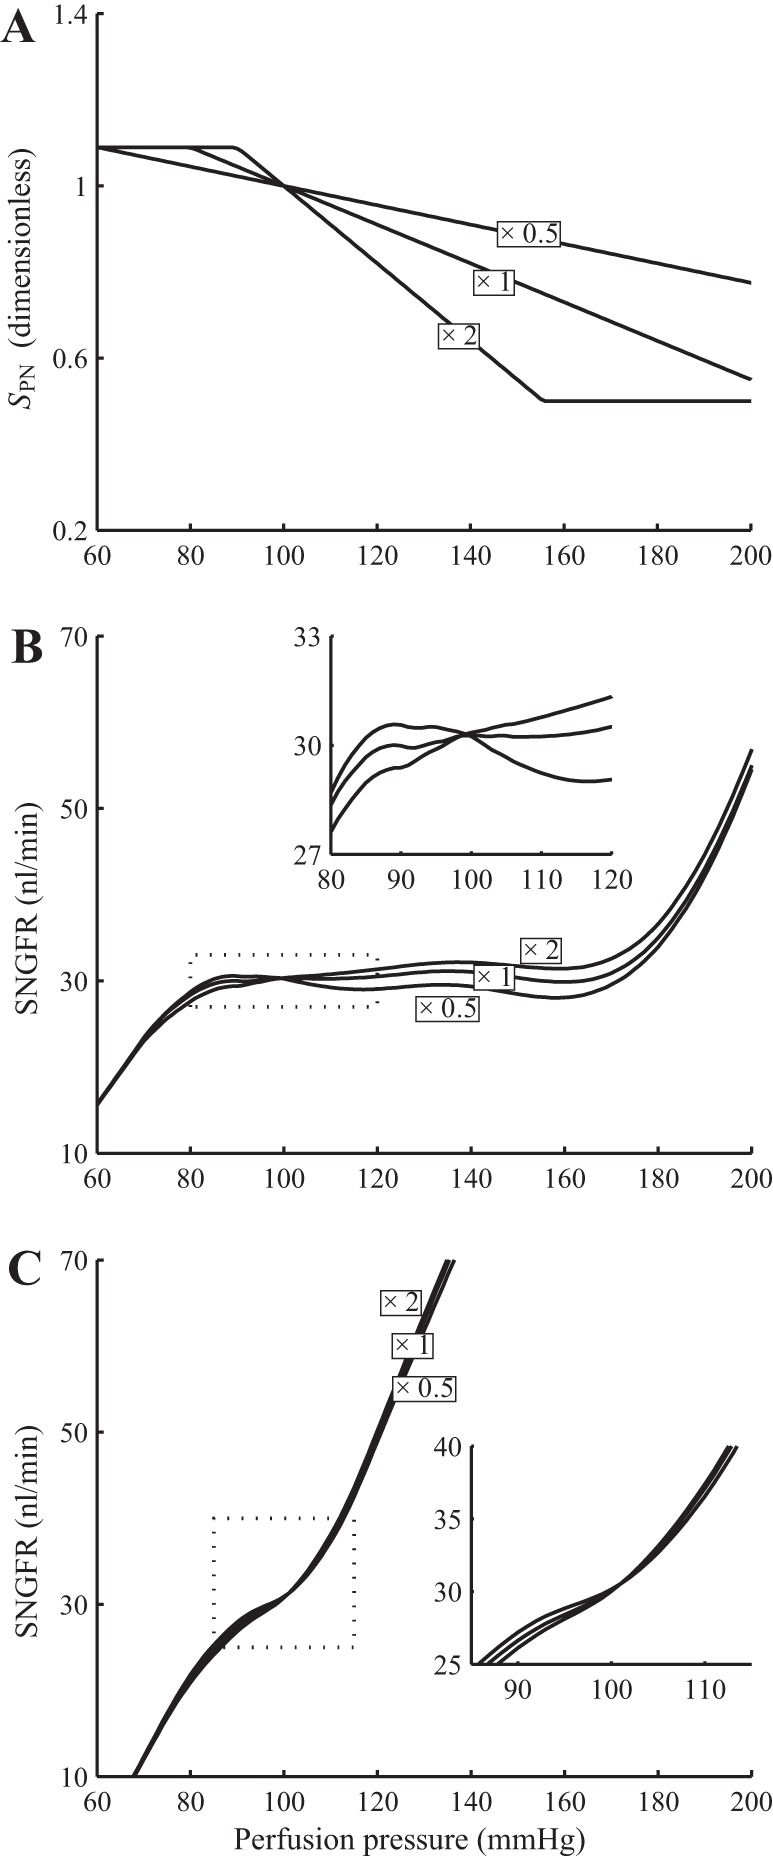
Sensitivity of TGF contribution to autoregulation to changes in pressure natriuresis response. Simulations were conducted with the slope of the pressure natriuresis response curve, denoted SPN, scaled by 1/2 and 2 (A). With both myogenic response and TGF intact, the overall autoregulation is minimally affected by changes in SPN (B). With myogenic response inhibited, a 50% reduction in SPN increases, but not doubles, the range of perfusion pressures in which TGF has a significant contribution (C).
Another potentially interesting parameter is the TGF gain, which is proportional to sTGF. As previously noted, TGF mediated oscillations in tubular flow are only predicted with sufficiently large sTGF values. Varying sTGF has little impact on overall autoregulation, measured by time-averaged SNGFR (results not shown).
DISCUSSION
Given the wide ranges in which blood pressure varies in rat and other mammals, the relative stability of renal blood flow indicates the effectiveness of autoregulation. Multiple roles have been assigned to the importance of autoregulation. By varying the arteriolar muscle tone appropriately as blood pressure fluctuates, the myogenic response functions to maintain an approximately constant renal blood flow and glomerular filtration rate (21, 23, 29, 13). For its part, TGF matches tubular load to the reabsorptive capability of the nephron (23, 21, 34). Together, the myogenic response and TGF regulate filtration and reabsorption, two processes that play a major role in determining the final urine production, and in regulating whole body salt and water balance.
Another role of autoregulation is to preserve the glomerular structure, which is a high-pressure capillary bed prone to physical injury. Indeed, studies have identified a strong correlation between transmission of high systolic pressure to the glomerulus and renal injury (18). Loutzenhiser et al. (5, 47, 29, 27, 28) suggested that, owing to the asymmetry in vasoconstriction and vasodilation myogenic response times, the afferent arteriole may sense systolic pressure at heart-beat frequency and respond with a sustained vasoconstriction when systolic pressure is elevated. Model simulations by our group and others agree with the hypothesis (10, 28, 36). This protective function of autoregulation differs from its other function previously discussed, which regulates filtration rate and which is determined primarily by mean perfusion pressure and not peak pressure. Under physiological conditions, where mean and systolic blood pressures vary in tandem, a myogenic response determined by systolic pressure would also regulate renal blood flow and glomerular filtration rate. However, under some pathophysiological conditions, where changes in systolic and mean blood pressures can be decoupled, an elevation in systolic pressure would result in myogenic vasoconstriction, even if mean perfusion pressure is unchanged or decreased.
The present model predicts that SNGFR is almost perfectly regulated for perfusion pressure within 80–180 mmHg (see Fig. 6), in good agreement with Refs. 13, 21. The contribution of TGF is significant only within a narrow band of perfusion pressures (80–110 mmHg). For pressure variations within this band, TGF contributes to up to ∼40% of the overall regulatory response, estimated by changes in vascular resistance. However, for perfusion pressures that deviate substantially from baseline, the sigmoidal response of the TGF response limits the effectiveness of the mechanism.
The present model considers an afferent arteriole and a loop of Henle in isolation. By no means do we wish to suggest that TGF in each nephron operates independently of other nephrons. Indeed, the TGF systems of nephrons whose afferent arterioles arise from a common interlobular artery are known to be coupled (19, 22), with the TGF signal propagating rapidly via the afferent arteriolar endothelium. It has been suggested that this interaction has the potential to augment the contribution of TGF to autoregulation (13). Given that internephron TGF-mediated vascular cross talk is generally constructive, it can increase the gain of the TGF response. However, the sigmoidal shape of the TGF response would still limit the contribution of TGF to the same narrow band of perfusion pressures.
The model predicts a biphasic response to a rapid pressure up-step (Fig. 8). That response is mediated by both TGF and myogenic mechanisms; indeed, when either is inhibited, the model predicts a monophasic response (Fig. 8). This result is consistent with the observations of Just (23), which assessed the time courses of vascular resistance following a rapid pressure increase, under control conditions and under partial inhibition of TGF using furosemide. One discrepancy between the simulation results and Just's measurements is that the response of the model to the pressure up-step is fully completed within 1.5 min, whereas Just observed that after 1.5 min, a small component of the response remains, which requires additional time to complete. The above discrepancy may provide evidence for the presence of other autoregulatory mechanisms, as proposed by Just (23), which are not represented in the present model.
Comparison with Previous Modeling Studies
In the past decades, much modeling effort has been directed to investigating the mechanisms that control renal blood flow (30, 31, 33, 15). Moore et al. (33) used a compartment-based integrative model to examine the hypothesis that synergistic interactions might occur between TGF and myogenic autoregulatory mechanisms. A limitation of that model is that it is formulated for steady state and does not predict transient responses. Their simulations predict strong ascending myogenic responses, in which TGF-mediated, locally induced vasoconstriction raises upstream intravascular pressure and, as a result, triggers a myogenic response in the proximal arteriolar segments. In contrast, a modeling study by Feldberg et al. (15), as well as simulations using the present model (results not shown) suggest that the impact of ascending myogenic response is negligible.
Marsh and colleagues (30, 31, 32) present a detailed and comprehensive model of renal autoregulation that represents the dynamical interactions of TGF and myogenic mechanisms. That model shares several similarities with the present model, such as the representation of the afferent arteriolar smooth muscle intracellular dynamics and glomerular filtration. A major difference between the present work and that of Refs. 30, 31, and 32 is that in the present model, the afferent arteriole responds directly to time-varying and time-independent perturbations in intravascular pressure, whereas the myogenic response in the model of Refs. 30 and 31 is activated only by time-varying pressure perturbations. Thus, with the present model, we are able to assess the autoregulatory response to different steady-state perfusion pressures (Fig. 6). Additionally, pressure natriuresis is not represented in Refs. 30, 31, and 32.
Cupples et al. (12) used a model that combines TGF and pressure natriuresis to assess the contribution of TGF to autoregulation. In that model, the sensitivity of proximal tubule reabsorption to perfusion pressure was assumed to be much higher than the present study. Consequently, the contribution of TGF to autoregulation was found to be important over a range of perfusion pressures that is wider than in the present study. It is noteworthy that the model in Cupples et al. (12) assumes a linear relationship between TGF signal and vascular resistance. In contrast, that relationship is nonlinear and indeed much more complex in the present model. Thus the results of our sensitivity studies indicate that the contribution of TGF may be much less sensitive to pressure natriuresis than previous models indicated.
The present model is an extension of an open-loop model previously developed by us (37). The open-loop model focuses on signal transduction along the afferent arteriole and the nephron and does not represent TGF. With the inclusion of both TGF and myogenic mechanisms in the present model, we are able to study the full autoregulatory process and also to assess and compare their relative contributions under steady and time-varying perfusion pressure.
Renal Hemodynamics in Diabetes Mellitus
Alterations in glomerular hemodynamics critically contribute to the pathophysiology of diabetes. Thus it is important to understand the mechanisms underlying altered autoregulation. Carmines et al. (9) found that depolarization-induced Ca2+ influx and the resulting increase in intracellular [Ca2+] are attenuated in the afferent arteriole of diabetic rats and that those responses are rapidly restored by the normalization of extracellular glucose levels. Our model predicts that minor impairment of VGC function, characterized by a 1.8-mV increase in the half-max voltage associated with the VGCs, leads to significant attenuation in the myogenic response of the afferent arteriole, resulting in glomerular hyperfiltration. In addition, fractional reabsorption of fluid and electrolytes in the proximalis increased in the early stages of diabetes in both humans (17) and experimental animals (3, 44). Such increases may lower [Cl−] at the macula densa, thereby inducing a TGF signal that increases SNGFR (through vascular dilation) and contributing to further alterations in glomerular hemodynamics in diabetes.
Model simulation results indicate that VGC impairment leads to a substantial reduction in the blood pressure range in which SNGFR can be stabilized. Nonetheless, the diabetic model retains some, if not all, of its ability to buffer blood pressure fluctuations. When fast pressure oscillations are applied, the afferent arteriole smooth muscle cells of the diabetic model generate sustained vasoconstriction, despite the VGC impairment, thereby protecting the downstream glomerular capillaries from the elevated systolic pressure, albeit perhaps not to the same degree as a healthy kidney (Fig. 13).
GRANTS
This research was supported by National Institute of Diabetes and Digestive and Kidney Diseases Grant DK-089066.
DISCLOSURES
No conflicts of interest, financial or otherwise, are declared by the author(s).
AUTHOR CONTRIBUTIONS
Author contributions: I.S. and A.T.L. conception and design of research; I.S. performed experiments; I.S. and A.T.L. analyzed data; I.S. and A.T.L. interpreted results of experiments; I.S. prepared figures; I.S. and A.T.L. drafted manuscript; I.S. and A.T.L. edited and revised manuscript; I.S. and A.T.L. approved final version of manuscript.
ACKNOWLEDGMENTS
Portions of this work were presented at Experimental Biology 2012 (FASEB J 26: 690.2, 2012) and Experimental Biology 2013 (FASEB J 27: 1110.5, 2013).
REFERENCES
- 1.Arciero JC, Carlson BE, Secomb TW. Theoretical model of metabolic blood flow regulation: roles of ATP release by red blood cells and conducted responses. Am J Physiol Heart Circ Physiol 295: H1562–H1571, 2008 [DOI] [PMC free article] [PubMed] [Google Scholar]
- 2.Arendshorst WJ, Gottschalk CW. Glomerular ultrafiltration dynamics: historical perspective. Am J Physiol Renal Fluid Electrolyte Physiol 248: F163–F174, 1985 [DOI] [PubMed] [Google Scholar]
- 3.Bank N, Aynedjian HS. Progressive increases in luminal glucose stimulate proximal sodium absorption in normal and diabetic rats. J Clin Invest 86: 309–316, 1990 [DOI] [PMC free article] [PubMed] [Google Scholar]
- 4.Bank N, Mower P, Aynedjian HS, Wilkes BM, Silverman S. Sorbinil prevents glomerular hyperperfusion in diabetic rats. Am J Physiol Renal Fluid Electrolyte Physiol 256: F1000–F1006, 1989 [DOI] [PubMed] [Google Scholar]
- 5.Bidani AK, Griffin KA, Williamson G, Wang X, Loutzenhiser R. Protective importance of the myogenic response in the renal circulation. Hypertension 54: 393–398, 2009 [DOI] [PMC free article] [PubMed] [Google Scholar]
- 6.Carlson BE, Arciero JC, Secomb TW. Theoretical model of blood flow autoregulation: roles of myogenic, shear-dependent, and metabolic responses. Am J Physiol Heart Circ Physiol 295: H1572–H1579, 2008 [DOI] [PMC free article] [PubMed] [Google Scholar]
- 7.Carlson BE, Secomb TW. A theoretical model for the myogenic response based on the length-tension characteristics of vascular smooth muscle. Microcirculation 12: 327–338, 2005 [DOI] [PubMed] [Google Scholar]
- 8.Carmines PK, Inscho EW, Gensure RC. Arterial pressure effects on preglomerular microvasculature of juxtamedullary nephrons. Am J Physiol Renal Fluid Electrolyte Physiol 258: F94–F102, 1990 [DOI] [PubMed] [Google Scholar]
- 9.Carmines PK, Ohishi K, Ikenaga H. Functional impairment of renal afferent arteriolar voltage-gated calcium channels in rats with diabetes mellitus. J Clin Invest 98: 2564–2571, 1996 [DOI] [PMC free article] [PubMed] [Google Scholar]
- 10.Chen J, Sgouralis I, Moore LC, Layton HE, Layton AT. A mathematical model of the myogenic response to systolic pressure in the afferent arteriole. Am J Physiol Renal Physiol 300: F669–F681, 2011 [DOI] [PMC free article] [PubMed] [Google Scholar]
- 11.Cortell S, Gennari FJ, Davidman M, Bossert WH, Schwartz WB. A definition of proximal and distal tubular compliance practical and theoretical implications. J Clin Invest 52: 2330–2339, 1973 [DOI] [PMC free article] [PubMed] [Google Scholar]
- 12.Cupples WA, Wexler AS, Marsh DJ. Model of TGF-proximal tubule interactions in renal autoregulation. Am J Physiol Renal Fluid Electrolyte Physiol 259: F715–F726, 1990 [DOI] [PubMed] [Google Scholar]
- 13.Cupples WA, Braam B. Assessment of renal autoregulation. Am J Physiol Renal Physiol 292: F1105–F1123, 2007 [DOI] [PubMed] [Google Scholar]
- 14.Deen WM, Robertson CR, Brenner BM. A model of glomerular ultrafiltration in the rat. Am J Physiol 223: 1178–1183, 1972 [DOI] [PubMed] [Google Scholar]
- 15.Feldberg R, Colding-Jorgensen M, Holstein-Rathlou NH. Analysis of interaction between TGF and the myogenic response in renal blood flow autoregulation. Am J Physiol Renal Fluid Electrolyte Physiol 269: F581–F593, 1995 [DOI] [PubMed] [Google Scholar]
- 16.Flemming B, Arenz N, Seeliger E, Wronski T, Steer K, Persson PB. Time-dependent autoregulation of renal blood flow in conscious rats. J Am Soc Nephrol 12: 2253–2262, 2001 [DOI] [PubMed] [Google Scholar]
- 17.Hannedouche TP, Delgado AG, Gnionsahe DA, Boitard C, Grünfeld JP. Renal hemodynamics and segmental tubular sodium reabsorption in early type I diabetes. Kidney Int 37: 1126–1133, 1990 [DOI] [PubMed] [Google Scholar]
- 18.He J, Whelton PK. Elevated systolic blood pressure and risk of cardiovascular and renal disease: overview of evidence from observational epidemiologic studies and randomized controlled trials. Am Heart J 138: 211–219, 1999 [DOI] [PubMed] [Google Scholar]
- 19.Holstein-Rathlou NH. Synchronization of proximal intratubular pressure oscillations: evidence for interaction between nephrons. Pflügers Arch 408: 438–443, 1987 [DOI] [PubMed] [Google Scholar]
- 20.Holstein-Rathlou NH. A closed-loop analysis of the tubuloglomerular feedback mechanism. Am J Physiol Renal Fluid Electrolyte Physiol 261: F880–F889, 1991 [DOI] [PubMed] [Google Scholar]
- 21.Holstein-Rathlou NH, Marsh DJ. Renal blood flow regulation and arterial pressure fluctuations: a case study in nonlinear dynamics. Physiol Rev 74: 637–681, 1994 [DOI] [PubMed] [Google Scholar]
- 22.Holstein-Rathlou NH, Sosnovtseva OV, Pavlov AN, Cupples WA, Sorensen CM, Marsh DJ. Nephron blood flow dynamics measured by laser speckle contrast imaging. Am J Physiol Renal Physiol 300: F319–F329, 2011 [DOI] [PMC free article] [PubMed] [Google Scholar]
- 23.Just A. Mechanisms of renal blood flow autoregulation: dynamics and contributions. Am J Physiol Regul Integr Comp Physiol 292: R1–R17, 2007 [DOI] [PubMed] [Google Scholar]
- 24.Layton AT, Pham P, Ryu HY. Signal transduction in a compliant short loop of Henle. Int Numer Method Biomed Eng 28: 369–383, 2012 [DOI] [PMC free article] [PubMed] [Google Scholar]
- 25.Layton HE, Pitman EB, Moore LC. Bifurcation analysis of TGF-mediated oscillations in SNGFR. Am J Physiol Renal Fluid Electrolyte Physiol 261: F904–F919, 1991 [DOI] [PubMed] [Google Scholar]
- 26.Layton HE, Pitman EB, Moore LC. Instantaneous and steady-state gains in the tubuloglomerular feedback system. Am J Physiol Renal Fluid Electrolyte Physiol 268: F163–F174, 1995 [DOI] [PubMed] [Google Scholar]
- 27.Loutzenhiser R, Bidani AK, Wang X. Systolic pressure and the myogenic response of the renal afferent arteriole. Acta Physiol Scand 181: 407–413, 2004 [DOI] [PubMed] [Google Scholar]
- 28.Loutzenhiser R, Bidani AK, Chilton L. Renal myogenic response: kinetic attributes and physiological role. Circ Res 90: 1316–24, 2002 [DOI] [PubMed] [Google Scholar]
- 29.Loutzenhiser R, Griffin K, Williamson G, Bidani AK. Renal autoregulation: new perspectives regarding the protective and regulatory roles of the underlying mechanisms. Am J Physiol Regul Integr Comp Physiol 290: R1153–R1167, 2006 [DOI] [PMC free article] [PubMed] [Google Scholar]
- 30.Marsh DJ, Sosnovtseva OV, Chon KH, Holstein-Rathlou NH. Nonlinear interactions in renal blood flow regulation. Am J Physiol Regul Integr Comp Physiol 288: R1143–R1159, 2005 [DOI] [PubMed] [Google Scholar]
- 31.Marsh DJ, Sosnovtseva OV, Pavlov AN, Yip KP, Holstein-Rathlou NH. Frequency encoding in renal blood flow regulation. Am J Physiol Regul Integr Comp Physiol 288: R1160–R1167, 2005 [DOI] [PubMed] [Google Scholar]
- 32.Marsh DJ, Toma I, Sosnovtseva OV, Peti-Peterdi J, Holstein-Rathlou NH. Electrotonic vascular signal conduction and nephron synchronization. Am J Physiol Renal Physiol 296: F751–F761, 2009 [DOI] [PMC free article] [PubMed] [Google Scholar]
- 33.Moore LC, Rich A, Casellas D. Ascending myogenic autoregulation: interactions between tubuloglomerular feedback and myogenic mechanisms. Bull Math Biol 56: 391–410, 1994 [DOI] [PubMed] [Google Scholar]
- 34.Navar LG. Renal autoregulation: perspectives from whole kidney and single nephron studies. Am J Physiol Renal Fluid Electrolyte Physiol 234: F357–F370, 1978 [DOI] [PubMed] [Google Scholar]
- 35.Ren Y, Garvin JL, Liu R, Carretero OA. Crosstalk between the connecting tubule and the afferent arteriole regulates renal microcirculation. Kidney Int 71: 1116–1121, 2007 [DOI] [PubMed] [Google Scholar]
- 36.Sgouralis I, Layton AT. Autoregulation and conduction of vasomotor responses in a mathematical model of the rat afferent arteriole. Am J Physiol Renal Physiol 303: F229–F239, 2012 [DOI] [PMC free article] [PubMed] [Google Scholar]
- 37.Sgouralis I, Layton AT. Control and modulation of fluid flow in the rat kidney. Bull Math Biol 75: 2551–2274, 2013 [DOI] [PMC free article] [PubMed] [Google Scholar]
- 38.Shipley RE, Study RS. Changes in renal blood flow, extraction of inulin, glomerular filtration rate, tissue pressure and urine flow with acute alterations of renal artery blood pressure. Am J Physiol 167: 676–88, 1951 [DOI] [PubMed] [Google Scholar]
- 39.Siu KL, Sung B, Cupples WA, Moore LC, Chon KH. Detection of low-frequency oscillations in renal blood flow. Am J Physiol Renal Physiol 297: F155–F162, 2009 [DOI] [PubMed] [Google Scholar]
- 40.Thomson SC, Deng A, Bao D, Satriano J, Blantz RC, Vallon V. Ornithine decarboxylase, kidney size, and the tubular hypothesis of glomerular hyperfiltration in experimental diabetes. J Clin Invest 107: 217–224, 2001 [DOI] [PMC free article] [PubMed] [Google Scholar]
- 41.Thomson SC, Vallon V, Blantz RC. Resetting protects efficiency of tubuloglomerular feedback. Kidney Int Suppl 67: S65–70, 1998 [DOI] [PubMed] [Google Scholar]
- 42.Thomson SC, Blantz RC. Glomerulotubular balance, tubuloglomerular feedback, and salt homeostasis. J Am Soc Nephrol 19: 2272–2275, 2008 [DOI] [PubMed] [Google Scholar]
- 43.Vallon V. The proximal tubule in the pathophysiology of the diabetic kidney. Am J Physiol Regul Integr Comp Physiol 300: R1009–R1022, 2011 [DOI] [PMC free article] [PubMed] [Google Scholar]
- 44.Vallon V, Blantz RC, Thomson SC. Homeostatic efficiency of tubuloglomerular feedback is reduced in established diabetes mellitus in rats. Am J Physiol Renal Fluid Electrolyte Physiol 269: F876–F883, 1995 [DOI] [PubMed] [Google Scholar]
- 45.Vallon V, Thomson SC. Renal function in diabetic disease models: the tubular system in the pathophysiology of the diabetic kidney. Annu Rev Physiol 74: 351–75, 2012 [DOI] [PMC free article] [PubMed] [Google Scholar]
- 46.van Dokkum RP, Sun CW, Provoost AP, Jacob HJ, Roman RJ. Altered renal hemodynamics and impaired myogenic responses in the fawn-hooded rat. Am J Physiol Renal Physiol 276: F855–F863, 1999 [DOI] [PubMed] [Google Scholar]
- 47.Williamson GA, Loutzenhiser R, Wang X, Griffin K, Bidani AK. Systolic and mean blood pressures and afferent arteriolar myogenic response dynamics: a modeling approach. Am J Physiol Regul Integr Comp Physiol 295: R1502–R1511, 2008 [DOI] [PubMed] [Google Scholar]


