

Abstract
So far, little is known about the effect of nutrition and lifestyle on the composition of circulating lipoprotein subfractions. In the current study, we measured the correlations among physical activity, nutrient intake, smoking, body-mass index (BMI), and age with the concentration of triglycerides, cholesterol, phospholipids, and apolipoproteins (ApoA1, ApoA2 and ApoB) in subfractions of LDL and HDL in 265 healthy working men. Concentrations of cholesterol, phospholipids, and ApoB in small, dense atherogenic LDL particles (sdLDL) correlated negatively (p<0.001) with those of cholesterol, phospholipids, and ApoA1 in HDL2, respectively. Age correlated positively with sdLDL while increasing BMI correlated with an atherogenic shift of cholesterol, phospholipids, and ApoB from large, buoyant LDL (lbLDL) to sdLDL and decreasing concentrations of HDL2 constituents. Physical activity and alcohol intake correlated negatively with sdLDL constituents and positively with HDL2 components. Consumption of monounsaturated fatty acids (MUFA) correlated with a lower ratio of sdLDL to HDL2 cholesterol. A favorable lipoprotein subfraction profile linked to a reduced risk of cardiovascular disease in men was associated with physical activity, moderate alcohol consumption, and dietary intake of MUFA, which might be exploited in future interventions for prevention of age- and BMI-associated atherogenic shifts of lipoprotein subfractions.
Keywords: lipoprotein subfractions, small dense lipoprotein particles, atherogenic shift, nutrition, body-mass index
Introduction
Cardiovascular disease (CVD) is the main cause of death in developed countries.(1) Besides increasing age, male gender, hypertension, smoking, diabetes, and hypercoagulation, it is generally accepted that dyslipidaemia is a major risk factor for CVD.(2) Extensive studies have established that elevated concentrations of circulating low-density lipoprotein cholesterol (LDL-C) and non-high-density lipoprotein cholesterol (non-HDL-C) are strong indicators for developing atherosclerosis and upcoming CVD.(3) This holds also true for circulating concentrations of total apolipoprotein B (ApoB) and other apoB-containing lipoproteins, such as VLDL and IDL.(4) As evidenced by numerous intervention studies, lowering LDL-C reduces the probability of CVD events.(5) Conversely, the protective role of HDL-C in CVD development has been generally accepted.(6) Increasing attention is not only paid to cholesterol in these lipoprotein classes, but also to other constituents such as triglycerides (T),(7) phospholipids (P),(8) and apolipoproteins (ApoA1/2, ApoB, ApoC1/2, Apo(a) and ApoE).(9) In non-pharmacological intervention studies, increased physical activity and restricted availability of calories have been shown to reduce LDL-cholesterol.(10) On the other hand, moderate alcohol consumption (<60 g/day) and physical activity seem to be the only factors capable of increasing cardio-protective HDL-cholesterol.(6,8,11)
Analytic ultracentrifugation techniques led to identification of 3–6 subfractions of LDL that comprise small, dense atherogenic particles (sdLDL), which were proven to predict CVD risk better than total LDL.(12,13) Accordingly, the protective effect of high HDL against CVD is almost exclusively linked to the subfraction of large HDL2 particles, but not to the small, dense HDL3 subspecies.(14)
A condition in which reduced levels of large buoyant LDL particles (lbLDL) occur along with an increased concentration of sdLDL particles, reduced HDL-C, and elevated concentrations of plasma triglycerides has been referred to define the term “atherogenic dyslipidemia”.(15) The improvement of lipoprotein composition is one of the major goals of pharmacological, dietary, and lifestyle interventions aiming at reduction of atherosclerotic plaque formation leading to CVD.(16)
A holistic comprehensive multivariate analysis of the effects of nutrient intake and other lifestyle factors on the concentrations of lipoprotein subclasses, which are relevant for CVD development, is missing so far. This cross-sectional study in a large group of healthy working males was designed to determine the association between different factors of lifestyle including nutrition and anthropometry on the composition of main fractions and subfractions of LDL and HDL. Moreover, the current study focuses on the association of the major constituents of these subfractions, which are C, P, T, and the corresponding apolipoproteins.
Materials and Methods
Study participants
This study was performed according to the guidelines of the Declaration of Helsinki from 1975, as revised 1983, and was approved by the Ethical Review Board of University of Tübingen. After giving informed consent, 290 apparently healthy male working volunteers (age: 20–67 years) were recruited at their working place (63% car industry, 12% wine factory, 18% brewery, and 7% health care staff and others). Within a few days later, an individual personal computer-guided and recorded interview (~1 h) was performed by an experienced nutritionist to determine the average nutrient intake, smoking habits, and physical activity level over the recent months.
Of the 290 recruited persons, 25 were excluded for various reasons: self-reported previous myocardial infarction or ischemic stroke, higher than moderate (⩾60 g/d) or highly irregular alcohol consumption, unreliable diet history, antihyperlipidemic medication, and self-reported dramatic changes of social situation over the previous weeks (death of a close relative, divorce, etc.).
Nutritional evaluation
An experienced interviewer carefully reviewed the average intake of food and (alcoholic) beverages using a computer-based system (NutriSurvey/EBIS ver. 7.0, E&D Partner, Willstätt-Legelshurst, Germany), which has been approved in previous studies.(17) The interview was based on a step-by-step interrogation on common eating habits and portion sizes over a typical daily timeline. Portion sizes of prepared foods (potatoes, pasta, rice, meat, etc.) on a standardized plate were assessed by comparison of photographs that showed portions that differed by 50 g. Nutrient intake from all foods consumed was analyzed using the national German nutrition inventory database (BLS ver. 2.1) comprising nutrient contents of more than 11,000 food items/recipes. The evaluations included the daily intake of macronutrients, alcohol, fiber, cholesterol, 13 vitamins, and 7 minerals/trace elements. The physical activity level (PAL) was assessed based on a 7-level scale ranging from resting to vigorous physical exercise and was calculated on the basis of duration and intensity by the help of the corresponding module of the applied software (EBIS). The resting energy level (REE) was calculated due to Schofield and colleagues.(18) The energy demand (ED) for each subject was calculated from the resting energy level (REE) and physical activity level (PAL) [ED = (REE + PAL) × 1.06]. Besides the diet history, anthropometric data (age, height and body mass) and smoking habits were recorded in parallel.
Laboratory analyses of blood samples
At first date of examination, blood samples were collected in EDTA-pretreated vacutainers after an overnight fast and blood plasma was obtained after centrifugation at 4,000 rpm (10 min). Main fractions of lipoproteins [VLDL (d<1.006 kg/L), IDL, LDL (d = 1.019 to 1.063 kg/L), and HDL (d = 1.063 to 1.21 kg/L)] were isolated from 6 ml plasma using step-wise preparative ultracentrifugation (50.3 Ti rotor, L8-55M centrifuge; Beckman, Krefeld, Germany). The VLDL fraction was obtained by removal of the top 2 ml-layer after centrifugation of plasma (22 h at 40,000 rpm, 17°C). The IDL fraction was attained after addition of 2 ml aqueous NaBr solution (ρ = 1,0443 kg/L) followed by an additional centrifugation (20 h, 45,000 rpm, 17°C) as the top layer (2 ml). The LDL and HDL fractions were achieved accordingly by step-wise addition of 2 ml of NaBr solutions with the densities of ρ = 1,1468 kg/L and ρ = 1,4699 kg/L followed by an additional centrifugation.(19) All main fractions were analyzed individually for their content of cholesterol, triglycerides, and phospholipids using an auto analyzer (AU 640, Olympus, Hamburg, Germany) with the corresponding enzymatic assays (Wako Chemicals, Neuss, Germany), while apolipoproteins [ApoA1, ApoA2, ApoB, ApoC2, ApoC3, ApoE, and Apo(a)] were determined immuno-turbidimetrically.(20) Antibodies against apolipoproteins were from Greiner Biochemica (Flacht, Germany) or from Kamiya (Biomedical, Seattle, IL). In order to obtain sub-fractions of LDL, 1 ml of the isolated LDL fraction was dialyzed (24 h, 4°C) in an aqueous solution of NaCl (ρ = 1,0063 kg/L: 11.45 g NaCl, 0.5 g NaN3, and 100 mg EDTA) and adjusted to a final volume of 6 ml with this solution. After ultracentrifugation (50,000 rpm, 18°C) for 48 h, a density gradient formed ranging from ρ = 1,0028 to ρ = 1,0047 kg/L. From top to down, each ml contained the corresponding LDL subfraction (LDL-1, less than 1.031 kg/L; LDL-2, 1.031–1.034 kg/L; LDL-3, 1.034–1.037 kg/L; LDL-4, 1.037–1.040 kg/L; LDL-5, 1.040–1.044 kg/L; and LDL-6, higher than 1.044 kg/L), in which the same parameters were analyzed as in the main fractions. The sub-fractions of HDL (HDL-2b, 1.063–1.100 kg/L; HDL-2a, 1.100–1.150 kg/L, and HDL-3, 1.150–1.210 kg/L) were analyzed accordingly after dialysis of 1 ml of the HDL main fraction (diluted with 790 µl of the NaCl solution mentioned above (ρ = 1,0063 kg/L) and 4.21 ml of a ρ = 1,110 kg/L NaCl solution), ultracentrifugation (50,000 rpm, 18°C, 48 h), and step-wise sampling of the three top 1.5 ml portions. All measurements were corrected for recovery. Average concentrations of components in LDL-1 and LDL-2 are given as those occurring in lbLDL and average concentrations of components in LDL-5 and LDL-6 are given as those measured in sdLDL.
Statistics
Results are reported as average ± SE. All statistical evaluations (descriptive statistics, Spearman’s correlation test, reliability analysis and Ridge regression) were performed with Statistica (ver. 9.1, StatSoft, Tulsa, OK). All statistical methods chosen (Ridge regression with α set to 0.1, reliability analysis) were selected to minimize the probability of false-positive findings (alpha-errors) due to repeated use of variables in correlation calculations and in order to minimize bias caused by autocorrelations of dependent/independent variables. Correlations were considered as significant if the p value was below 0.05. Heatmaps were generated with the Matrix2png online tool.(21)
Results
General characteristics
The general anthropometric and lifestyle characteristics including the intake of nutrients of the 265 Caucasian male working study participants are listed in Table 1. Fourteen per cent of the participants were smokers. Of the total participants, 121 (45.7%) were categorized as overweight (BMI: 25.1–30 kg/m²), while 18 (6.8%) were categorized as obese (BMI>30 kg/m²). The study participants showed a typical pattern of a Westernized diet with too high intakes of fat, refined sugar, and sodium and insufficient intakes of folic acid and vitamin D. The measured results are grouped into three categories: (i) absolute concentrations of lipoprotein constituents (cholesterol, C; triglycerides, T; phospholipids, P; and apolipoproteins, Apo) in plasma, (ii) the concentration of these constituents in the main fractions of circulating lipoproteins (VLDL, IDL, LDL, and HDL) and its dependence on anthropometrical and lifestyle factors, and (iii) the shifting of lipoprotein constituents among the subfractions of LDL (lbLDL and sdLDL) and HDL (HDL3 and HDL2) along with anthropometrical and lifestyle factors. All results presented are optimized towards avoidance of bias caused by autocorrelation of dependent and independent variables by using Ridge regression and reliability analysis.
Table 1.
Anthropometric and lifestyle factors of the involved 265 healthy working European men
| Anthropometric factor/Intake [Unit] | Abbreviation | Min. | Max. | Mean | SE | Recommended intakes (RI) (WHO) for males 25–65 y | Average relative achievement of RI |
|---|---|---|---|---|---|---|---|
| Age [y] | Age | 23 | 68 | 43.6 | 0.63 | ||
| Body-mass index [kg/m²] | BMI | 17.5 | 39 | 25.1 | 0.2 | <25 | |
| Smoking [cigarettes/day] | Smoking | 0 | 40 | 1.5 | 0.33 | 0 | |
| Physical activity expenditure [kcal/day] | ActEnExp | 520 | 2,151 | 911 | 14.4 | — | |
| Calorie intake [kcal/day] (without calories from alcohol) | Cal_Int_woAlc | 1,268 | 4,800 | 2,613 | 26.7 | 2,451 | |
| Alcohol [g/day] | Alc_Int | 0 | 58.4 | 16.6 | 0.82 | max. 20 | 83% |
| Water [g/day] | Water_Int | 1,461 | 5,321 | 2,959 | 38.9 | — | |
| Protein [g/day] | Prot_Int | 47 | 178 | 99 | 1.1 | 52.5 | 189% |
| Fat [g/day] | Fat_Int | 48 | 193 | 115 | 1.58 | 54.4–95.3 | 121% |
| Carbohydrates [g/day] | Carb_Int | 139 | 643 | 289 | 3.85 | 306–367 | 94% |
| Sucrose [g/day] | Sucr_Int | 8.7 | 283 | 68.1 | 1.94 | <35 | 194% |
| Fiber [g/day] | Fiber_Int | 9.5 | 48.5 | 25 | 0.41 | 30 | 83% |
| Saturated fatty acids [g/day] | SatFA_Int | 16.3 | 91.7 | 50.9 | 0.85 | max. 27 | 187% |
| Monounsaturated fatty acids [g/day] | MUFA_Int | 15.3 | 72.9 | 37.9 | 0.55 | max. 54 | 65% |
| Polyunsaturated fatty acids [g/day] | PUFA_Int | 7.2 | 40.1 | 17.9 | 0.39 | max. 27 | 66% |
| Cholesterol [mg/day] | C_Int | 129 | 668 | 353 | 5.5 | — | |
| Sodium [mg/day] | Sodium_Int | 2,092 | 8,972 | 5,310 | 73.8 | 2,000 | 265% |
| Potassium [mg/day] | K_Int | 1,741 | 5,695 | 3,434 | 39.1 | 3,510 | 98% |
| Calcium [mg/day] | Ca_Int | 339 | 3,221 | 1,409 | 28.3 | 1,000 | 141% |
| Magnesium [mg/day] | Mg_Int | 247 | 800 | 507 | 6.36 | 260 | 195% |
| Iron [mg/day] | Iron_Int | 8.3 | 28.7 | 15.9 | 0.18 | 11 | 145% |
| Zinc [mg/day] | Zinc_Int | 7.2 | 28.7 | 14.8 | 0.18 | 7 | 212% |
| Iodine [mcg/day] | Iod_Int | 49 | 276 | 114 | 1.98 | 130 | 88% |
| Vitamin A [mcg/day] | Vit_A_Int | 444 | 4,670 | 1,380 | 31.7 | 600 | 230% |
| Vitamin B1 [mg/day] | Vit_B1_Int | 0.77 | 2.56 | 1.51 | 0.02 | 1.2 | 126% |
| Vitamin B2 [mg/day] | Vit_B2_Int | 0.98 | 3.69 | 1.81 | 0.03 | 1.3 | 139% |
| Vitamin B6 [mg/day] | Vit_B6_Int | 1.22 | 3.00 | 1.93 | 0.02 | 1.5 | 129% |
| Vitamin B12 [mcg/day] | Vit_B12_Int | 0.22 | 13.4 | 4.17 | 0.10 | 2.4 | 174% |
| Vitamin C [mg/day] | Vit_C_Int | 37 | 339 | 121 | 3.16 | 45 | 268% |
| Vitamin D [mcg/day] | Vit_D_Int | 0.3 | 7.55 | 2.02 | 0.08 | 7.5 | 27% |
| Vitamin E [mg/day] | Vit_E_Int | 4.2 | 31.6 | 12 | 0.25 | 10 | 120% |
| Vitamin K [mcg/day] | Vit_K_Int | 114 | 744 | 309 | 4.74 | 65 | 476% |
| Biotin [mcg/day] | Biotin_Int | 17 | 80 | 45 | 0.72 | 30 | 150% |
| Folic Acid [mcg/day] | FolA_Int | 39 | 247 | 130 | 1.94 | 400 | 32% |
| Panthotenic acid [mg/day] | Pantho_Int | 3.04 | 9.44 | 5.52 | 0.06 | 5 | 110% |
| Niacin [mg/day] | Niacin_Int | 9.3 | 32.7 | 18.2 | 0.23 | 16 | 114% |
| Beer (g alcohol/day) | — | 0 | 52.8 | 8.2 | 0.63 | — | — |
| Wine (g alcohol/day) | — | 0 | 54.9 | 7.9 | 0.59 | — | — |
Associations of components in lipoprotein main fractions and subfractions
As evident from Fig. 1 and Supplemental Table 1 and 2*, Spearman’s analysis indicates a high collinearity of C, P, and the characteristic apolipoproteins (ApoB/ApoA1, respectively) in the main lipid fractions VLDL, IDL, HDL, LDL, and in the subfractions lbLDL, sdLDL, and HDL2. The multicollinearity of these three components is confirmed by reliability analysis (standardized Cronbach’s alpha: VLDL, 0.984; IDL, 0.959; lbLDL, 0.995; sdLDL, 0.996; HDL2ab, 0.994). Hence, the high covariation of the triplet of C, P, and the corresponding apolipoprotein makes it a homogeneous component factor in all investigated lipoprotein (sub-)fractions. In contrast to the C-P-apolipoprotein triplet, triglyceride concentrations (T) correlated to a comparable extent with this triplet only in VLDL, IDL, and in the sdLDL fraction, but not in HDL, HDL2, or in lbLDL (Supplemental Table 1, 2*, and Fig. 1). The closely associated concentrations of C, P, and ApoA1 in HDL2 correlated positively with C, P, and ApoB portions of lbLDL, but negatively with constituents of sdLDL particles (Fig. 1D and Supplemental Table 2*).
Fig. 1.
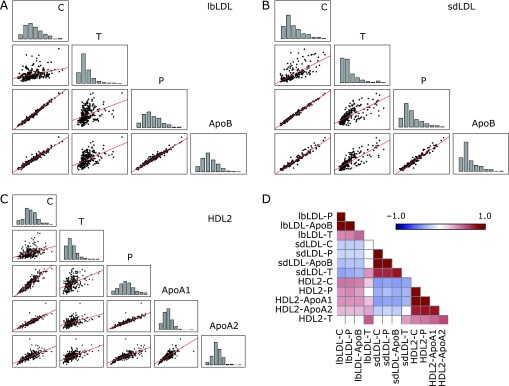
Intercorrelations of lipoprotein components (cholesterol—C, phospholipids—P, triglycerides—T, and apolipoproteins—ApoB, ApoA1, and ApoA2) in lbLDL (A), in sdLDL (B), and in HDL2 (C). Interactions of all lipoprotein components in all subfractions are depicted as a heat map (D) showing clearly that C, P, ApoA1, and ApoB form a uniformly varying triplet in sdLDL, lbLDL, and HDL2, respectively. Fields showing significant negative correlations are kept blue; those showing significant positive correlations are red. For exact numbers, see Supplemental Table 2.
Correlations of age, BMI, smoking, and nutrition with plasma concentrations of lipoprotein constituents
Ridge regression of anthropometrical factors and lifestyle variables vs lipoprotein constituents in plasma revealed that increasing age primarily correlated with elevated concentrations of the C/P/ApoB triplet. In contrast, an elevated BMI predominantly correlated with an increasing plasma concentration of T and a decreased level of ApoA1 (Fig. 2A and Supplemental Table 3*). Physical activity was inversely correlated with the plasma concentration of ApoB. An increasing alcohol intake was associated with increasing plasma concentrations of ApoA1, ApoA2, and plasma phospholipids and with declining concentrations of ApoB. Plasma concentrations of C, P, ApoC2, ApoC3, and ApoA1 were inversely correlated with a high intake of carbohydrates. Significant correlations with a moderate effect size were also found for plasma concentrations of ApoB, ApoC2, and ApoC3 with the intake of PUFA and a few vitamins (i.e., vitamin A and biotin).
Fig. 2.
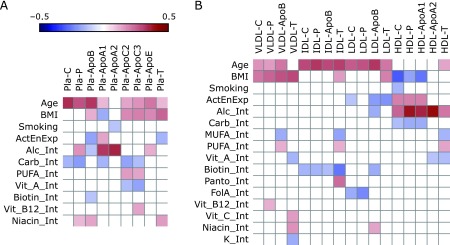
Correlations among plasma and main fraction concentrations of lipoprotein constituents and lifestyle/anthropometric factors. Heatmaps indicate significant (p<0.05) correlation coefficients between anthropometrical/lifestyle factors and concentrations of C, P, T, ApoB, ApoA1, ApoA2, ApoC2, ApoC3, and ApoE in plasma (A) and in main lipoprotein fractions (B) (here: ApoB, ApoA1, and ApoA2 only). Fields indicating non-significant correlations were left empty. Fields showing significant negative correlations are kept blue; those showing significant positive correlations are red. For exact numbers, see Supplemental Table 3 and 4. Abbreviations are used as indicated in Table 1.
Effect of age, BMI, smoking, and nutrition on composition of main lipoprotein fractions
Focusing on the main lipoprotein fractions, it became evident that increasing age was associated with elevated levels of the C-P-apolipoprotein triplet in VLDL, IDL, and LDL, but not in HDL. Increasing BMI correlated positively with concentrations of all VLDL constituents and negatively with concentrations of C, P, and ApoA1 in HDL (Fig. 2B and Supplemental Table 4*). Conversely, physical activity was associated with elevated levels of C, P, and ApoA1 in HDL, but also with diminished levels of C, ApoB, and T in LDL. The intake of some micronutrients (i.e., biotin and folic acid) correlated negatively with several components of circulating IDL and with ApoB in LDL. The highest effect sizes were found for alcohol intake, which closely paralleled all measured components of HDL and negatively correlated with ApoB in LDL.
Effect of age, BMI, smoking, and nutrition on composition of lipoprotein subfractions
In-depth analysis of subfractions of lbLDL, sdLDL, and HDL2 revealed that increasing age correlated positively with concentrations of all constituents of sdLDL as well as with those of the lbLDL (Fig. 3A and Supplemental Table 5*). By contrast, an increasing BMI was associated with a shift of the C/P/ApoB triplet from lbLDL particles to sdLDL and with a reduction of the C-P-ApoA1 triplet in HDL, representing a situation that has been termed an atherogenic shift.(15) Hence, the effects of age and BMI on lipoprotein constituents observed at the subfraction level differ essentially from the shifts occurring in the main fractions.
Fig. 3.

Correlations among subfraction concentrations of lipoprotein constituents, their ratios and lifestyle/anthropometric factors. Heatmaps indicate significant (p<0.05) correlation coefficients between anthropometrical/lifestyle factors and concentrations of C, P, T, ApoB, ApoA1, and ApoA2 in subfractions of lipoproteins in plasma (A) and ratios of lipoprotein components (C, ApoB, and ApoA1) in sdLDL, lbLDL and HDL2 (B). Fields indicating non-significant correlations were left empty. Fields showing significant negative correlations are kept blue, those showing significant positive correlations are red. For exact numbers, see Supplemental Table 5 and 6. Abbreviations are used as indicated in Table 1.
The negative correlation between the C-P-ApoB triplet and the intake of some vitamins (i.e., vitamin B6, folic acid, and vitamin D) was limited to lbLDL. Both physical activity and moderate alcohol intake showed a moderate, negative correlation to all measured constituents of sdLDL. The highest effect sizes were calculated for the positive correlation of alcohol intake and the concentration of all HDL2 constituents, which was opposed to the inverse correlations of BMI or carbohydrate consumption with the components in this subfraction (Fig. 3A and Supplemental Table 5*).
Effect of age, BMI, smoking, and nutrition on ratios of lipoprotein subfractions that indicate an atherogenic shift
The ratio of cholesterol concentration in LDL to that in HDL (LDL-C/HDL-C), which positively correlated with age and BMI, was inversely associated with physical activity, alcohol intake, and the intake of biotin (Fig. 3B and Supplemental Table 6*). Likewise, the ratio of cholesterol concentrations in sdLDL to that in HDL2 (sdLDL-C/HDL2-C) correlated positively with age, BMI, and sodium intake but negatively with physical activity and alcohol intake. The ratio of C in sdLDL to C in lbLDL (sdLDL-C/lbLDL-C) correlated negatively to the intake of MUFA, but positively to that of BMI and the intakes of vitamins B1/D. Hence, the atherogenic shift within LDL is mainly subjected to BMI and physical activity, while the part of the atherogenic shift that affects the balance between sdLDL and HDL2 is subject to age, BMI, physical activity, and alcohol intake. The included lifestyle and anthropometric factors explain between 15% and 25% of the overall variation (R2) of the corresponding C ratios.
Discussion
Variability of relative lipoprotein composition
Atherogenic dyslipidemia prevails in patients with the metabolic syndrome, insulin resistance, and type 2 diabetes in whom it has been established to be a powerful indicator of CVD risk,(22) even being under treatment with LDL-C-lowering drugs such as statins.(23) This suggests that the highest benefit for a relevant portion of at-risk individuals might be achieved by not only lowering the LDL-C concentration but rather by comprehensive lipid management in which a reduction of the sdLDL portion is achieved along with reduced plasma T concentrations and an increased HDL2-C.(24,25)
A feasible way to achieve a cardioprotective lipoprotein profile might be to exploit its dependency on lifestyle factors. In this cross-sectional investigation in a large group of obviously healthy (i.e., non-diabetic) working males, we could demonstrate that anthropometric variables and several lifestyle factors including nutritional factors correlate significantly not only with absolute plasma concentrations of lipoprotein constituents but also with their distribution among lipoprotein fractions and their subfractions. Multivariate analysis of lipoprotein composition revealed that the triplet of C-P-ApoB on the one hand and T on the other can be considered as two independent factors. This is consistent with the fact that the C-associated fraction of lipoproteins and total circulating triglycerides affect the CVD risk independently.(25) On the other hand, the close covariation of ApoB and non-HDL C concentrations might explain why both factors are almost equal with respect to predict the likelihood of an upcoming event of CVD,(23) as they both proportionally represent the homogeneous C-P-ApoB triplet.
Alterations of concentrations of C, P, apolipoproteins, and T in plasma
Factors that showed the strongest positive or negative association with the plasma concentrations of C, P, and the corresponding apolipoproteins were age, BMI, physical activity, and the intakes of alcohol, carbohydrates, and MUFA. Age-associated increases in plasma C and ApoB have been identified as one of the major reasons for age being the key risk factors for CVD development and the BMI-associated rise in concentrations of T, ApoE and ApoC2/3 in plasma have been recognized as independent risk factors of CVD.(26–28) The inverse association between physical activity and total ApoB plasma concentration has already previously been considered as one of the cardioprotective effects of physical exercise and the increase of plasma concentrations of P and the ApoA1/ApoA2 ratio have been linked to the reduction of CVD risk in moderate alcohol consumers.(11,29) However, the question how the increased intake of carbohydrates is linked to a decreased plasma concentration of C, P, ApoC2/3, and ApoA1 needs further exploration.
Variation of concentrations of C, P, apolipoproteins, and T in main fractions and subfractions of lipoproteins
With respect to the main lipoprotein fractions, age and BMI contribute to the atherogenic shift in a differential manner (Fig. 2B); while an increasing age contributes to raised concentrations of the constituents in VLDL, IDL, and LDL, the effect of increasing BMI only seems to be related to a rise in VLDL components and a decrease of C, P, and ApoA1 in HDL, which has also been observed in previous studies.(30) However, a detailed view on the composition of the lipoprotein subfractions reveals additional phenomena. While age correlated positively to C-P-ApoB and T in both lbLDL and sdLDL, an elevated BMI was linked to a substantial shift of the C-P-ApoB triplet from lbLDL to sdLDL and to a decrease of C-P-ApoA1 in HDL2. This constellation has been defined as the atherogenic phenotype.(15) The stronger elevation of C in sdLDL compared to lbLDL with increasing age leads to an increase of the sdLDL-C–lbLDL-C ratio (Fig. 3B and Supplemental Table 6*). Hence, both aging and increasing BMI contribute to a shift towards the atherogenic lipoprotein phenotype.(15)
An increased physical activity was opposed to the age- and BMI-associated shifts in sdLDL and BMI-associated HDL2 composition whereas moderate alcohol consumption was inversely associated with BMI-associated changes of HDL2 components. A positive association between physical activity and the increase of HDL was repeatedly found in several large studies and meta-analyses.(31) However, to the best of the knowledge of the authors, the differential effects of ageing, increasing BMI, physical activity, moderate alcohol consumption, and other lifestyle factors on the single components of the subfractions of LDL and HDL in a large and well-defined group of obviously healthy individuals have not been reported previously.
Replacement of fat with carbohydrates having both a high-glycemic and low-glycemic index leads to a reduction of HDL components, as has been shown in long-term intervention studies,(32) suggesting that the ApoA1-associated risk reduction by physical activity and/or moderate alcohol consumption might be weakened by a high-carbohydrate diet.(11)
Numerous intervention studies have shown that an elevation of the intake of MUFAs results in a decreased risk to develop CVD, which in part has been explained by its lowering effect on LDL-C and sdLDL-C.(33,34) The current findings show that MUFAs’ intake are not only associated with a decreased sdLDL-C to lbLDL-C ratio but also with sdLDL-ApoB to lbLDL-ApoB ratio, which might be an additional factor contributing to the cardioprotective effect of an elevated MUFA consumption.(4) Similarly, moderate alcohol consumption is assumed to contribute to a reduced risk to experience cardiovascular disease,(35) which has been explained mainly by its HDL(2)-elevating effect.(36) Although intervention studies on the cardioprotective effect of moderate alcohol intake are lacking so far, a causative effect of moderate alcohol consumption on reduction of CVD incidence is well accepted.(8,11,37) Of note, in the current study alcohol intake within moderate limits was associated with an increase of HDL2 and a drop of the sdLDL-C/HDL2-C ratio at the highest measured effect size, even higher than that associated with the effect of age or BMI.
In this study, an increasing intake of biotin correlated significantly to a lower ratio of cholesterol in LDL to that in HDL. Little is known so far on the effect of biotin intake on the composition of lipoprotein subfractions, but a clinical trial has shown that supplementation of biotin in combination with chromium reduced the ratio of LDL to HDL cholesterol.(38)
The intake of vitamin B6, folic acid, and vitamin D correlated inversely with the C-P-ApoB component of lbLDL, partly even with a higher effect size than the BMI. However, these correlations are probably irrelevant, since large buoyant LDL particles are not considered to influence CVD risk.(12)
This comprehensive analysis in a large group of moderately obese, healthy working men suggests that physical activity, moderate alcohol consumption, and increased dietary intake of monounsaturated fatty acids and biotin might counteract the proatherogenic lipoprotein composition associated with increased age and BMI. This study certainly does not allow any recommendations encouraging the prophylactic use of alcohol because of its detrimental potential in terms of abuse, dependency, accidents, violence, fetotoxicity, and cancerogenic effects.(11,37,39,40) However, the data might provide a basis for additional intervention studies combining medical, lifestyle and nutritional interventions in the primary and secondary prevention of CVD.
Acknowledgments
This study was supported by the Grant B-70 from the Wissenschaftsförderung der Deutschen Brauwirtschaft. We acknowledge valuable discussion contributions by Prof. Dr. Christiane Bode, Dr. Jens Starke, and the critical comments of Dr. C. Svastisalee.
Conflict of Interest
No potential conflicts of interest were disclosed.
Supplementary Material
References
- 1.Roger VL, Go AS, Lloyd-Jones DM, et al. Heart disease and stroke statistics—2011 update: a report from the American Heart Association. Circulation. 2011;123:e18–e209. doi: 10.1161/CIR.0b013e3182009701. [DOI] [PMC free article] [PubMed] [Google Scholar]
- 2.Conroy RM, Pyörälä K, Fitzgerald AP, et al. Estimation of ten-year risk of fatal cardiovascular disease in Europe: the SCORE project. Eur Heart J. 2003;24:987–1003. doi: 10.1016/s0195-668x(03)00114-3. [DOI] [PubMed] [Google Scholar]
- 3.Emerging Risk Factors Collaboration. Di Angelantonio E, Sarwar N, et al. Major lipids, apolipoproteins, and risk of vascular disease. JAMA. 2009;302:1993–2000. doi: 10.1001/jama.2009.1619. [DOI] [PMC free article] [PubMed] [Google Scholar]
- 4.Olofsson SO, Borèn J. Apolipoprotein B: a clinically important apolipoprotein which assembles atherogenic lipoproteins and promotes the development of atherosclerosis. J Intern Med. 2005;258:395–410. doi: 10.1111/j.1365-2796.2005.01556.x. [DOI] [PubMed] [Google Scholar]
- 5.Baigent C, Keech A, Kearney PM, et al. Efficacy and safety of cholesterol-lowering treatment: prospective meta-analysis of data from 90,056 participants in 14 randomised trials of statins. Lancet. 2005;366:1267–1278. doi: 10.1016/S0140-6736(05)67394-1. [DOI] [PubMed] [Google Scholar]
- 6.Cooney MT, Dudina A, De Bacquer D. HDL cholesterol protects against cardiovascular disease in both genders, at all ages and at all levels of risk. Atherosclerosis. 2009;206:611–616. doi: 10.1016/j.atherosclerosis.2009.02.041. [DOI] [PubMed] [Google Scholar]
- 7.März W, Scharnagl H, Winkler K, et al. Low-density lipoprotein triglycerides associated with low-grade systemic inflammation, adhesion molecules, and angiographic coronary artery disease: the Ludwigshafen Risk and Cardiovascular Health study. Circulation. 2004;110:3068–3074. doi: 10.1161/01.CIR.0000146898.06923.80. [DOI] [PubMed] [Google Scholar]
- 8.Schäfer C, Parlesak A, Eckoldt J, et al. Beyond HDL-cholesterol increase: phospholipid enrichment and shift from HDL3 to HDL2 in alcohol consumers. J Lipid Res. 2007;48:1550–1558. doi: 10.1194/jlr.M600513-JLR200. [DOI] [PubMed] [Google Scholar]
- 9.Andrikoula M, McDowell IF. The contribution of ApoB and ApoA1 measurements to cardiovascular risk assessment. Diabetes Obes Metab. 2008;10:271–278. doi: 10.1111/j.1463-1326.2007.00714.x. [DOI] [PubMed] [Google Scholar]
- 10.Kelley GA, Kelley KS, Roberts S, Haskell W. Comparison of aerobic exercise, diet or both on lipids and lipoproteins in adults: a meta-analysis of randomized controlled trials. Clin Nutr. 2012;31:156–167. doi: 10.1016/j.clnu.2011.11.011. [DOI] [PMC free article] [PubMed] [Google Scholar]
- 11.Brinton EA. Effects of ethanol intake on lipoproteins. Curr Atheroscler Rep. 2012;14:108–114. doi: 10.1007/s11883-012-0230-7. [DOI] [PubMed] [Google Scholar]
- 12.St-Pierre AC, Cantin B, Dagenais GR, et al. Low-density lipoprotein subfractions and the long-term risk of ischemic heart disease in men: 13-year follow-up data from the Québec Cardiovascular Study. Arterioscler Thromb Vasc Biol. 2005;25:553–559. doi: 10.1161/01.ATV.0000154144.73236.f4. [DOI] [PubMed] [Google Scholar]
- 13.Williams PT, Superko HR, Haskell WL, et al. Smallest LDL particles are most strongly related to coronary disease progression in men. Arterioscler Thromb Vasc Biol. 2003;23:314–321. doi: 10.1161/01.atv.0000053385.64132.2d. [DOI] [PubMed] [Google Scholar]
- 14.Morgan J, Carey C, Lincoff A, Capuzzi D. High-density lipoprotein subfractions and risk of coronary artery disease. Curr Atheroscler Rep. 2004;6:359–365. doi: 10.1007/s11883-004-0047-0. [DOI] [PubMed] [Google Scholar]
- 15.Austin MA, King MC, Vranizan KM, Krauss RM. Atherogenic lipoprotein phenotype. A proposed genetic marker for coronary heart disease risk. Circulation. 1990;82:495–506. doi: 10.1161/01.cir.82.2.495. [DOI] [PubMed] [Google Scholar]
- 16.Kotseva K, Wood D, De Backer G, et al. Cardiovascular prevention guidelines in daily practice: a comparison of EUROASPIRE I, II, and III surveys in eight European countries. Lancet. 2009;373:929–940. doi: 10.1016/S0140-6736(09)60330-5. [DOI] [PubMed] [Google Scholar]
- 17.Landig J, Erhardt JG, Bode JC, Bode C. Validation and comparison of two computerized methods of obtaining a diet history. Clin Nutr. 1998;17:113–117. doi: 10.1016/s0261-5614(98)80004-6. [DOI] [PubMed] [Google Scholar]
- 18.Schofield WN, Schofield C, James WPT. Basal metabolic rate: review and prediction. Hum Nutr Clin Nutr. 1985;39(Suppl 1):1–96. [Google Scholar]
- 19.Havel RJ, Eder HA, Bragdon JH. The distribution and chemical composition of ultracentrifugally separated lipoproteins in human serum. J Clin Invest. 1955;34:1345–1353. doi: 10.1172/JCI103182. [DOI] [PMC free article] [PubMed] [Google Scholar]
- 20.Winkler K, Wetzka B, Hoffmann MM, et al. Triglyceride-rich lipoproteins are associated with hypertension in preeclampsia. J Clin Endocrinol Metab. 2003;88:1162–1166. doi: 10.1210/jc.2002-021160. [DOI] [PubMed] [Google Scholar]
- 21.Pavlidis P, Noble WS. Matrix2png: a utility for visualizing matrix data. Bioinformatics. 2003;19:295–296. doi: 10.1093/bioinformatics/19.2.295. [DOI] [PubMed] [Google Scholar]
- 22.Kathiresan S, Otvos JD, Sullivan LM, et al. Increased small low-density lipoprotein particle number: a prominent feature of the metabolic syndrome in the Framingham Heart Study. Circulation. 2006;113:20–29. doi: 10.1161/CIRCULATIONAHA.105.567107. [DOI] [PubMed] [Google Scholar]
- 23.Boekholdt SM, Arsenault BJ, Mora S, et al. Association of LDL cholesterol, non-HDL cholesterol, and apolipoprotein B levels with risk of cardiovascular events among patients treated with statins: a meta-analysis. JAMA. 2012;307:1302–1309. doi: 10.1001/jama.2012.366. [DOI] [PubMed] [Google Scholar]
- 24.Knopp RH, Paramsothy P, Atkinson B, Dowdy A. Comprehensive lipid management versus aggressive low-density lipoprotein lowering to reduce cardiovascular risk. Am J Cardiol. 2008;101:48B–57B. doi: 10.1016/j.amjcard.2008.02.038. [DOI] [PubMed] [Google Scholar]
- 25.Musunuru K. Atherogenic dyslipidemia: cardiovascular risk and dietary intervention. Lipids. 2010;45:907–914. doi: 10.1007/s11745-010-3408-1. [DOI] [PMC free article] [PubMed] [Google Scholar]
- 26.Genest J, Jr, McNamara JR, Ordovas JM, et al. Lipoprotein cholesterol, apolipoprotein A-I and B and lipoprotein (a) abnormalities in men with premature coronary artery disease. J Am Coll Cardiol. 1992;19:792–802. doi: 10.1016/0735-1097(92)90520-w. [DOI] [PubMed] [Google Scholar]
- 27.Austin MA, Hokanson JE, Edwards KL. Hypertriglyceridemia as a cardiovascular risk factor. Am J Cardiol. 1998;81:7B–12B. doi: 10.1016/s0002-9149(98)00031-9. [DOI] [PubMed] [Google Scholar]
- 28.Sacks FM, Alaupovic P, Moye LA, et al. VLDL, apolipoproteins B, CIII, and E, and risk of recurrent coronary events in the Cholesterol and Recurrent Events (CARE) trial. Circulation. 2000;102:1886–1892. doi: 10.1161/01.cir.102.16.1886. [DOI] [PubMed] [Google Scholar]
- 29.Holme I, Høstmark AT, Anderssen SA. ApoB but not LDL-cholesterol is reduced by exercise training in overweight healthy men. Results from the 1-year randomized Oslo Diet and Exercise Study. J Intern Med. 2007;262:235–243. doi: 10.1111/j.1365-2796.2007.01806.x. [DOI] [PubMed] [Google Scholar]
- 30.Lamon-Fava S, Wilson PW, Schaefer EJ. Impact of body mass index on coronary heart disease risk factors in men and women. The Framingham Offspring Study. Arterioscler Thromb Vasc Biol. 1996;16:1509–1515. doi: 10.1161/01.atv.16.12.1509. [DOI] [PubMed] [Google Scholar]
- 31.Kodama S, Tanaka S, Saito K, et al. Effect of aerobic exercise training on serum levels of high-density lipoprotein cholesterol: a meta-analysis. Arch Intern Med. 2007;167:999–1008. doi: 10.1001/archinte.167.10.999. [DOI] [PubMed] [Google Scholar]
- 32.Jebb SA, Lovegrove JA, Griffin BA, et al. Effect of changing the amount and type of fat and carbohydrate on insulin sensitivity and cardiovascular risk: the RISCK (Reading, Imperial, Surrey, Cambridge, and Kings) trial. Am J Clin Nutr. 2010;92:748–758. doi: 10.3945/ajcn.2009.29096. [DOI] [PMC free article] [PubMed] [Google Scholar]
- 33.Gillingham LG, Harris-Janz S, Jones PJ. Dietary monounsaturated fatty acids are protective against metabolic syndrome and cardiovascular disease risk factors. Lipids. 2011;46:209–228. doi: 10.1007/s11745-010-3524-y. [DOI] [PubMed] [Google Scholar]
- 34.Gill JM, Brown JC, Caslake MJ, et al. Effects of dietary monounsaturated fatty acids on lipoprotein concentrations, compositions, and subfraction distributions and on VLDL apolipoprotein B kinetics: dose-dependent effects on LDL. Am J Clin Nutr. 2003;78:47–56. doi: 10.1093/ajcn/78.1.47. [DOI] [PubMed] [Google Scholar]
- 35.Gaziano JM, Gaziano TA, Glynn RJ, et al. Light-to-moderate alcohol consumption and mortality in the Physicians’ Health Study enrollment cohort. J Am Coll Cardiol. 2000;35:96–105. doi: 10.1016/s0735-1097(99)00531-8. [DOI] [PubMed] [Google Scholar]
- 36.Rimm EB, Moats C. Alcohol and coronary heart disease: drinking patterns and mediators of effect. Ann Epidemiol. 2007;17:S3–S7. [Google Scholar]
- 37.Klatsky AL. Alcohol and cardiovascular mortality. J Am Coll Cardiol. 2010;55:1336–1338. doi: 10.1016/j.jacc.2009.10.057. [DOI] [PubMed] [Google Scholar]
- 38.Geohas J, Daly A, Juturu V, Finch M, Komorowski JR. Chromium picolinate and biotin combination reduces atherogenic index of plasma in patients with type 2 diabetes mellitus: a placebo-controlled, double-blinded, randomized clinical trial. Am J Med Sci. 2007;333:145–153. doi: 10.1097/MAJ.0b013e318031b3c9. [DOI] [PubMed] [Google Scholar]
- 39.Bagnardi V, Rota M, Botteri E, et al. Light alcohol drinking and cancer: a meta-analysis. Ann Oncol. 2013;24:301–308. doi: 10.1093/annonc/mds337. [DOI] [PubMed] [Google Scholar]
- 40.Brown SA, McGue M, Maggs J, et al. A developmental perspective on alcohol and youths 16 to 20 years of age. Pediatrics. 2008;121(Suppl 4):S290–S310. doi: 10.1542/peds.2007-2243D. [DOI] [PMC free article] [PubMed] [Google Scholar]
Associated Data
This section collects any data citations, data availability statements, or supplementary materials included in this article.