

Abstract
To better understand the impact of childhood obesity on intra-abdominal adipose tissue phenotype, a complete transcriptomic analysis using deep RNA-sequencing (RNA-seq) was performed on omental adipose tissue (OMAT) obtained from lean and Western diet-induced obese juvenile Ossabaw swine. Obese animals had 88% greater body mass, 49% greater body fat content, and a 60% increase in OMAT adipocyte area (all P < 0.05) compared with lean pigs. RNA-seq revealed a 37% increase in the total transcript number in the OMAT of obese pigs. Ingenuity Pathway Analysis showed transcripts in obese OMAT were primarily enriched in the following categories: 1) development, 2) cellular function and maintenance, and 3) connective tissue development and function, while transcripts associated with RNA posttranslational modification, lipid metabolism, and small molecule biochemistry were reduced. DAVID and Gene Ontology analyses showed that many of the classically recognized gene pathways associated with adipose tissue dysfunction in obese adults including hypoxia, inflammation, angiogenesis were not altered in OMAT in our model. The current study indicates that obesity in juvenile Ossabaw swine is characterized by increases in overall OMAT transcript number and provides novel data describing early transcriptomic alterations that occur in response to excess caloric intake in visceral adipose tissue in a pig model of childhood obesity.
Keywords: RNA-seq, childhood obesity, transcriptome, inflammation, visceral adipose tissue, gene expression
estimates indicate that more than one-third of U.S. children and adolescents are overweight or obese (23). Obesity, encountered at any age, is one of the most hazardous consequences of overnutrition and physical inactivity (51, 71). It has been established that a high body mass index in childhood is associated with a high risk of obesity in adulthood (60), and it increases the likelihood of developing adult comorbidities such as Type 2 diabetes, osteoarthritis, and cardiovascular disease (23).
During obesity, adipose tissue is reported to be the origin of systemic low-grade proinflammatory sequelae (7, 27, 58, 66, 75). Different regional adipose tissue depots are known to exhibit unique transcriptomic and metabolic properties (37), with visceral adipose tissue (VAT) being associated with the greatest cardiometabolic disease risk (29). The proinflammatory profile accompanying VAT expansion is thought to largely exacerbate the progression of cardiometabolic disorders (14), not limited to but including insulin resistance (19, 29, 61). VAT can be divided into three distinct depots: mesenteric, retroperitoneal, and omental adipose tissue (OMAT) (65). Compared with subcutaneous adipose tissue, OMAT has a greater effect on whole body pathology, as it is associated with pathologies of hepatic fibroinflammatory lesions in obese humans (11) and oversecretion of adipokines linked to cardiovascular or metabolic comorbidities (48, 54).
The aforementioned studies have been conducted in adult humans. A limited number of studies have investigated adipose growth in children reporting a dynamic interaction between extracellular matrix remodeling and immune cells at an early age (63) and infiltration of immune cells into subcutaneous adipose in some (59) but perhaps not all (63) children. However, there still exists a paucity of data describing the molecular changes associated with visceral obesity in juveniles, and this lack in understanding is due, in large part, to insufficient availability of tissues from lean and obese children.
Ossabaw swine possess a “thrifty gene” phenotype (39) as well as a propensity to store fat when given access to excess calories. Feeding Ossabaw swine excess calories also causes the development of classic indicators of the metabolic syndrome, including obesity, insulin resistance, glucose intolerance, and dyslipidemia (8, 15, 52). Thus, given their physiological similarities with humans (43, 67), as well as their propensity to develop diet-induced obesity, studying the tissues of juvenile Ossabaw swine under hypercaloric conditions provides a good model of studying childhood obesity. The current study employed RNA sequencing (RNA-seq) to evaluate the transcriptomic differences that exist within the OMAT of lean and obese juvenile Ossabaw swine.
Next-generation RNA-seq is a relatively new and powerful tool used to understand complex transcriptomes. Unlike microarray methods that can produce high background with cross-hybridization or other sequence-based approaches (i.e., SAGE, CAGE, MPSS), which have technical limitations with regards to transcriptomic mapping (70), it has been suggested that RNA-seq data are highly reproducible, can detect low abundance mRNAs, and can generate millions of reads per sample that can be efficiently mapped to the organism's respective transcriptome (46, 49). Furthermore, RNA-seq is an unbiased and holistic approach to determine differentially expressed mRNAs between experimental conditions and, similar to other high-throughput assays, can be invaluable in unveiling novel and unpredicted mechanisms (25, 41).
The aim of the present study was to identify novel transcripts in OMAT that are altered during the development of obesity. We hypothesized that an increased adiposity and proinflammatory events would be evident in the adipose tissue of our obese juvenile pigs. To this end, we carried out RNA-seq and compared OMAT transcriptomic differences between Western diet-induced obese and lean juvenile Ossabaw swine. Then, to better understand the functional implications, we performed bioinformatics analyses using Ingenuity Pathway Analysis (IPA), DAVID, and Gene Ontology (GO) to identify pathways and networks that differ between obese and lean juvenile swine and provide additional hypotheses that may explain the transcriptomic signature in this swine model of childhood obesity.
METHODS
Animals and diet.
All experimental procedures described herein were approved by the Animal Care and Use Committee at the University of Missouri. Animal care procedures have been previously described, and a portion of the animal characteristics data has been previously published (55). In brief, juvenile (5–6 wk old) female Ossabaw swine (n = 12) were generously obtained from Michael Sturek, Ph.D., in the Ossabaw Swine Resource, Comparative Medicine Program at Purdue University and Indiana University School of Medicine (IUSM) and individually housed under temperature-controlled conditions (20–23°C) with a 12 h/12 h light-dark cycle. Animals were randomly assigned to one of two experimental groups, a lean group fed a commercially available chow [5L80, Lab Diet; 3.03 kcal/g-10.5%, 71%, and 18.5% by energy for fat, carbohydrate, and protein, respectively; (n = 6)] or an obese group fed a high-fat/high-calorie diet [5B4L, Lab Diet; 4.14 kcal/g-43%, 40.8%, and 16.2% by energy for fat, carbohydrate, and protein, respectively, including 17.8% high fructose corn syrup; (n = 6)]. After 16 wk on diet (22 wk of age), body composition was measured via dual-energy X-ray absorptiometry (Hologic QDR-1000). Following body composition analyses, pigs were euthanized following an 18–20 h fast. Blood for serum analyses was collected via jugular vein access and OMAT was collected, flash-frozen in liquid nitrogen, and stored at −80°C until RNA extraction or formalin-fixed for histological analyses. The OMAT depot collected for these studies was located next to the stomach and spleen of the pigs and was visually more abundant in the obese pigs compared with the lean.
Serum cytokine concentration determination.
Serum from fasting animals were assayed in duplicate for concentrations of granulocyte macrophage-colony stimulating factor, interferon gamma, interleukin 1 alpha (IL-1α), interleukin 1 beta (IL-1β), interleukin 1 receptor antagonist alpha (IL-1R-α), IL-2, IL-4, IL-6, IL-8, IL-10, IL-12, IL-18, and tumor necrosis factor alpha (TNF-α) using a porcine specific multiplex cytokine/chemokine assay (cat. no. PCYTMAG-23K; Millipore Milliplex, Billerica, MA) on a MAGPIX instrument (Luminex; Luminex Technologies, Austin, TX) according to the manufacturer's instructions.
OMAT RNA extraction and preparation.
RNA isolation was performed by a modified method from Amstalden et al. (1). Frozen tissues were pulverized with a liquid nitrogen-cooled mortar and pestle, and ∼600 mg of powder was placed in 3 ml of working reagent (denaturing solution: 293 ml DEPC H2O, 17.6 ml of 0.75 M sodium citrate pH 7.0, 26.4 ml of 10% Sarkosyl, and 250 g guanidine thiocynanate + 7 μl of 2-mercaptoethanol/ml denaturing solution). Tissues were homogenized on ice and centrifuged at 4,000 g at 4°C for 15 min. The supernatant was removed, and RNA was extracted with QIAzol Lysis Reagent/Chloroform and vortexed thoroughly for ∼1 min. Samples were centrifuged at 17,000 g for 30 min at 4°C, and the aqueous phase was saved. To the aqueous phase 300 μl of sodium acetate (3 M, pH 4.5) and 1 vol 5:1 QIAzol Lysis Reagent/Chloroform was added and mixed. Samples were centrifuged at 17,000 g for 30 min at 4°C; 1 vol of 2-propanol was added to the aqueous phase and placed at −20°C overnight. Samples were centrifuged at 13,900 g for 20 min at 4°C, and the supernatant was discarded. To the pellet, 500 μl of 75% EtOH was added, the sample was centrifuged at 17,000 g for 10 min at 4°C, and the supernatant was discarded. Finally, 32 μl of DEPC H2O was added; samples were heated to 37°C for 10 min and vortexed to dissolve the pellet. RNA purity and concentrations were determined with a NanoDrop 1000 spectrophotometer (Thermo Scientific). Samples were diluted to 100 ng/μl and sent to the University of Missouri-Columbia DNA Core for RNA sequencing preparation and execution.
RNA sequencing.
RNA-seq procedures were performed as previously described (56). Briefly, RNA integrity for all samples was confirmed with the BioAnalyzer 2100 automated electrophoresis system (Bio-Rad, Hercules, CA) preceding cDNA library construction. RNA-seq preparation, including cDNA library construction, was carried out at the University of Missouri DNA Core following manufacturer's protocol using the Illumina TruSeq RNA sample preparation kit v2. Poly-A containing mRNA was isolated from 2 μg of total RNA, RNA fragmentation was carried out, and double-stranded cDNA was produced from fragmented RNA. Lastly, identifier adaptors were ligated to the ends for identification purposes. The final construct of each purified library was evaluated with the BioAnalyzer 2100 automated electrophoresis system, quantified, and diluted in accordance with Illumina's protocol for HiSeq 2000.
RNA-seq data acquisition was carried out at the University of Missouri DNA Core, and following this, adaptor sequences were trimmed. NextGENe v1.92 (SoftGenetics, State College, PA) was used, and the resulting sequences were aligned to a custom reference file.
Reference assembly.
Publically available expressed sequence tags, Ensemble transcripts, and National Center for Biotechnology Information reference sequences were assembled using Cap3 to produce a public reference file. Each sequence in the public file was truncated by 80 bases on each end and used to filter the Experimental Illumina data. Reads that did not align to the truncated public file were assembled de novo using NextGENe v1.92. The resulting contigs were amended to the full-length public reference file and assembled using Cap3. The resulting file contained contigs from all mRNA sources available at the time including this experiment. The sequences in this file represent full-length mRNAs and mRNA fragments. The fragments are generated when insufficient data are present to create overlaps. As a result, many genes are represented multiple times as independent, nonoverlapping fragments. As a general rule, fragments that could not be annotated represented first or last exons that were not annotated in the porcine genome build, were not found in public references, and were not sufficiency homologous to the human genome in these noncoding regions to be annotated by homology.
RNA-seq data analysis: bioinformatics of differentially expressed genes (reads per kilobase per million reads >2) between lean and obese pigs.
The decision-making process for RNA-seq data analysis was as follows. Within each condition, reads per million (RPM) means were calculated for each biological replicate (n = 6 lean and n = 6 obese). A 95% confidence interval was then generated around the mean number of reads in an attempt to identify mRNAs for each condition that were statistically greater than zero. Reads per kilobase per million reads (RPKM) mean values were then calculated for each mRNA in obese and lean conditions, and all transcript group means with a RPKM value < 2.0 were removed from further analyses. Obese and lean RPKM values were subsequently used to generate differential gene expression patterns and a t-test for obese/lean fold-change values ≥±1.5-fold was performed. Between-group differences were found to exist on per-gene basis between-groups after retaining all mRNAs with false discovery rates < 0.10. Transcripts that met these thresholds were entered into IPA (Ingenuity Systems, Redwood, CA) for examination of which OMAT gene networks differed between treatments. IPA analysis was carried out using all differentially expressed mRNAs (both up- and downregulated).
On/off gene analysis.
Independent of the decision-making process outlined above, an analysis into gene activation was performed. In brief, all biological replicates (n = 6) in each group had to have an RPKM > 0 for a given mRNA transcript for that respective gene to be categorized as turned “on.” Likewise, if one replicate had an RPKM of 0 for a given gene, this gene was determined to be “off.” This procedure was carried out for obese only, lean only, and obese/lean together. Additionally, it was then determined the number of activated genes unique to each condition, respectively.
Bioinformatics of RNA-seq data.
In an attempt to utilize IPA to its fullest potential, three separate gene lists were entered into IPA. The three gene lists included mRNAs that met all of the aforementioned filters and are as follows: 1) up- and downregulated obese mRNAs, 2) only upregulated obese mRNAs, and lastly 3) only downregulated obese mRNAs. We present the top identified and clustered mRNA networks for each of the three analyses (Figs. 3–5). The reason for this was to produce higher scoring and more complete gene networks highlighting the important functional differences between obese and lean omental adipose transcriptomes. Additionally, GO Consortium database was used to generate transcript lists of relevant biological functions. DAVID bioinformatics resource was used to further provide in-depth understanding of the biological themes in our gene set (28).
Fig. 3.
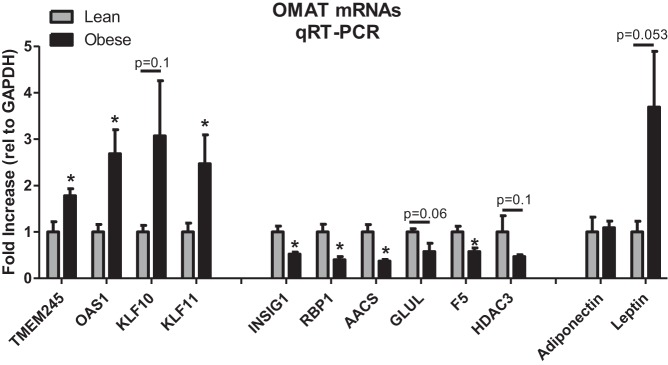
qRT-PCR verification of select mRNAs in OMAT that were shown to be up- and downregulated by RNA-seq. Values are means ± SE. Leptin and adiponectin were included as they are commonly assessed adipokines. *Significantly different than lean, P < 0.05.
Fig. 5.

Top upregulated Ingenuity Pathway Analysis network using only upregulated mRNAs that passed all filters. (RPKM > 2, obese/lean > 1.5-fold, r value < 0.10). Red shapes indicate upregulated mRNAs. Different shapes are indicated in the legend.
Quantitative real-time polymerase chain reaction for RNA-seq validation.
For quantitative real-time polymerase chain reaction (qRT-PCR), 5 μg of RNA was reverse transcribed by adding RNA to the transcription reaction mixture (nuclease-free water, ImProm-II 5X reaction buffer, MgCl2, dNTP mix, and ImProm-II reverse transcriptase), and cDNA was synthesized. The master mix [nuclease-free H2O, gene-specific forward and reverse primers (Sigma-Aldrich, St. Louis, MO) and Fast SYBR Green (Applied Biosystems, Carlsbad, CA)] and 100 ng of cDNA were assayed using the ABI 7500 Fast Sequence Detection System (Applied Biosystems). Primer sequences are shown in Table 1. Results were quantified using the delta delta cycle threshold (ddCt) method with GAPDH as the housekeeping gene. Raw Ct values for GAPDH did not differ between groups (P = 0.77), indicating that GAPDH mRNA was an appropriate normalizer.
Table 1.
Forward and reverse primer sequences for quantitative real-time PCR
| Primer Sequence (5′ → 3′) |
||
|---|---|---|
| Gene | Forward | Reverse |
| TGF-Beta | CGCATCGAGGCCATTCGCGGCCAGATTC | TCAGCCACTGCCGCACAACTCCGGTGAC |
| TNF-Alpha | CACGTTGTAGCCAATGTCAA | GAGTGAGGAAAACGTTGGTG |
| IL1-Beta | CAGCCATGGCCATAGTACCT | CCACGATGACAGACACCATC |
| CD68 | CCTTCCCCTTCTCATCATTT | CCTAACCTGGGAACCTTCAT |
| F4/80 | GTGATGCCCAACAATGAGTG | AGGCAAATCTCTCAGCCGTA |
| TLR4 | TCAGTTCTCACCTTCCTCCTG | GTTCATTCCTCACCCAGTCTTC |
| HDAC3 | TACTTTGCCCCGGACTTCAC | TCGTCAGTCCTGTCGTAGGT |
| TMEM245 | TATGAGCCGGAATGTGAGCC | AATTGAGAAGGGCTGTCCCG |
| OAS1 | GCAACTCAAGAAACCCAGGC | CCCATCCAGATTCTTGCAGC |
| KLF10 | CCAACCATGCTCAACTTCGG | CTCTGCAGCTTTGTTCCACG |
| KLF11 | ACACGCGGTTGACATCAT | CAGGTGTGAGCGGTCTTATC |
| INSIG1 | GAGACTGTGGGACAGGGTTG | GAGTTTGGCGAGGACAGACA |
| RBP1 | CCCCAGAAATGCCGGTCG | CGCAAGGCCACATTGACATC |
| AACS | TGTGTCACTTCGTACGGTGG | GGTGACACACAGTGGGAGAG |
| GLUL | GCTCCCACTTGAACAAAGGC | CGAAATTCCACTCGGGCAAC |
| F5 | TCTTCCAGAGCCCATCCAGA | GAGAGGTGGTTCTATGCCCC |
| Adiponectin | TACCCCAGGCCGTGATGGCA | ACCCGAGTCTCCAGGCCCAC |
| Leptin | TGACACCAAAACCCTCATCA | GCCACCACCTCTGTGGAGTA |
Adipocyte sizing and CD68 immunohistochemistry.
Hematoxylin and eosin-stained paraffin-fixed sections of OMAT were used to determine adipocyte size. For quantification, sections were photographed (3–5 fields of view per animal) with an Olympus BX43 light microscope and Olympus SC 100 camera using the ×10 objective. Adipocyte cross-sectional area was obtained from perimeter tracings of all adipocytes within a field of view using ImageJ software [National Institutes of Health (NIH), Bethesda, MD]. A modified method from Johnson et al. (31) was used to perform immunohistochemistry for CD68 on formalin-fixed paraffin-embedded OMAT slides. Prior to the staining protocol, slides were deparaffinized in xylenes and hydrated to water through graded alcohols. Slides were steamed in 1× retrieval solution (10X Dako target retrieval solution, Carpinteria, CA) for 30 min to efficiently achieve antigen retrieval and then cooled for 20 min at room temperature. Tissues were quenched with 3% H2O2 (Sigma Aldrich) for 5 min, blocked with Avidin/Biotin (Vector Laboratories, Burlingame, CA) for 15 min, and protein blocked (Dako Protein Block Serum-Free) for 2 h. Sections were incubated overnight at 4°C with primary goat polyclonal IgG anti-CD68 (Santa Cruz Biotechnology, Santa Cruz, CA) antibody at 1:50 dilution. Following appropriate washing steps, slides were incubated in biotinylated anti-goat secondary antibody (Dako LSAB+ System-HRP) for 30 min at room temperature. Streptavidin-HRP label (Dako LSAB+ System-HRP) was applied to sections for 30 min. Diaminobenzidine (Dako Liquid DAB+ Substrate Chromogen System) was applied for 10–30 min followed by application of DAB enhancer for 5 min at room temperature to allow for visualization of CD68 antibody staining. Slides were counterstained in Harris's hematoxylin (Stat Lab, McKinney, TX) for 1 min, blued in 0.037 M ammonia H2O (15 M ammonium hydroxide; Fischer Scientific, Waltham, MA), dehydrated, and mounted in faramount aqueous mounting medium (Dako). Swine spleen was used as a positive control for CD68 staining. Five views per animal were examined under light microscopy (Olympus BX43 light microscope and Olympus SC 100 camera).
Statistical analysis.
All analytical procedures were performed using Microsoft Excel v2011 and SPSS 20.0 (IBM). A Student's t-test was used to determine if statistical significance (alpha level < 0.05) was present for body weights, body fat percentages, adipocyte areas, and qRT-PCR data.
RESULTS
General characteristics.
Over the course of the study, lean pigs consumed an average of 550 g of food per day, whereas the Western diet-induced obese pigs averaged 1,200 g of their respective food per day. As previously reported (55), at the end of the 16 wk experimental period, obese pigs were significantly heavier (47.1 kg vs. 25.1 kg) and had an increased body fat percentage (30.2% vs. 20.4%) when compared with lean pigs (Fig. 1A). Consistent with an increase in body fat, there was evident adipocyte hypertrophy in obese OMAT compared with lean OMAT demonstrated by a statistically significant (P < 0.05) increase in average adipocyte area (Fig. 1, B–D). In addition, fasting serum glucose, insulin, and blood lipids have previously been reported in these animals (55), with values indicating hyperinsulinemia and dyslipidemia in the obese pigs. No significant differences existed between groups in the concentrations of serum cytokine/chemokines measured (Table 2).
Fig. 1.

A: Body fat %. B: adipocyte area (μm2). C and D: representative hematoxylin and eosin staining of omental adipose tissue (OMAT). Scale bar is 100 μm. Note much larger adipocytes in the obese animals. *Significantly different from lean, P < 0.05.
Table 2.
Serum cytokine panel
| Serum Cytokines, ng/ml | Lean | Obese | P Value |
|---|---|---|---|
| GM-CSF | 0.05 ± 0.03 | BDL | 0.22 |
| IFNG | 1.95 ± 0.83 | 2.90 ± 0.90 | 0.53 |
| IL-1-α | 0.003 ± 0.001 | BDL | 0.22 |
| IL-1-β | 0.39 ± 0.21 | 0.04 ± 0.01 | 0.23 |
| IL-1RA | 0.06 ± 0.02 | 0.09 ± 0.03 | 0.50 |
| IL-2 | 0.05 ± 0.03 | 0.01 ± 0.004 | 0.37 |
| IL-4 | 0.27 ± 0.18 | 0.06 ± 0.03 | 0.40 |
| IL-6 | 0.03 ± 0.02 | 0.003 ± 0.002 | 0.39 |
| IL-8 | 0.21 ± 0.08 | 0.10 ± 0.05 | 0.38 |
| IL-10 | 0.09 ± 0.07 | 0.02 ± 0.01 | 0.44 |
| IL-12 | 0.31 ± 0.03 | 0.27 ± 0.03 | 0.50 |
| IL-18 | 0.66 ± 0.39 | 0.25 ± 0.07 | 0.44 |
| TNF-α | 0.06 ± 0.05 | BDL | 0.40 |
Data are means ± SE. No significant differences existed between groups.
BDL, below detection limits of the assay.
Quantification of expressed transcript differences between obese and lean.
On average, 27.9 million total sequencing reads were recorded for each OMAT sample, and the mean number of total reads that matched successfully to our custom-made reference list was 24.8 million or 89%. The overall numerical values for 1) all transcripts, 2) known transcripts, and 3) unknown transcripts are presented in Fig. 2. On average, obese OMAT samples had 51,118 genes turned on (expressed mRNA transcripts), of which 21,763 were known and 29,355 were unknown, while lean samples had 37,211 genes turned on (expressed mRNA transcripts) with 17,223 known and 19,988 unknown. This difference equates to a 37% increase in genes that were turned on (mRNA transcript number) in obese OMAT. Moreover, obese OMAT had 25 times more known genes turned on (known mRNA transcripts) than lean OMAT (4,731 vs. 191).
Fig. 2.

Quantification of expressed transcripts between treatments. Reads per kilobase per million reads (RPKM) values representing each transcript were assessed and had to be >0 for all biological replicates in both groups, obese and lean, for inclusion in this analysis. No additional filtering or statistical analyses were performed on above values. A: all transcripts analyzed (RPKM > 0, both known/annotated and unknown/nonannotated). B: annotated transcripts for which identity is known. C: nonannotated transcripts for which identity is unknown.
Top 15 up- and downregulated mRNAs in obese pigs.
The top 15 upregulated (fold change above lean) mRNAs in the OMAT of obese pigs are listed in Table 3 and include: cytochrome P450, family 4, subfamily B, polypeptide 1 (CYP4B1), Contig 17371 (unknown), myosin IXA (MYO9A), LRRN4 COOH-terminal like (LRRN4CL), myeloid/lymphoid or mixed-lineage 2 (MLL2), G protein-coupled receptor 35 (GPR35), platelet-derived growth factor receptor, alpha polypeptide (PDGFRA), Contig 57707 (unknown), NKF3 kinase family member (PEAK1), activating transcription factor 3 (ATF3), Kruppel-like factor 11 (KLF11), transmembrane protein 245 (TMEM245), MT-RNR2-like 8 (MTRNR2L8), 2′-5′-oligoadenylate synthetase 1 (OAS1), and V-maf avian musculoaponeurotic fibrosarcoma oncogene homolog (MAFF). It is noteworthy to mention that two common obesity-associated genes, adiponectin and leptin mRNA, were excluded because they did not meet our filtering criteria, indicating that their transcript levels were not statistically different in the OMAT of the lean and obese pigs. mRNA expression for adiponectin and leptin was also assessed by qRT-PCR, with leptin mRNA expression tending to be elevated in the OMAT of the obese pigs (P = 0.053, Fig. 3).
Table 3.
Top 15 up- and downregulated mRNA transcripts in obese pigs based on average RPKM values for obese and lean groups
| Gene Name | Lean RPKM | Obese RPKM | Fold Change | P Value | |
|---|---|---|---|---|---|
| Top 15 Upregulated mRNAs in Obese Pigs | |||||
| CYP4B1 | cytochrome P450, family 4, subfamily B, polypeptide 1 | 20.14 | 88.89 | 4.41 | <0.001 |
| Contig 17371 | 31.44 | 93.39 | 2.97 | 0.01 | |
| MYO9A | myosin IXA | 67.89 | 192.62 | 2.84 | <0.001 |
| LRRN4CL | LRRN4 COOH-terminal like | 51.48 | 138.08 | 2.68 | 0.002 |
| MLL2 | myeloid/lymphoid 2 | 2.51 | 6.61 | 2.63 | <0.001 |
| GRP35 | G protein-coupled receptor 35 | 3.80 | 9.95 | 2.62 | <0.001 |
| PDGFRA | platelet-derived growth factor receptor-α | 5.77 | 14.84 | 2.57 | 0.01 |
| Contig 57707 | 4.07 | 9.58 | 2.35 | 0.01 | |
| PEAK1 | NKF3 kinase family member | 2.76 | 6.12 | 2.22 | <0.001 |
| ATF3 | activating transcription factor 3 | 3.05 | 6.74 | 2.21 | 0.01 |
| KLF11 | kruppel-like factor 11 | 5.20 | 11.45 | 2.20 | 0.02 |
| TMEM245 | transmembrane protein 245 | 16.15 | 35.22 | 2.18 | 0.03 |
| MTRNR2L8 | MT-RNR2-like 8 | 78.10 | 169.00 | 2.16 | 0.03 |
| OAS1 | 2′-5′-oligoadenylate synthetase 1 | 12.05 | 25.97 | 2.16 | <0.001 |
| MAFF | V-maf avian musculoaponeurotic fibrosarcoma oncogene homolog | 5.05 | 10.45 | 2.06 | 0.02 |
| Top 15 Downregulated mRNAs in Obese Pigs | |||||
| GLUL | glutamate-ammonia ligase | 22.77 | 10.10 | −2.46 | 0.02 |
| HOXB6 | homeobox B6 | 2.13 | 4.79 | −2.24 | 0.01 |
| PITPNM2 | phosphatidylinositol transfer protein, membrane-associated 2 | 7.30 | 3.28 | −2.22 | 0.01 |
| RASAL2 | RAS protein activator like 2 | 4.59 | 2.10 | −2.18 | <0.001 |
| Contig 107117 | 35.26 | 16.15 | −2.18 | 0.01 | |
| Contig 117398 | 4.89 | 2.27 | −2.15 | 0.02 | |
| INSIG1 | insulin induced gene 1 | 5.43 | 2.53 | −2.12 | 0.01 |
| ZMYM6NB | ZMYM6 neighbor | 4.55 | 2.15 | −2.11 | 0.02 |
| F5 | coagulation factor V | 11.74 | 5.58 | −2.10 | 0.02 |
| Contig 43106 | 5.93 | 2.87 | −2.07 | 0.02 | |
| HCN2 | hyperpolarization activated cyclic nucleotide-gated potassium channel 2 | 4.83 | 2.34 | −2.06 | 0.03 |
| Contig 56089 | 4.06 | 2.13 | −2.05 | 0.003 | |
| AACS | acetoacetyl-CoA synthetase | 36.05 | 17.82 | −2.02 | <0.001 |
| LOC100506127 | putative uncharacterized protein FLJ37770-like | 6.07 | 3.01 | −2.02 | 0.005 |
| SERPINI1 | serpin peptidase inhibitor, Clade 1 | 5.73 | 2.85 | −2.00 | 0.03 |
RPKM, reads per kilobase per million reads. Fold change calculated as obese/lean.
Table 3 also includes the top 15 downregulated (fold change below lean) mRNAs in obese OMAT, which are: glutamate-ammonia ligase (GLUL), homeobox B6 (HOXB6), phosphatidylinositol transfer protein, membrane-associated 2 (PITPNM2), RAS protein activator like 2 (RASAL2), Contig 107117 (unknown), Contig 117398 (unknown), insulin-induced gene 1 (INSIG1), ZMYM6 neighbor (ZMYM6NB), coagulation factor five (F5), Contig 43106 (unknown), hyperpolarization-activated cyclic nucleotide-gated potassium channel 2 (HCN2), Contig 56089 (unknown), acetoacetyl-CoA synthetase (AACS), putative uncharacterized protein FLJ37770-like (LOC100506127), and serpin peptidase inhibitor, clade 1 (SERPINI1). We performed qRT-PCR on several of these genes to help confirm our RNA-seq findings of up- and downregulated transcripts, including reflected changes in TMEM245, KLF10, KLF11, HDAC3, OAS1, GLUL, INSIG1, F5, AACS, and RBP1 (Fig. 3).
IPA analysis including networks, canonical pathways, and biological functions.
The top-scoring IPA network inclusive of both up- and downregulated mRNAs for obese animals (Fig. 4) had a score of 38 and included 24 mRNAs. IPA-identified top function(s) based on an algorithm that aggregates genes from our dataset based on known relationships in the Ingenuity knowledge base of this network include: 1) “cardiovascular system development and function,” 2) “embryonic development,” and 3) “organismal development.” The following mRNAs were all upregulated in obese OMAT in this network: ASNS, ATF3, BTC, EFNA5, ETV6, FBXO32, LOXL1, MLL2, NOC2L, and REST. The following mRNAs were downregulated: DDB2, FBXW11, HDAC3, HELZ, MEF2D, MTA1, NPTXR, OGT, ORC4, POLR2B, PTPRB, TAF5, XIST, and ZNF212. The top biological functions were calculated using strongly associated dysregulated molecules from this network and include: 1) cancer (P < 0.05), 2) cellular development (P < 0.05), and 3) connective tissue development and function (P < 0.05). The top canonical pathway identified from the Ingenuity knowledge base that contains a significant number of molecules from our data set is “basal cell carcinoma signaling” [P = 0.005, including genes BMP3 (+1.7-fold in obese), BMP6 (+1.5-fold in obese), PTCH2-δ (+1.6-fold in obese), WNT16 (−1.6-fold in obese), and WNT2B (+1.7-fold in obese)].
Fig. 4.

Top-scoring Ingenuity Pathway Analysis network using mRNAs that passed all filters (RPKM > 2, obese/lean > 1.5-fold, r value < 0.10). Red shapes indicate upregulated mRNAs, while green shapes indicate downregulated mRNAs. Different shapes are indicated in the legend. Asparagine synthetase (ASNS), activating transcription factor 3 (ATF3), betacellulin (BTC), ephrin-A5 (EFNA5), ets variant 6 (ETV6), F-box protein 32 (FBXO32), Lysyl oxidase-like 1 (LOXL1), myeloid/lymphoid or mixed-lineage 2 (MLL2), nucleolar complex associated 2 homolog (NOC2L), and RE1-silencing transcription factor (REST). The following mRNAs were downregulated: damage-specific DNA binding protein 2 (DDB2), F-box and WD repeat domain containing 11 (FBXW11), histone deacetylase 3 (HDAC3), helicase with zinc finger (HELZ), monocyte enhancer factor 2D (MEF2D), methionine adenosyltransferase I, alpha (MTA1), neuronal pentraxin receptor (NPTXR), O-linked N-acetylglucosamine transferase (OGT), origin recognition complex, subunit 4 (ORC4), polymerase (RNA) II polypeptide B (POLR2B), protein tyrosine phosphatase receptor type B (PTPRB), TAF5 RNA polymerase II, TATA box binding protein (TAF5), X-inactive specific transcript (XIST), and zinc finger protein 212 (ZNF212).
The functions of the top upregulated network (Fig. 5) include 1) “development,” 2) “cellular function and maintenance,” and 3) “connective tissue development and function” (IPA score = 44). The functions of the top-scoring downregulated network (Fig. 6) in obese OMAT are 1) “RNA posttranslational modification,” 2) “lipid metabolism,” and 3) “small molecule biochemistry” (IPA score = 50). According to DAVID, the top three upregulated functional annotation charts are: 1) aging, 2) growth factor, and 3) positive regulation of developmental process (Table 4), and the top three downregulated functional annotation charts are: 1) proteinaceous extracellular matrix, 2) protein ubiquitination, and 3) sulfur metabolic process (Table 5). Upregulated and downregulated GO gene lists generated within DAVID for the GO categories “biological process,” “cellular component,” and “molecular function” and the top functions of each category are shown in Table 6.
Fig. 6.

Top downregulated Ingenuity Pathway Analysis network using only downregulated mRNAs that passed all filters. (RPKM > 2, obese/lean > −1.5-fold, r value < 0.10). Green shapes indicate downregulated mRNAs. Different shapes are indicated in the legend.
Table 4.
Top 3 DAVID functional annotation charts constructed using all upregulated mRNAs in obese pigs
| mRNA | Name | Function |
|---|---|---|
| Aging | ||
| LOXL2 | lysyl oxidase-like 2 | biogenesis of connective tissue |
| PTGS1 | prostaglandin-endoperoxide synthase 1 | regulates angiogenesis in endothelial cells |
| PRKCA | protein kinase C, alpha | involved in diverse cellular signaling pathways |
| TFRC | transferrin receptor | development of erythrocytes and the nervous system |
| Growth Factor | ||
| BTC | betacellulin | mitogen for epithelial cells |
| BMP3 | bone morphogenetic protein 3 | induces bone formation |
| BMP6 | bone morphogenetic protein 6 | induces bone formation |
| NOV | nephroblastoma overexpressed gene | associated with extracellular matrix development |
| Positive Regulation of Developmental Process | ||
| KLF10 | Kruppel-like factor 10 | transcriptional repressor |
| BTC | betacellulin | mitogen for epithelial cells |
| BMP6 | bone morphogenetic protein 6 | induces bone formation |
| DDAH1 | dimethylarginine dimethylaminohydrolase 1 | nitric oxide generation |
| PRKCA | protein kinase C, alpha | involved in diverse cellular signaling pathways |
DAVID Bioinformatics Resource 6.7 was utilized, the upregulated mRNAs in obese pigs (>1.5-fold above lean, P value < 0.05) were input, and various functional outcome measures were obtained.
Table 5.
Top 3 DAVID functional annotation charts constructed using all downregulated mRNAs in obese pigs
| mRNA | Name | Function |
|---|---|---|
| Proteinaceous Extracellular Matrix | ||
| ADAMTS5 | ADAM metallopeptidase with thrombospondin type 1 motif, 5 | cleaves aggrecan, a cartilage proteoglycan |
| FRAS1 | Fraser syndrome 1 | extracellular matrix protein involved in epidermal-basement membrane adhesion |
| MAMDC2 | MAM domain containing 2 | extracellular domain that mediates protein-protein interactions |
| ENTPD1 | ectonucleoside triphosphate diphosphohydrolase 1 | hydrolysis of ATP and other nucleotides |
| HMCN1 | hemicentin 1 | extracellular matrix stabilization |
| WNT16 | wingless-type MMTV integration site family, member 16 | signaling protein associated with developmental processes |
| Protein Ubiquitination | ||
| FBXW11 | F-box and WD repeat domain containing 11 | substrate recognition component involved with degradation of target protein |
| DDB2 | damage-specific DNA binding protein 2 | required for DNA binding in response to cellular damage |
| TRIP12 | thyroid hormone receptor interactor 12 | ligase involved in DNA repair |
| UBE3C | ubiquitin protein ligase E3C | involved in formation of poly-ubiquitin chains |
| Sulfur Metabolic Process | ||
| PAPSS2 | 3′-phosphoadenosine 5′-phosphosulfate synthase 2 | bifunctional enzyme with both ATP sulfurylase and APS kinase activity |
| MAMDC2 | MAM domain containing 2 | extracellular domain that mediates protein-protein interactions |
| CSGALNACT2 | chondroitin sulfate N-acetylgalactosaminyltransferase 2 | elongation during chondroitin sulfate synthesis |
| TPST2 | tyrosylprotein sulfotransferase 2 | catalyzes the O-sulfation of tyrosine residues |
DAVID Bioinformatics Resource 6.7 was utilized, the downregulated mRNAs in obese pigs (>−1.5-fold below lean, P value < 0.05) were input, and various functional outcome measures were obtained.
Table 6.
GO gene lists generated using DAVID Bioinformatics online software
| GO Category | Top Function | mRNAs Involved |
|---|---|---|
| Upregulated (Obese > 1.5-fold Over Lean, P < 0.05) GO Categories | ||
| Biological process | development | KLF10, MFNG, BMP3, BMP6, CTGF, EFNA5, ETV6, FAM83H, GPM6B, LMBR1, LOXL2, MLL2, PTCH2, PDGFRA, PHLDA3, PTGS1, PRKCA, SEMA3B, SHROOM3, LOC100130902, TFRC, MAFF, WNT2B |
| Cellular component | extracellular region | ADAMTS5, MFNG, BTC, BMP3, BMP6, CTGF, EFNA5, LOXL1, LOXL2, NOV, RTN3, WNT2B |
| Molecular function | growth factor activity | BTC, BMP3, BMP6, CTGF, NOV |
| Downregulated (Obese > −1.5-fold Below Lean, P < 0.05) GO Categories | ||
| Biological process | RNA processing | DDX46, FTSJ1, PAPD4, RBM25, SR140, LUC7L3, CPSF6, DUSP11, HNRNPK, IVNS1ABP, POLR2B, SRRM1, SF3B1, SF3B3 |
| Cellular component | nucleoplasm part | DDX46, OGT, RBM25, SMAD9, SON, TAF5, LUC7L3, CPSF6, HDAC3, IVNS1ABP, POLR2B, SRRM1, SF3B1, ZFHX3 |
| Molecular function | DNA binding | AEBP1, DBP, NOTCH1, OTUD7B, PRDM10, SMAD9, SON, SP4, TAF15, TAF5, UPF1, LUC7L3, DDB2, HNRNPK, HDAC3, HOXB6, MBD6, MEF2D, POLR2B, SRRM1, SIM2, TRPS1, ZFHX3, ZNF131, ZNF211, ZNF267, ZNF333, ZNF527, ZNF688, ZNF689, ZNF771 |
Upregulated and downregulated gene lists were entered separately.
GO, Gene Ontology.
Canonical mRNA analysis between obese and lean pigs.
When we examined genes that have been commonly associated with obesity, our animals did not show significant changes between obese vs. lean in five functional categories: 1) hypoxia genes [hypoxia-inducible factor, I alpha subunit (HIF-1a) and JNK1/MAPK8-associated membrane protein, variant 2 (JKAMP)], 2) angiogenesis genes [vascular endothelial growth factor A (VEGFA) and matrix metallopeptidase 3 (MMP3)], 3) inflammatory genes [tumor necrosis factor-alpha (TNF-α), toll-like receptor-4 (TLR-4), and triggering receptor expressed on myeloid cells 2 (TREM2)], 4) extracellular matrix genes [collagen, type IV, alpha 1 (COL4A1) and collagen, type IV, alpha 2 (COL4A2)], and lastly 5) proliferation genes [GATA binding protein 2 (GATA2), phosphotyrosine interaction domain containing 1 (PID1), and fat mass and obesity-associated (FTO)]. To confirm the lack of differences in our RNA-seq analyses for several classical inflammation/macrophage markers, qRT-PCR was performed, and we observed no differences between obese and lean OMAT for TGF-β, TNF-α, IL-1B, CD68, F4/80, or TLR4 mRNAs (Fig. 7).
Fig. 7.

qRT-PCR verification of RNA-seq values for select mRNAs and representative immunohistochemical staining for the total macrophage marker CD68 in positive control (spleen) and in OMAT from lean and obese Ossabaw swine. There were no significant differences between groups for these genes or for CD68 positive staining in OMAT. Note the brown staining of CD68 in the spleen positive control is not present in the OMAT slides.
DISCUSSION
In the current study, we describe for the first time Western diet-induced obesity-associated transcriptomic changes within OMAT in juvenile Ossabaw swine. Across species, increased adiposity and proinflammatory events begin the sequelae leading to insulin resistance, Type 2 diabetes, cardiovascular disease, and certain cancers (4, 68). Our strategy was to analyze OMAT from lean and obese juvenile Ossabaw swine using RNA-seq to uncover novel mRNA changes. The current findings indicate that obesity in juvenile Ossabaw swine is characterized by increases in overall OMAT transcript number and provide novel data describing early transcriptomic alterations that occur in response to excess caloric intake in VAT in a pig model of childhood obesity.
Juvenile Ossabaw pigs fed a Western diet high in fat, fructose, and cholesterol weighed significantly more and had greater % body fat than lean pigs. Consistent with an increase in adiposity, adipocyte hypertrophy was observed in obese OMAT (Fig. 1B). In addition, we observed 37% more individual transcripts (consisting of known mRNAs and unknown transcripts) in OMAT of obese vs. lean pigs (Fig. 2), suggesting that an increased number of unique genes are required to produce/maintain the obese phenotype. To our knowledge, no study has previously reported global transcriptional activity (on/off analysis) of VAT in a diet-induced obesity model. Possible explanations for this observation include: 1) activation of more genes due to increased proliferation and expansion of adipocytes, 2) increased mRNAs from the presence of other cell types in obese OMAT and/or, 3) changes in the metabolic phenotype of one or more cell types in adipose tissue (66). Adipose tissue is a heterogeneous mixture of cell types (including preadipocytes, immune cells, and endothelial cells,) and changes in the number, type, and/or metabolic profile of these cells may be required to accommodate the rapid expansion of adipose tissue, all of which may contribute to our observation of increased transcript number. Future studies are warranted to determine the identity of the unknown transcripts.
The functions of the top-scoring network (inclusive of up- and downregulated mRNAs) (Fig. 4) include three types of “development,” including cardiovascular system, embryonic, and organismal. The functional implications of the IPA networks imply that OMAT in the obese pigs is undergoing rapid growth and development, as evidenced by the gene expression profiles. Adipose tissue development has been reported to be associated with increased expression of genes involved in extracellular matrix remodeling, proliferation, and angiogenesis (24, 36, 43). Consistent with these previous findings, our network analysis identified increased expression of genes associated with the extracellular matrix (EFNA5), proliferation (ASNS), and angiogenesis (ETV6) (33, 74). In addition, while common extracellular matrix proteins such as COL4A1, COLA2, and COL3A1 did not differ between groups, RNA-seq identified LOXL1 as being 2.0-fold higher (P value = 0.003) in juvenile obese pigs. Lysyl oxidase-like 1 (LOXL1) is responsible for catalyzing the cross-linking of elastin and collagen, which is required for structural integrity in tissues (44). In a mouse model of obesity, LOX, an isoform of LOXL1, was stimulated through interactions with HIF1-α and has been shown to play a prominent role in adipose tissue remodeling and more notably fibrosis (22). In terms of vascular development and adaptations to accommodate necessary blood supply, RNA-seq data do not indicate that an increase in vascularity was occurring to the rapidly expanding adipose in the obese swine. In fact, the angiogenic factor vascular endothelial protein tyrosine phosphatase (VE-PTP), homologous to protein tyrosine phosphatase, receptor type, B (PTPRB), was downregulated with juvenile obesity in the current study. VE-PTP is essential for the maintenance and remodeling of blood vessels (5). Taken together, we speculate that angiogenic signaling is likely attenuated in our juvenile obese Ossabaw pigs, but perhaps by different mechanisms than previous described in the adult obesity literature.
The top-scoring upregulated IPA network's top functions include cellular maintenance, connective tissue development, and embryonic development (Fig. 5). Several of the upregulated genes have previously been linked to obesity-associated metabolic changes. For example, expression of activated transcription factor 3 (ATF3), a hypoxia-associated gene, was 2.2-fold higher in our obese vs. lean pigs. Increased ATF3 expression has been previously reported in obese adipose tissue and associated with mitochondrial dysfunction (30). ATF3 also has been shown to function as a transcriptional repressor of saturated fatty acids/toll-like receptor 4 signaling and has been suggested to attenuate obesity-induced macrophage activation (62). In addition, of the 21 mRNAs included in this network, three members of the bone morphogenetic protein (BMP) gene class were upregulated. BMPs are members of the TGF-β family that signal via kinase receptors and intracellular Smad transcription factors. They have been described in various tissues as playing an important role in development and tissue homeostasis (10). The observed increases in BMP3, ADAMTS5, and CTGF are also consistent with a rapidly growing adipose tissue depot, as these genes have been linked to adipose tissue development and expansion (38, 64, 67).
We also assessed the top differentially expressed mRNAs between obese and lean animals. Four out of the top 15 upregulated mRNAs (CYP4B1, MYO9A, GPR35, KLF-11) share putative functions of adipose tissue expansion, metabolic syndrome, and immune function. Three of the four mRNAs have roles in cellular expansion, while two of the four are integral in metabolic control. Cytochrome P450 family 4, subfamily B, polypeptide (CYP4B1) is highly expressed in peripheral tissues and has been reported to be involved in the activation of procarcinogens (3). Expression of CYP4B1 is induced by hypoxia in bladder and lung cancers (47, 50), as well as by peroxisomal proliferator-activated receptor (PPAR) activation (47). The potentially hypoxic environment and/or increased PPAR activation associated with the demands of expanding adipose tissue (17) may account for the observed increase in CYP4B1 in the current study. Myosin-IXA (MYO9A) is required for cell migration and radial actin bundle assembly at nascent cell-cell contacts (53). Recently, MYO9A was discovered to be an important gene for abdominal fat deposition in chickens (76). Together with our data, this suggests a previously unstudied role for MYO9A in adipose tissue expansion. G protein-coupled receptor 35 (GPR35) is associated with immune regulation and metabolic syndrome (45). While the immune function of GPR35 continues to be elucidated, it appears to be associated with certain immune cells and is upregulated under proinflammatory conditions, and agonism results in an anti-inflammatory response (69). Leonard and Chu (42) used a GPR35 agonist in vivo to improve glucose lowering during a glucose tolerance test and reduce free fatty acid plasma levels and in vitro to stimulate glucose uptake in differentiated 3T3-L1 adipocytes. In our study, the increase in GPR35 may reflect changing cell populations in the adipose tissue, an anti-inflammatory response, and/or increasing energy demands of the obese OMAT. Kruppel-like factor 11 (KLF-11) is one of seven known KLFs that is involved with adipocyte biology. It was 2.2-fold higher in obese vs. lean pigs, and KLF-10 was >1.5 higher in obese OMAT, and both are involved in adipogenesis and metabolic control (9, 12).
RNA posttranscriptional modification, lipid metabolism, and small molecule biochemistry were identified as the functions in the top down-regulated IPA network. Each of these 3 predicted functions will be discussed briefly. Serine/arginine-rich splicing factor 1 (SRSF1), which is required for the second step of pre-mRNA splicing (13), was −1.5-fold downregulated in obese pigs, suggesting that obese adipose tissue has lower levels of RNA posttranscriptional modification. In addition, histone deacetylase-3 (HDAC3), which is involved in cellular proliferation, apoptosis, and transcriptional repression, was downregulated in OMAT in obese compared with lean pigs. HDACs are transcription factors that are associated with gene silencing, and aberrant expression is often associated with tumor development (57). Moreover, HDAC3, a transcriptional regulator enzyme that forms a complex with nuclear receptor corepressor (N-CoR) and silencing mediator of retinoic and thyroid receptors (SMRT), is documented to play a role in cellular development, metabolism, and inflammation (35). Partial regulation of lipid metabolism is controlled via circadian oscillating transcription factors, two of them being D-site-binding protein (DBP) and thyrotroph embryonic factor (TEF), which were both downregulated in the OMAT of obese pigs. Both DBP and TEF have been shown to be transcription factors involved in the circadian activity of PPAR-α (18) and, therefore, the subsequent control of lipid metabolism. The function of “small molecule biochemistry” suggested by IPA, although broad, implicates ATP-binding cassette, subfamily B (ABCB1), as playing a role in the downregulated functions in obese pigs. ABCB1 is required for the ATP-dependent transport of phosphatidylcholine across the cell membrane (32). This finding may suggest that, due to chronic insult with fatty acids, obese pig adipocytes downregulate the mRNA for this receptor in an attempt to spare the transport of additional lipid intermediates into the adipocyte.
Adipocyte hypertrophy and the ensuing adipocyte tissue hypoxia have been shown to be involved in adipocyte dysfunction (73), whose consequent proinflammatory environment is implicated in the development of insulin resistance (21). Adipocyte hypertrophy was apparent in OMAT in the obese animals, and while several classical hypoxia genes did not differ between lean and obese pigs (HIF1a, etc.), elevations in CYP4B1 and ATF3 are suggestive of an increasingly hypoxic environment.
Obesity also has been described as a state of low-grade inflammation (26). Numerous studies show that adipose tissue has increased numbers of macrophages and various other immune cells in obese rodents and adult humans (34, 72); however, it is important to note that adipose tissue inflammation may not always be present in all obese adults (2, 40). In the current study, IL-6 mRNA was lowly expressed (RPKM < 1) for both obese and lean swine and did not differ between groups. Furthermore, TNF-α, IL-1β, and TLR-4 were not differentially expressed in OMAT between obese and lean animals. Our qRT-PCR results support these RNA-seq findings, where TNF-α, IL-1β, and TLR-4 mRNA did not differ between groups, and IL-6 was undetectable in the OMAT of these animals. In addition, immunohistochemical staining for the total macrophage marker CD68 did not differ in the OMAT of lean and obese pigs and F4/80 and CD68 gene expression were not significantly different when assessed either by RNA-seq or qRT-PCR. Moreover, plasma and tissue expression levels of inflammatory cytokines that are typically reported to increase with adult obesity (65) did not differ between the lean and obese groups (Fig. 6, Table 2). Despite adipocyte hypertrophy in OMAT in the obese animals, these classic proinflammatory genes were not upregulated, collectively suggesting that these genes may not be upregulated until later on in obesity and disease progression. It recently has been reported that overweight children showed little evidence for macrophages or crown-like structures in adipose tissue (63). This supports our findings in juvenile obese pigs, and we acknowledge that the findings from Tam et al. (63) are in subcutaneous adipose tissue and not omental fat (typically thought to be more proinflammatory), but this may not be that important given recent findings that crown-like structures were present in equal quantities in subcutaneous and omental adipose tissue in obese adults (6). Moreover, preliminary evaluation in other adipose tissue depots in these animals (subcutaneous and retroperitoneal adipose tissue) suggests similar findings (R. S. Rector, unpublished observations). Overall, our findings suggest a dampened proinflammatory environment precedes the dysregulation in other gene networks (i.e., adipose tissue developmental pathways) in this childhood obesity model.
Our current study is not without limitations. To date, this is the most comprehensive analysis of this sort on adipose tissue from any species, making comparisons across species or developmental periods more difficult. Our study used female pigs, and we acknowledge that potential differences may exist between males and females in regard to adipose tissue metabolism. We also acknowledge that our swine model only developed moderate levels of obesity (30% body fat), which perhaps may account for the paucity of expected changes in OMAT inflammation. However, this body fat percentage corresponds well with increased chronic disease risk factors in U.S. children and youth (20). It is also a possibility that a dampened inflammatory OMAT may be an evolutionary advantage for the Ossabaw swine, due to its thrifty genotype and propensity to rapidly accumulate adipose tissue. Another possible explanation for the lack of increased OMAT inflammation in obese Ossabaw swine may be the relative young age of the animals; it has been reported that CD16-CD14+ (proinflammatory) macrophages are increased in the adipose tissue of older obese Ossabaw animals (16). These findings would collectively suggest that perhaps our “lack of findings” is more of a juvenile phenomenon rather than a swine versus human one. Finally, another limitation of the current studies is that we did not seek to identify the unknown transcripts in our analyses (e.g., mRNA, noncoding RNA, short hairpin mRNA, or microRNA).
Conclusions
The need for an increased understanding of adipose tissue expansion and the development of obesity in juvenile models analogous to human childhood obesity is warranted by the childhood obesity epidemic. Our study provides a comprehensive summary of novel transcriptional changes occurring in the OMAT of Western diet-induced obese juvenile Ossabaw pigs. Our study provides global insight into the transcriptomic changes in expanding adipose tissue in a childhood model of Western diet-induced obesity. This dataset provides a foundation for better understanding the developmental implications of early-onset obesity and identifies novel gene targets for future studies.
GRANTS
Funding was provided by University of Missouri Mizzou Advantage (R. S. Rector, J. A. Ibdah, and F. W. Booth), VA-CDA-1299-02 (salary support to R. S. Rector), and a grant from the Allen Foundation, Inc. (R. S. Rector). We acknowledge the support of NIH Grants RR-013223 and HL-062552 to Michael Sturek and the Comparative Medicine Center of IUSM and Purdue University for the female Ossabaw swine used in this study. This work was partially supported with resources and the use of facilities at the Harry S. Truman Memorial Veterans Hospital in Columbia, MO.
DISCLOSURES
No conflicts of interest, financial or otherwise, are declared by the author(s).
AUTHOR CONTRIBUTIONS
Author contributions: R.G.T., K.M.K., J.P., N.T.J., J.W.P.I., and R.S.R. performed experiments; R.G.T., M.D.R., K.D.W., and R.S.R. analyzed data; R.G.T., M.D.R., K.D.W., J.M.C., J.P., N.T.J., J.W.P.I., F.W.B., and R.S.R. interpreted results of experiments; R.G.T. and R.S.R. prepared figures; R.G.T. and R.S.R. drafted manuscript; R.G.T., M.D.R., K.D.W., J.M.C., K.M.K., J.P., N.T.J., J.W.P.I., J.A.I., F.W.B., and R.S.R. edited and revised manuscript; R.G.T., M.D.R., K.D.W., J.M.C., K.M.K., J.P., N.T.J., J.W.P.I., J.A.I., F.W.B., and R.S.R. approved final version of manuscript; J.W.P.I., J.A.I., F.W.B., and R.S.R. conception and design of research.
ACKNOWLEDGMENTS
We gratefully acknowledge the expert technical assistance of Karen J. Nickelson, Kelly Stromsdorfer, Laura Ortinau, Meghan Ruebel, and Grace Meers.
Present address for J. W. Perfield II: Eli Lilly and Company, Lilly Corporate Center, Drop Code 0545, Indianapolis, IN 46285.
REFERENCES
- 1.Amstalden M, Garcia MR, Williams SW, Stanko RL, Nizielski SE, Morrison CD, Keisler DH, Williams GL. Leptin gene expression, circulating leptin, and luteinizing hormone pulsatility are acutely responsive to short-term fasting in prepubertal heifers: relationships to circulating insulin and insulin-like growth factor I(1). Biol Reprod 63: 127–133, 2000 [DOI] [PubMed] [Google Scholar]
- 2.Apovian CM, Bigornia S, Mott M, Meyers MR, Ulloor J, Gagua M, McDonnell M, Hess D, Joseph L, Gokce N. Adipose macrophage infiltration is associated with insulin resistance and vascular endothelial dysfunction in obese subjects. Arteriosclerosis Thromb Vasc Biol 28: 1654–1659, 2008 [DOI] [PMC free article] [PubMed] [Google Scholar]
- 3.Baer BR, Rettie AE. CYP4B1: an enigmatic P450 at the interface between xenobiotic and endobiotic metabolism. Drug Metab Rev 38: 451–476, 2006 [DOI] [PubMed] [Google Scholar]
- 4.Bastard JP, Maachi M, Lagathu C, Kim MJ, Caron M, Vidal H, Capeau J, Feve B. Recent advances in the relationship between obesity, inflammation, and insulin resistance. Eur Cytokine Netw 17: 4–12, 2006 [PubMed] [Google Scholar]
- 5.Baumer S, Keller L, Holtmann A, Funke R, August B, Gamp A, Wolburg H, Wolburg-Buchholz K, Deutsch U, Vestweber D. Vascular endothelial cell-specific phosphotyrosine phosphatase (VE-PTP) activity is required for blood vessel development. Blood 107: 4754–4762, 2006 [DOI] [PubMed] [Google Scholar]
- 6.Bigornia SJ, Farb MG, Mott MM, Hess DT, Carmine B, Fiscale A, Joseph L, Apovian CM, Gokce N. Relation of depot-specific adipose inflammation to insulin resistance in human obesity. Nutr Diabetes 2: e30, 2012 [DOI] [PMC free article] [PubMed] [Google Scholar]
- 7.Bluher M. Adipose tissue dysfunction in obesity. Exp Clin Endocrinol Diabetes 117: 241–250, 2009 [DOI] [PubMed] [Google Scholar]
- 8.Bratz IN, Dick GM, Tune JD, Edwards JM, Neeb ZP, Dincer UD, Sturek M. Impaired capsaicin-induced relaxation of coronary arteries in a porcine model of the metabolic syndrome. Am J Physiol Heart Circ Physiol 294: H2489–H2496, 2008 [DOI] [PubMed] [Google Scholar]
- 9.Brey CW, Nelder MP, Hailemariam T, Gaugler R, Hashmi S. Kruppel-like family of transcription factors: an emerging new frontier in fat biology. Int J Biol Sci 5: 622–636, 2009 [DOI] [PMC free article] [PubMed] [Google Scholar]
- 10.Cai J, Pardali E, Sanchez-Duffhues G, ten Dijke P. BMP signaling in vascular diseases. FEBS Lett 586: 1993–2002, 2012 [DOI] [PubMed] [Google Scholar]
- 11.Cancello R, Tordjman J, Poitou C, Guilhem G, Bouillot JL, Hugol D, Coussieu C, Basdevant A, Bar Hen A, Bedossa P, Guerre-Millo M, Clement K. Increased infiltration of macrophages in omental adipose tissue is associated with marked hepatic lesions in morbid human obesity. Diabetes 55: 1554–1561, 2006 [DOI] [PubMed] [Google Scholar]
- 12.Cao S, Fernandez-Zapico ME, Jin D, Puri V, Cook TA, Lerman LO, Zhu XY, Urrutia R, Shah V. KLF11-mediated repression antagonizes Sp1/sterol-responsive element-binding protein-induced transcriptional activation of caveolin-1 in response to cholesterol signaling. J Biol Chem 280: 1901–1910, 2005 [DOI] [PubMed] [Google Scholar]
- 13.Cazalla D, Newton K, Caceres JF. A novel SR-related protein is required for the second step of Pre-mRNA splicing. Mol Cell Biol 25: 2969–2980, 2005 [DOI] [PMC free article] [PubMed] [Google Scholar]
- 14.Despres JP. Health consequences of visceral obesity. Ann Med 33: 534–541, 2001 [DOI] [PubMed] [Google Scholar]
- 15.Dyson MC, Alloosh M, Vuchetich JP, Mokelke EA, Sturek M. Components of metabolic syndrome and coronary artery disease in female Ossabaw swine fed excess atherogenic diet. Comp Med 56: 35–45, 2006 [PubMed] [Google Scholar]
- 16.Faris RJ, Boddicker RL, Walker-Daniels J, Li J, Jones DE, Spurlock ME. Inflammation in response to n3 fatty acids in a porcine obesity model. Comp Med 62: 495–503, 2012 [PMC free article] [PubMed] [Google Scholar]
- 17.Ferre P. The biology of peroxisome proliferator-activated receptors: relationship with lipid metabolism and insulin sensitivity. Diabetes 53, Suppl 1: S43–S50, 2004 [DOI] [PubMed] [Google Scholar]
- 18.Gachon F, Leuenberger N, Claudel T, Gos P, Jouffe C, Fleury Olela F, de Mollerat du Jeu X, Wahli W, Schibler U. Proline- and acidic amino acid-rich basic leucine zipper proteins modulate peroxisome proliferator-activated receptor alpha (PPARalpha) activity. Proc Natl Acad Sci USA 108: 4794–4799, 2011 [DOI] [PMC free article] [PubMed] [Google Scholar]
- 19.Gealekman O, Guseva N, Hartigan C, Apotheker S, Gorgoglione M, Gurav K, Tran KV, Straubhaar J, Nicoloro S, Czech MP, Thompson M, Perugini RA, Corvera S. Depot-specific differences and insufficient subcutaneous adipose tissue angiogenesis in human obesity. Circulation 123: 186–194, 2011 [DOI] [PMC free article] [PubMed] [Google Scholar]
- 20.Going SB, Lohman TG, Cussler EC, Williams DP, Morrison JA, Horn PS. Percent body fat and chronic disease risk factors in U.S. children and youth. Am J Prev Med 41: S77–S86, 2011 [DOI] [PubMed] [Google Scholar]
- 21.Guilherme A, Virbasius JV, Puri V, Czech MP. Adipocyte dysfunctions linking obesity to insulin resistance and type 2 diabetes. Nat Rev Mol Cell Biol 9: 367–377, 2008 [DOI] [PMC free article] [PubMed] [Google Scholar]
- 22.Halberg N, Khan T, Trujillo ME, Wernstedt-Asterholm I, Attie AD, Sherwani S, Wang ZV, Landskroner-Eiger S, Dineen S, Magalang UJ, Brekken RA, Scherer PE. Hypoxia-inducible factor 1alpha induces fibrosis and insulin resistance in white adipose tissue. Mol Cell Biol 29: 4467–4483, 2009 [DOI] [PMC free article] [PubMed] [Google Scholar]
- 23.Han JC, Lawlor DA, Kimm SY. Childhood obesity. Lancet 375: 1737–1748, 2010 [DOI] [PMC free article] [PubMed] [Google Scholar]
- 24.Hausman GJ, Richardson RL. Adipose tissue angiogenesis. J Anim Sci 82: 925–934, 2004 [DOI] [PubMed] [Google Scholar]
- 25.Hawkins RD, Hon GC, Ren B. Next-generation genomics: an integrative approach. Nat Rev Genet 11: 476–486, 2010 [DOI] [PMC free article] [PubMed] [Google Scholar]
- 26.Heilbronn LK, Campbell LV. Adipose tissue macrophages, low grade inflammation and insulin resistance in human obesity. Curr Pharmaceut Des 14: 1225–1230, 2008 [DOI] [PubMed] [Google Scholar]
- 27.Hotamisligil GS. Inflammatory pathways and insulin action. Int J Obes Rel Metab Dis 27, Suppl 3: S53–S55, 2003 [DOI] [PubMed] [Google Scholar]
- 28.Huang da W, Sherman BT, Lempicki RA. Systematic and integrative analysis of large gene lists using DAVID bioinformatics resources. Nat Protocols 4: 44–57, 2009 [DOI] [PubMed] [Google Scholar]
- 29.Ibrahim MM. Subcutaneous and visceral adipose tissue: structural and functional differences. Obes Rev 11: 11–18, 2010 [DOI] [PubMed] [Google Scholar]
- 30.Jang MK, Son Y, Jung MH. ATF3 plays a role in adipocyte hypoxia-mediated mitochondria dysfunction in obesity. Biochem Biophys Res Commun 431: 421–427, 2013 [DOI] [PubMed] [Google Scholar]
- 31.Johnson LR, Rush JW, Turk JR, Price EM, Laughlin MH. Short-term exercise training increases ACh-induced relaxation and eNOS protein in porcine pulmonary arteries. J Appl Physiol 90: 1102–1110, 2001 [DOI] [PubMed] [Google Scholar]
- 32.Kalin N, Fernandes J, Hrafnsdottir S, van Meer G. Natural phosphatidylcholine is actively translocated across the plasma membrane to the surface of mammalian cells. J Biol Chem 279: 33228–33236, 2004 [DOI] [PubMed] [Google Scholar]
- 33.Kalinski T, Ropke A, Sel S, Kouznetsova I, Ropke M, Roessner A. Down-regulation of ephrin-A5, a gene product of normal cartilage, in chondrosarcoma. Hum Pathol 40: 1679–1685, 2009 [DOI] [PubMed] [Google Scholar]
- 34.Kanda H, Tateya S, Tamori Y, Kotani K, Hiasa K, Kitazawa R, Kitazawa S, Miyachi H, Maeda S, Egashira K, Kasuga M. MCP-1 contributes to macrophage infiltration into adipose tissue, insulin resistance, and hepatic steatosis in obesity. J Clin Invest 116: 1494–1505, 2006 [DOI] [PMC free article] [PubMed] [Google Scholar]
- 35.Karagianni P, Wong J. HDAC3: taking the SMRT-N-CoRrect road to repression. Oncogene 26: 5439–5449, 2007 [DOI] [PubMed] [Google Scholar]
- 36.Khan T, Muise ES, Iyengar P, Wang ZV, Chandalia M, Abate N, Zhang BB, Bonaldo P, Chua S, Scherer PE. Metabolic dysregulation and adipose tissue fibrosis: role of collagen VI. Mol Cell Biol 29: 1575–1591, 2009 [DOI] [PMC free article] [PubMed] [Google Scholar]
- 37.Korsic M, Gotovac K, Nikolac M, Dusek T, Skegro M, Muck-Seler D, Borovecki F, Pivac N. Gene expression in visceral and subcutaneous adipose tissue in overweight women. Front Biosci 4: 2834–2844, 2012 [DOI] [PubMed] [Google Scholar]
- 38.Koza RA, Nikonova L, Hogan J, Rim JS, Mendoza T, Faulk C, Skaf J, Kozak LP. Changes in gene expression foreshadow diet-induced obesity in genetically identical mice. PLoS Genet 2: e81, 2006 [DOI] [PMC free article] [PubMed] [Google Scholar]
- 39.Lassaletta AD, Chu LM, Robich MP, Elmadhun NY, Feng J, Burgess TA, Laham RJ, Sturek M, Sellke FW. Overfed Ossabaw swine with early stage metabolic syndrome have normal coronary collateral development in response to chronic ischemia. Basic Res Cardiol 107: 243, 2012 [DOI] [PMC free article] [PubMed] [Google Scholar]
- 40.Le KA, Mahurkar S, Alderete TL, Hasson RE, Adam TC, Kim JS, Beale E, Xie C, Greenberg AS, Allayee H, Goran MI. Subcutaneous adipose tissue macrophage infiltration is associated with hepatic and visceral fat deposition, hyperinsulinemia, and stimulation of NF-kappaB stress pathway. Diabetes 60: 2802–2809, 2011 [DOI] [PMC free article] [PubMed] [Google Scholar]
- 41.Leek JT, Taub MA, Rasgon JL. A statistical approach to selecting and confirming validation targets in -omics experiments. BMC Bioinformatics 13: 150, 2012 [DOI] [PMC free article] [PubMed] [Google Scholar]
- 42.Leonard J, Chu ZL. GPR35 and modulators thereof for the treatment of metabolic-related disorders. United States Patent Application Publication US20070077602 A1, 2006
- 43.Li J, Yu X, Pan W, Unger RH. Gene expression profile of rat adipose tissue at the onset of high-fat-diet obesity. Am J Physiol Endocrinol Metab 282: E1334–E1341, 2002 [DOI] [PubMed] [Google Scholar]
- 44.Liu Y, Lv B, He Z, Zhou Y, Han C, Shi G, Gao R, Wang C, Yang L, Song H, Yuan W. Lysyl oxidase polymorphisms and susceptibility to osteosarcoma. PLoS One 7: e41610, 2012 [DOI] [PMC free article] [PubMed] [Google Scholar] [Retracted]
- 45.Mackenzie AE, Lappin JE, Taylor DL, Nicklin SA, Milligan G. GPR35 as a novel therapeutic target. Front Endocrinol 2: 68, 2011 [DOI] [PMC free article] [PubMed] [Google Scholar]
- 46.Marioni JC, Mason CE, Mane SM, Stephens M, Gilad Y. RNA-seq: an assessment of technical reproducibility and comparison with gene expression arrays. Genome Res 18: 1509–1517, 2008 [DOI] [PMC free article] [PubMed] [Google Scholar]
- 47.Mastyugin V, Aversa E, Bonazzi A, Vafaes C, Mieyal P, Schwartzman ML. Hypoxia-induced production of 12-hydroxyeicosanoids in the corneal epithelium: involvement of a cytochrome P-4504B1 isoform. J Pharmacol Exp Therapeut 289: 1611–1619, 1999 [PubMed] [Google Scholar]
- 48.Maury E, Ehala-Aleksejev K, Guiot Y, Detry R, Vandenhooft A, Brichard SM. Adipokines oversecreted by omental adipose tissue in human obesity. Am J Physiol Endocrinol Metab 293: E656–E665, 2007 [DOI] [PubMed] [Google Scholar]
- 49.McIntyre LM, Lopiano KK, Morse AM, Amin V, Oberg AL, Young LJ, Nuzhdin SV. RNA-seq: technical variability and sampling. BMC Genomics 12: 293, 2011 [DOI] [PMC free article] [PubMed] [Google Scholar]
- 50.Mezentsev A, Mastyugin V, Seta F, Ashkar S, Kemp R, Reddy DS, Falck JR, Dunn MW, Laniado-Schwartzman M. Transfection of cytochrome P4504B1 into the cornea increases angiogenic activity of the limbal vessels. J Pharmacol Exp Therapeut 315: 42–50, 2005 [DOI] [PubMed] [Google Scholar]
- 51.Mozaffarian D, Afshin A, Benowitz NL, Bittner V, Daniels SR, Franch HA, Jacobs DR, Jr, Kraus WE, Kris-Etherton PM, Krummel DA, Popkin BM, Whitsel LP, Zakai NA, American Heart Association Council on Epidemiology and Prevention, Council on Nutrition, Physical Activity and Metabolism, Council on Clinical Cardiology, Council on Cardiovascular Disease in the Young, Council on the Kidney in Cardiovasc Population approaches to improve diet, physical activity, and smoking habits: a scientific statement from the American Heart Association. Circulation 126: 1514–1563, 2012 [DOI] [PMC free article] [PubMed] [Google Scholar]
- 52.Neeb ZP, Edwards JM, Alloosh M, Long X, Mokelke EA, Sturek M. Metabolic syndrome and coronary artery disease in Ossabaw compared with Yucatan swine. Comp Med 60: 300–315, 2010 [PMC free article] [PubMed] [Google Scholar]
- 53.Omelchenko T, Hall A. Myosin-IXA regulates collective epithelial cell migration by targeting RhoGAP activity to cell-cell junctions. Curr Biol 22: 278–288, 2012 [DOI] [PMC free article] [PubMed] [Google Scholar]
- 54.Ostergaard S, Chagunda MG, Friggens NC, Bennedsgaard TW, Klaas IC. A stochastic model simulating pathogen-specific mastitis control in a dairy herd. J Dairy Sci 88: 4243–4257, 2005 [DOI] [PubMed] [Google Scholar]
- 55.Padilla J, Jenkins NT, Lee S, Zhang H, Cui J, Zuidema MY, Zhang C, Hill MA, Perfield JW, 2nd, Ibdah JA, Booth FW, Davis JW, Laughlin MH, Rector RS. Vascular transcriptional alterations produced by juvenile obesity in Ossabaw swine. Physiol Genomics 45: 434–446, 2013 [DOI] [PMC free article] [PubMed] [Google Scholar]
- 56.Roberts MD, Brown JD, Company JM, Oberle LP, Heese AJ, Toedebusch RG, Wells KD, Cruthirds CL, Knouse JA, Ferreira JA, Childs TE, Brown M, Booth FW. Phenotypic and molecular differences between rats selectively bred to voluntarily run high vs. low nightly distances. Am J Physiol Regul Integr Comp Physiol 304: R1024–R1035, 2013 [DOI] [PMC free article] [PubMed] [Google Scholar]
- 57.Ropero S, Esteller M. The role of histone deacetylases (HDACs) in human cancer. Mol Oncol 1: 19–25, 2007 [DOI] [PMC free article] [PubMed] [Google Scholar]
- 58.Rosen ED, Spiegelman BM. Adipocytes as regulators of energy balance and glucose homeostasis. Nature 444: 847–853, 2006 [DOI] [PMC free article] [PubMed] [Google Scholar]
- 59.Sbarbati A, Osculati F, Silvagni D, Benati D, Galie M, Camoglio FS, Rigotti G, Maffeis C. Obesity and inflammation: evidence for an elementary lesion. Pediatrics 117: 220–223, 2006 [DOI] [PubMed] [Google Scholar]
- 60.Singh AS, Mulder C, Twisk JW, van Mechelen W, Chinapaw MJ. Tracking of childhood overweight into adulthood: a systematic review of the literature. Obes Rev 9: 474–488, 2008 [DOI] [PubMed] [Google Scholar]
- 61.Spencer M, Unal R, Zhu B, Rasouli N, McGehee RE, Jr, Peterson CA, Kern PA. Adipose tissue extracellular matrix and vascular abnormalities in obesity and insulin resistance. J Clin Endocrinol Metab 96: E1990–E1998, 2011 [DOI] [PMC free article] [PubMed] [Google Scholar]
- 62.Suganami T, Yuan X, Shimoda Y, Uchio-Yamada K, Nakagawa N, Shirakawa I, Usami T, Tsukahara T, Nakayama K, Miyamoto Y, Yasuda K, Matsuda J, Kamei Y, Kitajima S, Ogawa Y. Activating transcription factor 3 constitutes a negative feedback mechanism that attenuates saturated Fatty acid/toll-like receptor 4 signaling and macrophage activation in obese adipose tissue. Circ Res 105: 25–32, 2009 [DOI] [PubMed] [Google Scholar]
- 63.Tam CS, Tordjman J, Divoux A, Baur LA, Clement K. Adipose tissue remodeling in children: the link between collagen deposition and age-related adipocyte growth. J Clin Endocrinol Metab 97: 1320–1327, 2012 [DOI] [PubMed] [Google Scholar]
- 64.Tan JT, McLennan SV, Williams PF, Rezaeizadeh A, Lo LW, Bonner JG, Twigg SM. Connective tissue growth factor/CCN-2 is upregulated in epididymal and subcutaneous fat depots in a dietary-induced obesity model. Am J Physiol Endocrinol Metab 304: E1291–E1302, 2013 [DOI] [PubMed] [Google Scholar]
- 65.Tchernof A, Despres JP. Pathophysiology of human visceral obesity: an update. Physiol Rev 93: 359–404, 2013 [DOI] [PubMed] [Google Scholar]
- 66.Trayhurn P. Hypoxia and adipose tissue function and dysfunction in obesity. Physiol Rev 93: 1–21, 2013 [DOI] [PubMed] [Google Scholar]
- 67.Voros G, Sandy JD, Collen D, Lijnen HR. Expression of aggrecan(ases) during murine preadipocyte differentiation and adipose tissue development. Biochim Biophys Acta 1760: 1837–1844, 2006 [DOI] [PubMed] [Google Scholar]
- 68.Vucenik I, Stains JP. Obesity and cancer risk: evidence, mechanisms, and recommendations. Ann NY Acad Sci 1271: 37–43, 2012 [DOI] [PMC free article] [PubMed] [Google Scholar]
- 69.Wang J, Simonavicius N, Wu X, Swaminath G, Reagan J, Tian H, Ling L. Kynurenic acid as a ligand for orphan G protein-coupled receptor GPR35. J Biol Chem 281: 22021–22028, 2006 [DOI] [PubMed] [Google Scholar]
- 70.Wang Z, Gerstein M, Snyder M. RNA-Seq: a revolutionary tool for transcriptomics. Nat Rev Genet 10: 57–63, 2009 [DOI] [PMC free article] [PubMed] [Google Scholar]
- 71.Weintraub WS, Daniels SR, Burke LE, Franklin BA, Goff DC, Jr, Hayman LL, Lloyd-Jones D, Pandey DK, Sanchez EJ, Schram AP, Whitsel LP, American Heart Association Advocacy Coordinating Committee, Council on Cardiovascular Disease in the Young, Council on the Kidney in Cardiovascular Disease, Council on Epidemiology and Prevention, Council on Cardiovascular Nursing, Council on Arterioschlerosis, Thrombosis, Vascular Biology, Council on Clinical Cardiology, and Stroke Council Value of primordial and primary prevention for cardiovascular disease: a policy statement from the American Heart Association. Circulation 124: 967–990, 2011 [DOI] [PubMed] [Google Scholar]
- 72.Weisberg SP, McCann D, Desai M, Rosenbaum M, Leibel RL, Ferrante AW., Jr Obesity is associated with macrophage accumulation in adipose tissue. J Clin Invest 112: 1796–1808, 2003 [DOI] [PMC free article] [PubMed] [Google Scholar]
- 73.Ye J. Emerging role of adipose tissue hypoxia in obesity and insulin resistance. Int J Obes 33: 54–66, 2009 [DOI] [PMC free article] [PubMed] [Google Scholar]
- 74.Ye J, Kumanova M, Hart LS, Sloane K, Zhang H, De Panis DN, Bobrovnikova-Marjon E, Diehl JA, Ron D, Koumenis C. The GCN2-ATF4 pathway is critical for tumour cell survival and proliferation in response to nutrient deprivation. EMBO J 29: 2082–2096, 2010 [DOI] [PMC free article] [PubMed] [Google Scholar]
- 75.Yudkin JS. Adipose tissue, insulin action and vascular disease: inflammatory signals. Int J Obes Rel Metab Dis 27, Suppl 3: S25–S28, 2003 [DOI] [PubMed] [Google Scholar]
- 76.Zhang H, Wang SZ, Wang ZP, Da Y, Wang N, Hu XX, Zhang YD, Wang YX, Leng L, Tang ZQ, Li H. A genome-wide scan of selective sweeps in two broiler chicken lines divergently selected for abdominal fat content. BMC Genomics 13: 704, 2012 [DOI] [PMC free article] [PubMed] [Google Scholar]