

Abstract
Concentric hypertrophy is characterized by ventricular wall thickening, fibrosis, and decreased myocyte length-to-width aspect ratio. Ventricular thickening is considered compensatory because it reduces wall stress, but the functional consequences of cell shape remodeling in this pathological setting are unknown. We hypothesized that decreases in myocyte aspect ratio allow myocytes to maximize contractility when the extracellular matrix becomes stiffer due to conditions such as fibrosis. To test this, we engineered neonatal rat ventricular myocytes into rectangles mimicking the 2-D profiles of healthy and hypertrophied myocytes on hydrogels with moderate (13 kPa) and high (90 kPa) elastic moduli. Actin alignment was unaffected by matrix elasticity, but sarcomere content was typically higher on stiff gels. Microtubule polymerization was higher on stiff gels, implying increased intracellular elastic modulus. On moderate gels, myocytes with moderate aspect ratios (∼7:1) generated the most peak systolic work compared with other cell shapes. However, on stiffer gels, low aspect ratios (∼2:1) generated the most peak systolic work. To compare the relative contributions of intracellular vs. extracellular elasticity to contractility, we developed an analytical model and used our experimental data to fit unknown parameters. Our model predicted that matrix elasticity dominates over intracellular elasticity, suggesting that the extracellular matrix may potentially be a more effective therapeutic target than microtubules. Our data and model suggest that myocytes with lower aspect ratios have a functional advantage when the elasticity of the extracellular matrix decreases due to conditions such as fibrosis, highlighting the role of the extracellular matrix in cardiac disease.
Keywords: cell shape, traction force microscopy, contraction, biophysics
cardiovascular diseases, such as heart failure, are the leading cause of death in the United States (43). Heart failure is usually initiated by a pathological stimulus, such as hypertension or aortic valve stenosis, that increases hemodynamic afterload on the left ventricle (14). In response to elevated load, the ventricular wall thickens to normalize wall stress, known as concentric hypertrophy (27, 37). This gross morphological change in organ structure is potentiated by changes in cell shape, as myocytes widen by adding sarcomeres in parallel and decrease their length-to-width aspect ratio (2, 23). These initial stages of concentric hypertrophy are considered compensatory because the myocardium is adapting structurally and functionally to an increased load (2). However, at some point, the growth becomes pathological with changes in gene expression (32, 49), signaling (52), metabolism (7, 35), and calcium handling (12), and the combination of some or all of these factors leads to ventricular dilation and failure.
Concentric hypertrophy is also characterized by fibrosis and increased myocardial stiffness due to elevated collagen content and cross-linking (11, 21, 29, 37, 61). Increased myocardial stiffness has been linked to cardiac dysfunction in several pathologies, such as aortic valve disease (57), diastolic heart failure (64), volume overload (28), amyloidosis (10), diabetes (56), and aging (1). On the cellular level, concentric hypertrophy activates extensive pathological remodeling of the myocyte cytoskeleton (42, 49), including myofibril remodeling (38) and decreases in myocyte aspect ratio (2, 23). Myocytes isolated from hypertrophied hearts also have hyperpolymerized tubulin compared with healthy myocytes (53–55), which has motivated the hypothesis that microtubules underlie contractile dysfunction in concentric hypertrophy by resisting compression, impeding cell shortening (53–55), and increasing intracellular elastic modulus (58, 59). Collectively, these clinical and in vivo studies suggest that both fibrosis and pathological cytoskeletal remodeling contribute to contractile dysfunction in concentric hypertrophy. However, the concurrent, and coupled, remodeling of the extracellular matrix, myocyte shape, and cytoskeletal structures makes it difficult to understand their relative contributions to reduced cardiac output.
To investigate how the elasticity of the microenvironment may regulate myocyte phenotype, cardiac myocytes have been cultured on substrates tuned to match the elastic moduli of healthy and fibrotic myocardium (4, 15, 16, 33, 41). These studies have revealed that cardiomyogenesis (16, 33), spontaneous beat rate, work output (15), and cell-cell coupling (41) are optimal on substrates with physiological elastic modulus, indicating that the mechanical properties of the microenvironment regulate myocyte function. In vitro work has also revealed that cytoskeletal architecture (6, 22) and contractile force generation (36) are dependent on myocyte shape, another important regulator of myocyte phenotype (42, 48). Here, we asked how both the elastic modulus of the extracellular matrix and myocyte shape regulate contractility. To investigate this, we cultured shape-controlled neonatal rat ventricular myocytes on hydrogels with moderate (13 kPa) and high (90 kPa) elastic moduli to mimic normal and stiff myocardium, respectively. Actin architecture was unaffected by matrix elasticity, but microtubule polymerization increased on stiff gels, suggestive of an increase in intracellular elastic modulus. Peak systolic work was optimal at aspect ratio ∼7:1 on physiological matrix elasticity and ∼2:1 on pathological matrix elasticity, similar to the moderate (∼7:1) and low (∼4–5:1) aspect ratios observed in healthy and hypertrophied hearts, respectively (2, 23). To explain our experimental results and delineate the contributions of intracellular and extracellular elasticity, we developed a mathematical model, which predicted that extracellular elasticity has a greater pathological impact on contractility than intracellular elasticity, thereby identifying the extracellular matrix as a potentially more effective therapeutic target than microtubules. Together, our results suggest that myocyte contractility depends on both myocyte shape and the elasticity of the extracellular matrix.
METHODS
Polyacrylamide gel preparation.
Polyacrylamide gel substrates were fabricated using previously published protocols (36, 41). Glass coverslips (25 mm) were activated by treatment with 100 mM NaOH for 5 min, 0.5% (3-aminopropyl)-triethoxysilane in 95% ethanol for 5 min, and 0.5% glutaraldehyde for 30 min. Polyacrylamide gel solutions with 13-kPa and 90-kPa elastic modulus were created with the following acrylamide/bis concentrations: 13 kPa, 7.5/0.3%; 90 kPa, 12/0.6%. Gel solutions were doped with 200 nm Alexa 488 fluorescent beads (Invitrogen, Carlsbad, CA) at a 1:100 dilution and streptavidin acrylamide (S-21379, Invitrogen). Tetramethylethylenediamine (0.25%) and ammonium persulfate (0.08%) were added to cross-link gel solutions. Fifteen to 20 μl of gel solution was pipetted onto activated coverslips and covered with 18-mm untreated glass coverslips. After 15 min, gels were polymerized and the top coverslip was removed. Gels were rinsed and stored in PBS at 4°C. Prior to microcontact printing, the surface of the gels was dried by incubating in a 37°C oven for 10–15 min.
Microcontact printing.
Polydimethylsiloxane (Sylgard 184, Dow Corning, Midland, MI) stamps were prepared using standard microfabrication techniques (6, 9). We designed a pattern of rectangles with conserved surface area (∼1,200 μm2) and varying aspect ratios: 2:1 (25 μm × 50 μm), 4:1 (17 μm × 68 μm), 8:1 (12 μm × 96 μm), and 12:1 (10 μm × 120 μm) in AutoCAD (Autodesk, San Rafael, CA), which was etched onto a photolithographic mask. The mask was used to shield selective areas of a silicon wafer spin-coated with SU-8 2002 (Microchem, Newton, MA) from UV light exposure using a mask aligner (ABM, Woburn, MA). Exposed wafers were baked, incubated in SU-8 Developer (Microchem, Newton, MA), cleaned with isopropyl alcohol, and used as templates for stamps.
Biotinylated fibronectin (FN) was prepared by incubating human FN (BD Biosciences, Franklin Lakes, NJ) with Sulfo-NHS-LC-Biotin (Pierce, Rockford, IL) overnight (41). Stamps were sonicated in 95% ethanol, dried, and coated with 200 μg/ml biotinylated FN. After 1 h, excess FN solution was blown off the stamps with compressed air and stamps were inverted onto dried polyacrylamide gel surfaces. Stamps were then peeled off the gels, and coverslips were stored in PBS at 4°C until cell seeding.
Neonatal rat ventricular myocyte culture.
Two-day-old Sprague-Dawley rats were euthanized according to protocols approved by the Harvard University Animal Care and Use Committee (6). Ventricular tissue was isolated, minced, and placed in trypsin solution (1 mg/ml, Invitrogen) overnight at 4°C. After 11–13 h, tissues were incubated in collagenase solution (1 mg/ml, Worthington Biochemical, Lakewood, NJ) at 37°C and pipetted several times to dissociate tissues and form a cell suspension. Cell suspensions were strained to remove undigested tissue and preplated twice to reduce nonmyocyte cell populations. Purified cell suspensions were seeded onto gel coverslips at a concentration of 10,000–50,000 cells/cm2 and cultured in supplemented M199 (10 mM HEPES, 0.1 mM MEM nonessential amino acids, 20 mM glucose, 2 mM l-glutamine, 1.5 μM vitamin B-12, and 50 U/ml penicillin) with 10% heat-inactivated fetal bovine serum for the first 48 h and 2% fetal bovine serum for the remainder of time in culture. Myocytes were treated with 0.2 μM epinephrine after 3 days in culture to stimulate spontaneous beating.
Immunostaining.
To stain for actin and α-actinin, myocyte coverslips were fixed with 4% paraformaldehyde and 0.05% Triton X for 5 min. To stain for microtubules, coverslips were rinsed with 37°C microtubule stabilizing buffer (65 mM PIPES, 25 mM HEPES, 10 mM EGTA, 3 mM MgCl2, pH 6.9), permeabilized with 1% Triton in microtubule stabilizing buffer for 1 min, and fixed in 3% paraformaldehyde in microtubule stabilizing buffer for 10 min (45).
Mouse anti-α-actinin (Sigma-Aldrich, St. Louis, MO) or mouse anti-α-tubulin (Sigma-Aldrich, St. Louis, MO) antibodies were added at 1:200 for 1–2 h at room temperature. The following secondary antibodies and dyes were added at 1:200 for 1–2 h at room temperature: DAPI (Invitrogen), Alexa Fluor 488 phalloidin (Invitrogen), and Alexa Fluor 546 goat anti-mouse IgG (H + L) (Invitrogen). Stained coverslips were mounted on a glass slide using ProLong Gold Anti-Fade Reagent (Invitrogen).
Imaging and image processing.
Stained myocytes were imaged using a Zeiss LSM 5 LIVE confocal microscope (Zeiss, Oberkochen, Germany). Z-stacks of individual myocytes were collected using a 100× Plan-Apochromat oil objective. For actin z-stacks, software based on fingerprint detection algorithms was used to identify orientation vectors of positive pixels in maximum projection images (18). The orientational order parameter of the vectors was then calculated, which ranges from 0 for completely isotropic systems to 1 for completely anisotropic systems (25). To determine sarcomere length and sarcomere content, sarcomeric α-actinin immunostains were first preprocessed in ImageJ (NIH, Bethesda, MD) to highlight the filamentous structure of the cell cytoskeleton through a tubeness operator (46) and then analyzed in Matlab (Mathworks, Natick, MA). The nonconstant portion of the image spectrum was computed by applying a 2-D fast Fourier transform. The 2-D spectrum was further radially integrated to yield a 1-D representation of the image spectrum: peaks in this representation correspond to spatial frequencies that are overrepresented in an image. The 1-D representation was then fit with Gaussian peaks to extract the periodic component with spatial frequency consistent with sarcomere length. The area under the periodic component was regarded as a metric of sarcomere content. A larger area means more sarcomeric α-actinin positive pixels are localized at a distance comparable with the sarcomere length. Cell height was calculated by measuring the height of orthogonal views of α-actinin z-stacks. Statistical differences were detected using Student's t-test.
Western blots.
Cardiac myocytes were cultured on 15-μm-wide micropatterned lines of FN with 15-μm separations on 13-kPa and 90-kPa polyacrylamide gels using the stamping protocol described above. We adapted previously published protocols to quantify soluble and polymerized tubulin (17). After rinsing samples with 4°C PBS, lysis buffer for soluble fractions (100 mM NaCl, 1 mM EDTA, 1% Triton X, 10% glycerol, 10 mM Tris, pH 7.4 in water) was added to samples for several minutes, collected, and centrifuged for 10 min at maximum speed. Supernatants were collected as soluble fractions. Samples were rinsed again in 4°C PBS and incubated with lysis buffer for polymerized fractions (soluble lysis buffer plus 1% SDS) for several minutes. Samples were scraped and buffers were collected as polymerized fractions. For both lysis buffers, Halt Protease and Phosphatase Inhibitor Cocktail (Thermo Scientific, Waltham, MA) was added immediately before lysing samples. One or two coverslips at 13-kPa and 90-kPa elastic modulus were collected for three separate primary harvests, and each harvest cycle was run on its own gel.
Protein concentrations were determined using the bicinchoninic acid (BCA) assay (Thermo Scientific). For each sample, 10–20 μg of protein (consistent for all lanes on the same gel) was mixed with 6X Laemmli sample buffer, loaded in Criterion Tris·HCl, 4–15% precast polyacrylamide gels (Bio-Rad, Hercules, CA), and separated using SDS-PAGE. Proteins were transferred to Odyssey nitrocellulose membranes (LI-COR, Lincoln, NE). Membranes were blocked with Odyssey blocking buffer (LI-COR) for 1 h at room temperature and incubated with the following primary antibodies for 48 h at 4°C: mouse anti-α-tubulin (Sigma-Aldrich, St. Louis, MO) and goat-anti-β-actin (Santa Cruz, Dallas, TX). Membranes were rinsed and incubated with IRDye 800CW donkey anti-goat IgG (H + L) (LI-COR) for 1 h at room temperature (RT) followed by IRDye 680 goat anti-mouse IgG (H + L) (LI-COR) for 1 h at RT. Membranes were imaged with the Odyssey CLx infrared imaging system (LI-COR).
ImageJ was used to quantify band intensities. For each lane, tubulin signal (T) was normalized (norm) to β-actin signal (A) for polymerized (P) and soluble (S) fractions:
| (1) |
| (2) |
| (3) |
| (4) |
For lanes from the same coverslip, the polymerized tubulin signal was divided by the total tubulin signal to determine the polymerized fraction:
| (5) |
| (6) |
For each gel, the polymerized tubulin fraction at 90 kPa was divided by the polymerized tubulin fraction at 13 kPa to get a relative change in polymerized tubulin with matrix elasticity for each harvest:
| (7) |
| (8) |
Statistical differences were detected using Student's t-test.
Traction force microscopy.
Myocytes on polyacrylamide gel coverslips were transferred to normal Tyrode's solution (1.8 mM CaCl2, 5 mM glucose, 5 mM HEPES, 1 mM MgCl2, 5.4 mM KCl, 135 mM NaCl, 0.33 mM NaH2PO4, pH 7.4) and placed on the stage of a Zeiss LSM 5 LIVE confocal microscope (Zeiss, Oberkochen, Germany) with an incubation chamber set to 35–37°C. Coverslips were scanned to find spontaneously beating, mononucleated, patterned myocytes, and several cycles were captured for each cell with a 40× Plan-Apochromat oil objective at 40 frames/s. After imaging, the coverslip was removed from the microscope, fixed, and stained using the protocol described above. Previously published techniques were used to determine displacement and traction stress vector fields from bead displacement movies using Fourier transform traction cytometry in MATLAB (Mathworks) (8, 36, 41). Statistical differences were detected using Student's t-test.
Percent cell shortening at peak systole (εp) was calculated by summing the x-magnitudes of the maximum displacement vectors (ux,i) on the left (l) and right (r) ends of the cell, respectively, and dividing by the diastolic length of the cell (L):
| (9) |
Longitudinal force vectors (fx,i) were calculated by multiplying the longitudinal traction stress vectors at each element i by the surface area of element i (in this case, 25 μm2). Peak systolic longitudinal force (Fx,p) was calculated by summing the x-magnitudes of all force vectors (fx,i) on the left (l) and right (r) sides of the cell and dividing by 2 to determine the average force at each end of the cell:
| (10) |
Peak systolic stress (σp) was calculated as
| (11) |
where b is the average width and H is the average height of the cell for a given aspect ratio.
Peak systolic work (wp) was calculated as
| (12) |
Single-myocyte mathematical model.
We developed a theoretical model of a force-generating myocyte to calculate how contractile force is regulated by cell dimensions, matrix elasticity, and cell elasticity. The purpose of our model is to gain independent control over matrix elasticity and cell elasticity, which are challenging to decouple experimentally, and determine which parameter has the greatest effect on contractile function. Our model solves for peak systolic percent cell shortening (εp), longitudinal force (Fx,p), stress (σp), and longitudinal work (wx,p) based on myocyte dimensions and the elastic moduli of the matrix (Em) and the cell (Ec).
Traction force microscopy experiments of contracting rectangular myocytes have revealed that force vectors are concentrated at the two ends of the cell, where focal adhesions link the longitudinal ends of myofibrils to the extracellular matrix (36). Thus we simplified single myocytes as rectangular-shaped arrays of parallel myofibrils anchored to matrix substrates with defined elastic moduli. With this simplification, the mechanics of single cell contraction is similar to traditional measurements of cardiac trabecular muscle (20), although cell contraction in TFM is neither isometric nor isotonic because both cell shortening and stress increase with time.
Based on the assumption that single myocytes behave similarly to muscle strips (13), we applied constitutive laws for muscle contraction to relate myocyte stress generation (σ) to percent cell shortening (ε). One of the fundamental tenants of muscle physiology is the force-velocity relationship (62), which states that the force generated by a muscle increases as the velocity of shortening decreases (Fig. 1A). This phenomenon exists because more cross-bridges have time to attach if contraction velocity is slower (62). To incorporate this relationship into our model, we utilized a linearized form of the force-velocity relationship (13) based on Hill's muscle law:
| (13) |
where contractile stress (σ) linearly increases as the rate of percent cell shortening (dε/dt) decreases (Fig. 1A). The parameter σ0 is the isometric stress, defined as σ when dε/dt = 0, and is equivalent to the load against which myocytes do not shorten or lengthen. The parameter γ is the maximum percent cell shortening rate, defined as dε/dt when σ = 0. We assume uniform stress and percent shortening within the cell. Thus Eq. 13 describes how stress (σ) is regulated by the rate of percent cell shortening (dε/dt), as governed by intrinsic muscle physiology.
Fig. 1.

Modeling stress-strain relationships in single cardiac myocytes. A: the force-velocity relationship in muscle states that stress (σ) decreases as velocity of percent shortening (dε/dt) increases (solid line). A linearized form of the force-velocity relationship based on Hill's muscle law is indicated with the dashed line. The slope of this line is the isometric stress (σ0) divided by the constant γ, which is the percent shortening velocity at no load. B: myocytes were treated as rectangular plates with an intrinsic cell elastic modulus Ec attached to substrates with matrix elastic modulus Em. As a myocyte generates stress (σ) from diastole (i) to systole (ii), it shortens εL/2 at each end to generate a longitudinal force against the matrix (Fx). The cell and the matrix both resist cell shortening. C: cell height was measured using confocal z-stacks of actin stains and was relatively constant at 3 μm. For 13-kPa gels, n = 5 for aspect ratio (AR) ∼2:1, n = 6 for AR ∼4:1, n = 5 for AR ∼7:1, and n = 4 for AR ∼10:1. For 90-kPa gels, n = 5 for AR ∼2:1, n = 6 for AR ∼4:1, n = 5 for AR ∼7:1, and n = 5 for AR ∼11:1. Bars represent standard error of the mean (SE). D: cell surface area was also relatively constant at 1,200 μm2, matching the size of the micropatterned fibronectin islands. For 13-kPa gels, n = 7 for AR ∼2:1, n = 9 for AR ∼4:1, n = 7 for AR ∼7:1, and n = 6 for AR ∼10:1. For 90-kPa gels, n = 8 for AR ∼2:1, n = 11 for AR ∼4:1, n = 12 for AR ∼7:1, and n = 7 for AR ∼11:1. Bars represent SE.
Because both extracellular and intracellular elasticity regulate cell shortening, we next formulated a purely mechanical equation to describe force generation as a function of cell elastic modulus and matrix elastic modulus. We assumed that the amount of longitudinal force transmitted to the matrix (Fx), which is the value captured by our TFM measurements, is equal to the total longitudinal force generated by the cell (Ftotal) minus the load due to the longitudinal cell modulus (Fcell):
| (14) |
To calculate Ftotal, we considered the cell as a rectangular plate (Fig. 1B). The total longitudinal force generated by a myocyte (Ftotal) is then equal to the stress (σ) multiplied by the cross-sectional area of the cell, bH, where H is the height and b is the width of the cell:
| (15) |
The load due to cell elasticity, Fcell, is calculated by multiplying the transient elastic modulus of the cell (Ec) by percent cell shortening (ε) and cross-sectional area (bH):
| (16) |
The relationship between traction force (Fx), substrate displacement (u), and matrix modulus (Em) can be derived as follows. Suppose a cell has a single circular focal adhesion with diameter b at each end. When the cell contracts, it applies a horizontal traction force Fx onto the elastic substrate within the area of the focal adhesion. Assuming uniform displacement u within the circular focal adhesion region and assuming the substrate is an elastic half-space with Young's modulus Em and Poisson ratio ν, contact mechanics theory (34) gives the relation between traction force (Fx) and displacement (u) as:
| (17) |
Note that this relationship is derived without ignoring any substrate deformation; it is a lumped relationship between force and displacement. In our case, displacement (u) can be described via cell shortening strain (ε) based on the kinematic relationship: ε = 2u/L. This leads to: u = εL/2. Plugging u = εL/2 into Eq. 17 and replacing 2/[(1 + ν)(2 − ν)] with a fitting parameter c, we obtain:
| (18) |
Fitting parameter c enters the equation because focal adhesions at the end are not circular and the exact size and spatial distribution varies from cell to cell. For each gel modulus, we fit c using Eq. 18 and our experimental data for peak systolic longitudinal force (Fx,p) and peak systolic percent cell shortening (εp) (Table 1). By substituting Eqs. 15, 16, and 18 into Eq. 14 and solving for stress (σ), we obtained a linear relationship between stress (σ) and percent cell shortening (ε):
| (19) |
Table 1.
Model parameters for single cells with indicated length-to-width aspect ratios (s) on gels with 13-kPa and 90-kPa elastic modulus
| Parameter | 13-kPa Matrix |
90-kPa Matrix |
||||||
|---|---|---|---|---|---|---|---|---|
| s = 2 | s = 4 | s = 7 | s = 10 | s = 2 | s = 4 | s = 7 | s = 11 | |
| L, μm | 51.1 | 68.0 | 93.7 | 115.0 | 55.0 | 67.9 | 92.7 | 116.0 |
| b, μm | 25.7 | 18.5 | 13.1 | 11.1 | 26.2 | 18.2 | 12.6 | 10.5 |
| H, μm | 3 | 3 | 3 | 3 | 3 | 3 | 3 | 3 |
| a, μm2 | 1,200 | 1,200 | 1,200 | 1,200 | 1,200 | 1,200 | 1,200 | 1,200 |
| εp, % | 5.2 | 4.5 | 5.0 | 3.7 | 3.0 | 2.0 | 1.4 | 1.2 |
| Fx,p, μN | 0.32 | 0.35 | 0.51 | 0.42 | 1.18 | 0.83 | 0.77 | 0.76 |
| tp, ms | 68 | 89 | 114.3 | 103 | 109 | 86 | 96 | 96 |
| σp, kPa | 4.1 | 6.3 | 13.0 | 12.6 | 15 | 14.8 | 18.1 | 23.5 |
| wp, pJ | 0.45 | 0.62 | 0.94 | 0.70 | 1.05 | 0.62 | 0.55 | 0.52 |
| Ec, kPa | 10 | 10 | 10 | 10 | 10 | 10 | 10 | 10 |
| c | 1.1 | 1.1 | 1.1 | 1.1 | 0.78 | 0.78 | 0.78 | 0.78 |
| σ0, kPa | 14.3 | 14.3 | 14.3 | 14.3 | 19.8 | 19.8 | 19.8 | 19.8 |
| γ, s−1 | 0.74 | 0.74 | 0.74 | 0.74 | 0.56 | 0.56 | 0.56 | 0.56 |
L, b, H, a, εp, Fx,p, tp, σp, and wp were measured experimentally. Ec was chosen from the literature. c, σ0, and γ were fit parameters. See Glossary for definition of parameters.
This equation illustrates how the elasticity of both the cell and the matrix contribute to stress generation.
To solve for stress (σ) without knowledge of percent cell shortening (ε), we combined Eqs. 13 and 19, which led to an ordinary differential equation for stress (σ):
| (20) |
By applying the initial condition σ(t = 0) = 0 and integrating this differential equation from diastole (t = 0) to peak systole (t = tp), we obtained peak systolic stress (σp) as
| (21) |
In Eq. 21 and the following Eqs. 22–24, we use the aspect ratio (s) and the surface area (a) of the cell to represent the length () and width () of the cell. We then calculated peak systolic percent shortening (εp) using Eqs. 19 and 21 as
| (22) |
Peak systolic longitudinal force Fx,p was derived from Eqs. 18 and 22 as
| (23) |
Note that peak systolic force Fx,p reaches a saturation value as matrix elasticity Em increases, similar to previous models (63). Likewise, peak systolic longitudinal work (wx,p) was calculated from Eqs. 22 and 23 as
| (24) |
For the above equations, time to peak (tp) was extracted from our experimental data for each myocyte aspect ratio on 13-kPa and 90-kPa gels (Table 1). The surface area (a) and height of the cells (H) were extracted from our immunostaining data and were relatively constant at 1,200 μm2 and 3 μm, respectively (Fig. 1, C and D). Parameters σ0 and γ were fit using our experimental data and Eq. 24 (Table 1). Thus, given values for cell geometry, matrix elasticity, cell elasticity, and time to peak, our model predicts values for peak systolic stress, percent cell shortening, force, and work. These equations can also be used to independently modulate cell elasticity and matrix elasticity and predict the effects on contractile function.
RESULTS
Actin architecture is dependent on cell shape but not matrix elasticity.
Concentric hypertrophy is associated with increases in myocardial stiffness (11, 37) and decreases in myocyte length-to-width aspect ratio (23, 27). We first asked if changes in microenvironmental elasticity altered the architecture of the contractile apparatus, which is essential for myocyte force generation (6, 18, 36). We took an in vitro approach by culturing neonatal rat ventricular myocytes on polyacrylamide gels with moderate (13 kPa) and high (90 kPa) elastic moduli, mimicking healthy and stiff myocardium (4), respectively. Gels were micropatterned with ∼1,200 μm2 fibronectin rectangles with aspect ratios ranging from 2:1 to 12:1 to mimic myocytes isolated from healthy and hypertrophied hearts (23). On both moderate and stiff gels, actin alignment increased with myocyte length until reaching aspect ratio ∼7:1, at which point it plateaued (Fig. 2, A–E), suggesting that myocyte shape is a more dominant cue for cytoskeletal alignment compared to matrix elasticity. Thus actin alignment is regulated primarily by myocyte shape, not elasticity of the microenvironment.
Fig. 2.

Actin alignment is regulated by myocyte shape but not matrix elasticity. Actin (white) and nuclei (blue) in myocytes with average cell aspect ratios ∼2:1 (A), ∼4:1 (B), ∼7:1 (C), and ∼10:1 (D) on 13-kPa (i) and 90 kPa (ii) gels. Scale bar: 10 μm. E: actin orientational order parameter (OOP) as a function of cell aspect ratio and substrate elastic modulus. For 13-kPa gels, n = 5 for AR ∼2:1, n = 5 for AR ∼4:1, n = 6 for AR ∼7:1, and n = 5 for AR ∼10:1. For 90-kPa gels, n = 5 for AR ∼2:1, n = 5 for AR ∼4:1, n = 6 for AR ∼7:1, and n = 5 for AR ∼11:1. Bars represent SE. *P < 0.05 relative to aspect ratio ∼7:1 on gels with the same elastic modulus.
Sarcomere content is shape and stiffness dependent.
Because sarcomeres are the force-generating elements in cardiac myocytes, we next quantified parameters related to sarcomere structure by immunostaining myocytes for sarcomeric α-actinin (Fig. 3, A–D) and analyzing the 2-D Fourier spectra of the images (Fig. 3E). Sarcomere length was approximately ∼1.8 μm in all cells (Fig. 3F), suggesting that sarcomere length is not dependent on cell shape or matrix elasticity, consistent with other reports (39). We also quantified sarcomere content, which is a metric of how many pixels of the α-actinin immunosignal appear in organized sarcomeres, defined as periodic elements with ∼2 μm spacing. On moderate gels, sarcomere content was not dependent on myocyte shape (Fig. 3G), likely because myocytes have similar surface areas and thus the amount of sarcomeres in each image was relatively constant. On stiff gels, sarcomere content was higher at aspect ratio ∼2:1 compared with ∼4:1 and ∼7:1, suggesting that ∼2:1 myocytes contain more sarcomeres despite having conserved surface area (Fig. 3G). At aspect ratios ∼2:1 and ∼7:1, sarcomere content was higher on stiff gels compared with moderate gels (Fig. 3G), suggesting that the amount of sarcomeres in a shape-controlled myocyte increases with the elastic modulus of the matrix. Thus sarcomere length is unaffected by myocyte shape or matrix elasticity, but at certain aspect ratios, sarcomere content is higher on stiffer matrices.
Fig. 3.

Sarcomere content is dependent on myocyte shape and matrix elasticity. α-Actinin (white) in myocytes with average cell aspect ratios ∼2:1 (A), ∼4:1 (B), ∼7:1 (C), and ∼10–11:1 (D) on 13-kPa (i) and 90-kPa (ii) gels. Scale bar: 10 μm. E: 1-D representations of the 2-D Fourier spectra for representative ∼2:1 myocytes on 13-kPa and 90-kPa gels. Points indicate data, solid lines indicate fit Gaussian peaks, and dotted lines represent the dominant spatial frequency, corresponding to sarcomere length. Sarcomere length (F) and sarcomere content (G) as a function of cell aspect ratio and substrate elastic modulus. For 13-kPa gels, n = 8 for AR ∼2:1, n = 9 for AR ∼4:1, n = 8 for AR ∼7:1, and n = 4 for AR ∼10:1. For 90-kPa gels, n = 6 for AR ∼2:1, n = 7 for AR ∼4:1, n = 6 for AR ∼7:1, and n = 6 for AR ∼11:1. Bars represent SE. *P < 0.05 relative to aspect ratio ∼2:1 on 90-kPa gel. †P < 0.05 relative to aspect ratio ∼7:1 on 90-kPa gel.
Microtubule polymerization is dependent on matrix elasticity.
Microtubules are hyperpolymerized in concentric hypertrophy (53–55), which may impede myocyte shortening by increasing cell stiffness and resisting compression (58, 59). Because myocytes are mechanosensitive and remodel their cytoskeleton to adapt to their microenvironment (42), we asked if elasticity of the microenvironment directly induces microtubule remodeling. Qualitatively, single myocytes on stiff substrates had denser microtubule networks compared with those on moderate substrates, as revealed by α-tubulin immunostains (Fig. 4A). To quantify microtubule polymerization, we used Western blotting to quantify the total α-tubulin and the ratio of polymerized to total α-tubulin in 15-μm-wide strands of myocytes cultured on moderate and stiff gels (Fig. 4B). Although the total tubulin content was not statistically different, the ratio of polymerized to total tubulin was approximately 27% higher on stiff gels relative to moderate gels. Thus microtubule polymerization increases with the elastic modulus of the extracellular matrix, which potentially increases the elastic modulus of the cell.
Fig. 4.

Microtubule polymerization is regulated by matrix elasticity. A: α-Tublin (black) in myocytes with aspect ratio ∼4:1 (i and ii) and ∼7:1 (iii and iv) on 13-kPa (i and iii) and 90-kPa (ii and iv) gels. Scale bar: 10 μm. B: Western blot of soluble (sol) and polymerized (poly) α-tubulin in 15-μm-wide lines on 13-kPa and 90-kPa gels. Normalized total α-tubulin and normalized polymerized α-tubulin fraction as a function of gel modulus. n = 3 gels; bars represent SE. *P < 0.05 relative to 13-kPa gels.
The optimal myocyte shape for contractility is regulated by the elasticity of the microenvironment.
Myocyte aspect ratio decreases during the compensatory stages of concentric hypertrophy (23, 24), suggesting that cell shape remodeling might be an adaptive response to the microenvironment becoming stiffer. To test how myocyte shape and matrix elasticity coregulate contractile function, we used traction force microscopy (TFM) to quantify the contractility of spontaneously contracting, shape-controlled myocytes on gels with moderate (13 kPa) and high (90 kPa) elastic moduli doped with fluorescent beads. Single myocytes attached to gels primarily at their longitudinal ends, where integrins couple myofibrils to the extracellular matrix via focal adhesion complexes (26, 36). Gel and bead displacement was concentrated at the longitudinal ends of the cell when myocytes contracted spontaneously (Fig. 5A). We tracked bead displacement over the course of several contractile cycles for myocytes of different shapes on moderate and stiff gels and used bead displacement movies to calculate displacement and traction stress vectors (8, 41). As shown by representative peak systolic displacement vector (u⃗i) and traction stress vector (σ⃗i) maps, peak systolic displacement was highest on moderate gels (Fig. 5, B and C), but peak systolic stress was highest on stiff gels (Fig. 5, D and E) due to differences in the elastic modulus of the substrate. Thus cell shortening decreases and force generation increases when the elastic modulus of the microenvironment increases.
Fig. 5.

Measuring displacement and stress in moderate and stiff microenvironments. A: schematic illustrating the movement of fluorescent beads embedded in the substrate at diastole and peak systole during traction force microscopy experiments. Peak systolic displacement maps (i) and peak systolic traction stress maps (ii) for myocytes on 13-kPa gels (B and C) and 90-kPa gels (D and E) with aspect ratio ∼2:1 (B and D) and ∼7:1 (C and E). Scale bar: 10 μm.
For the heart to function, myocytes must both shorten to reduce chamber volume and generate enough contractile force to pump blood into the vasculature. Thus percent cell shortening, longitudinal force, stress, and work are all important parameters for evaluating cardiac function (Fig. 6A). Average percent cell shortening (εp) from diastole to peak systole was relatively constant on moderate gels, but decreased with increasing aspect ratio on stiff gels (Fig. 6B). Thus, on gels with physiological elasticity, absolute shortening was higher in longer myocytes as more sarcomeres were added in series, such that the proportion of cell shortening to diastolic cell length was relatively constant. This proportionality between myocyte length and cell shortening has also been observed in isolated rat myocytes (19), indicating that it is normal physiological behavior. However, on stiffer gels, myocyte percent cell shortening instead decreased with myocyte length (Fig. 6B). This suggests that the high elastic modulus of the matrix prevented longer myocytes from shortening to their full potential. Thus the gains in cell shortening that typically accompany increases in myocyte length are lost when the elastic modulus of the microenvironment is high.
Fig. 6.

Contractile function in moderate and stiff microenvironments. A: schematics for calculating (i) percent cell shortening (ε) and (ii) longitudinal force (Fx). B: peak systolic percent cell shortening (εp) as a function of matrix elastic modulus and aspect ratio. Representative longitudinal force traces for spontaneously contracting myocytes with the indicated aspect ratios (AR) on 13-kPa (C) and 90-kPa (D) gels. Peak systolic longitudinal force (Fx,p) (E), time to peak (tp) (F), peak systolic stress (σp) (G), and peak systolic work (wp) (H) as a function of substrate elastic modulus and aspect ratio. For B and E–H, points and dotted lines represent experimental data; solid lines represent mathematical model. For 13-kPa gels, n = 7 for AR ∼2:1, n = 9 for AR ∼4:1, n = 7 for AR ∼7:1, and n = 6 for AR ∼10:1. For 90-kPa gels, n = 8 for AR ∼2:1, n = 11 for AR ∼4:1, n = 12 for AR ∼7:1, and n = 7 for AR ∼11:1. Bars represent SE. *P < 0.05 relative to AR ∼2:1 on gels with the same elastic modulus.
To determine how cell shape and matrix elasticity coregulate force generation, we plotted representative longitudinal force (Fx) traces (Fig. 6, C and D) and average peak systolic longitudinal force (Fx,p) (Fig. 6E) for myocytes on moderate and stiff gels. On gels with physiological elasticity, myocytes with ∼7:1 aspect ratios generated the most longitudinal force at peak systole (Fig. 6, C and E). However, on stiff gels, myocytes with ∼2:1 aspect ratios generated the most peak systolic longitudinal force (Fig. 6, D and E). Interestingly, the time to peak systole (tp) followed the same trends as peak systolic longitudinal force, where ∼7:1 myocytes had the longest time to peak on moderate gels, consistent with previous studies (36), but ∼2:1 myocytes had the longest time to peak on stiff gels (Fig. 6F). Thus peak systolic force and the time to peak contraction were highest at aspect ratio ∼7:1 on gels mimicking healthy myocardium and ∼2:1 on gels mimicking stiff myocardium.
Cell shape remodeling during hypertrophic remodeling is also thought to be a mechanism to reduce wall stress (27, 47). To determine how peak systolic cell stress (σp) is regulated by myocyte shape and matrix elasticity, we divided peak systolic longitudinal force by the average cross-sectional cell area of each aspect ratio. We found that peak systolic longitudinal stress did decrease as myocyte aspect ratio decreased, such that smaller aspect ratios generated the lowest amount of stress, although this result was only statistically significant on 13-kPa gels (Fig. 6G). The decreased peak systolic stress at lower aspect ratios can be attributed to increased cell width, and thus increased cross-sectional area, of these cells. Thus myocytes with lower aspect ratios also have lower peak systolic stress, which could contribute to reductions in wall stress in concentric hypertrophy, where lower aspect ratios are typically observed.
Work (wp) is arguably the parameter most relevant to cardiac output because it is a function of both cell shortening and force generation. We found that peak systolic work (wp) was comparable in magnitude between moderate and stiff gels (Fig. 6H), indicating that, although myocytes on stiff gels generated more force, they did not generate more work. Similar to our results for peak systolic longitudinal force, peak systolic work was maximized for myocytes with aspect ratio ∼7:1 on moderate gels and aspect ratio ∼2:1 on stiff gels (Fig. 6H). Thus our experimental data suggest that aspect ratio ∼7:1 is functionally advantageous in normal microenvironments and aspect ratio ∼2:1 is functionally advantageous in stiff microenvironments.
Extracellular elasticity regulates contractility more than intracellular elasticity.
Clinical and in vivo data have shown that concentric hypertrophy is associated with both fibrosis (21, 61) and microtubule hyperpolymerization (53–55), which could each impede myocyte shortening by increasing the modulus of the extracellular or intracellular environment, respectively. Thus the extracellular matrix or cytoskeletal elements, such as microtubules, could serve as potential therapeutic targets by reducing the load on myocytes. We asked if extracellular or intracellular elasticity has the greatest effect on contractile function. Because it is challenging to decouple intracellular and extracellular elasticity experimentally, we instead developed an analytical model to test the effects of elasticity and used our experimental results to fit unknown parameters. As described in methods, we formulated equations for peak systolic stress (σp), percent cell shortening (εp), longitudinal force (Fx,p), and longitudinal work (wx,p) as functions of cell elastic modulus (Ec), matrix elastic modulus (Em), cell aspect ratio (s), and time to peak (tp):
| (21) |
| (22) |
| (23) |
| (24) |
The results of the model overlaid on experimental data are shown in Fig. 6, B, E, G, and H. Similar to our experimental results, our model showed that peak systolic percent cell shortening (εp) decreased with increasing aspect ratio on stiff gels (Fig. 6B). Our model also showed that aspect ratio ∼7:1 is advantageous for force and work generation on moderate gels and aspect ratio ∼2:1 is advantageous on stiff gels (Fig. 6, E and H) and that peak systolic stress decreases with decreasing aspect ratio (Fig. 6G). Thus, consistent with our experimental results, our model indicates that matrix elasticity regulates the optimal shape for work generation, with lower aspect ratios maximizing work output in stiff microenvironments.
To determine if intracellular or extracellular elasticity dominates the magnitude of contractile work, we used our model to independently modulate cell elastic modulus (Ec) and matrix elastic modulus (Em). We first held matrix elastic modulus constant at ∼50 kPa and modulated cell elastic modulus, which has been reported to range between 10 and 200 kPa in isolated myocytes (30, 40). We chose a cell elastic modulus range of 1–100 kPa and plotted peak systolic work for aspect ratios 2:1 and 7:1. Peak systolic work was relatively constant across the range of cell elastic moduli, with only a ∼20–25% decrease in peak systolic work as cell elastic modulus increased from 1 kPa to 100 kPa for both aspect ratios (Fig. 7A). We next held cell elastic modulus constant at 10 kPa and plotted peak systolic work while modulating matrix elastic modulus from 1 to 100 kPa. For 7:1 myocytes, peak systolic work was maximized at a matrix elastic modulus of ∼20 kPa and dropped ∼60% when matrix elastic modulus increased to 100 kPa (Fig. 7B), which is a marked difference compared with modulating cell elastic modulus. Myocytes at 2:1 were less sensitive to increases in matrix elastic modulus, as peak systolic work was maximized when matrix elastic modulus was ∼50 kPa and only dropped ∼25% when matrix elastic modulus increased to 100 kPa (Fig. 7B). This suggests that lower aspect ratios can better adapt to increases in matrix elastic modulus because peak systolic work was mostly constant when matrix elastic modulus was high. The comparison of the two aspect ratios also illustrates that 7:1 generates more work when the elastic modulus of the matrix is below ∼40 kPa and 2:1 generates more work when the elastic modulus of the matrix is above ∼40 kPa, indicating that lower aspect ratios are more favorable when the microenvironment becomes stiffer due to conditions such as fibrosis. Thus our model predicts that matrix elasticity dominates over cell elasticity and that lower aspect ratios generate more work compared with moderate aspect ratios when the elastic modulus of the matrix increases due to conditions such as fibrosis.
Fig. 7.
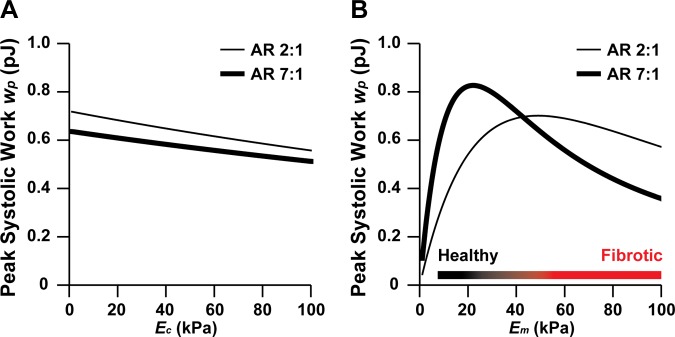
Predicted relative contributions of cell elastic modulus and matrix elastic modulus to work generation. Peak systolic work (wp) as a function of aspect ratio and cell elastic modulus (Ec) (A) or matrix elastic modulus (Em) (B), as predicted by our mathematical model. For A, Em was held constant at ∼50 kPa. For B, Ec was held constant at ∼10 kPa.
DISCUSSION
Concentric hypertrophy is associated with diverse intracellular and extracellular remodeling, which are coupled and thus difficult to understand as independent mechanisms of pathogenesis. With this study, we asked if lower myocyte aspect ratios, such as those observed in concentric hypertrophy, maximize contractility when the extracellular matrix becomes stiffer due to factors such as fibrosis. We used an in vitro system to replicate the shapes of myocytes from healthy and hypertrophied hearts and quantified their contractile function on gels with normal and high elastic moduli. Peak systolic work was maximized at ∼7:1 aspect ratios on gels mimicking healthy myocardium (13 kPa) and ∼2:1 aspect ratios on gels with elastic moduli in the range of fibrosis (90 kPa). Microtubule polymerization was higher on stiff gels, suggestive of a decrease in intracellular elasticity. To delineate the contributions of intracellular versus extracellular elasticity to contractile dysfunction, we developed a mathematical model, which revealed that matrix elasticity has a stronger influence on contractility compared with cell elasticity. Together, our results suggest that myocyte shape is potentially tuned to maximize contractility based on the mechanical properties of the extracellular matrix, which has implications for understanding why cardiac myocyte shape remodels in diseases such as hypertrophy.
Our analysis of actin and sarcomere structure revealed that several structural parameters are regulated by myocyte shape and matrix elasticity. Sarcomere length was constant across all myocyte aspect ratios and matrix elasticities, consistent with previous in vivo and in vitro reports (39). Previous studies have shown that actin alignment in mesenchymal stem cells is regulated by both cell shape and matrix elasticity (63). We similarly observed increases in actin alignment with cell shape, but found no dependency of actin alignment on matrix elasticity. We also found that sarcomere content (a measure of the amount of periodic α-actinin structures) was highest in myocytes with aspect ratio ∼2:1 on stiff gels compared with other aspect ratios on stiff gels and the same aspect ratio on moderate gels. This suggests that sarcomerogenesis tends to be more pronounced on stiff gels, which conflicts slightly with previous reports suggesting that sarcomere structures are optimized on gels with physiological elasticity (15, 34, 39). However, these discrepancies could exist because we strictly defined myocyte shape by using micropatterned substrates. On unpatterned substrates, the cells can assume a broader range of cytoskeletal architectures and thus might have increased sensitivity to matrix elasticity. Previous studies have also reported highly aligned sarcomere structures in cardiac myocytes cultured on micropatterned fibronectin islands on polydimethylsiloxane (6, 22), which has an elastic modulus in the range of 1 MPa, indicating that well-developed sarcomeres form on substrates even stiffer than those evaluated in this study. The increased sarcomere content we observed in ∼2:1 myocytes on stiff gels could potentially contribute to the increased contractile work produced by these cells, in addition to the effects of cell geometry as described in our model and discussed in detail below.
Concentric hypertrophy can be induced by a variety of pathologies that induce pressure overload, such as aortic valve stenosis or hypertension. In response, the ventricular wall becomes fibrotic and thickens to offset the increased load (27, 37). Myocytes also become wider (23, 24), but the functional consequences of myocyte shape changes have not been clearly identified. By taking an in vitro approach, we independently modulated matrix elasticity and myocyte shape to determine how these two parameters coregulate myocyte contractile function. Percent cell shortening at peak systole was relatively constant on moderate gels, which is expected because absolute cell shortening typically increases as myocytes grow longer and more sarcomeres are added in series (19). However, this same trend was not observed on stiff gels, where percent cell shortening instead decreased with aspect ratio, likely because the matrix offered excessive resistance against cell shortening. Thus myocytes in stiff microenvironments do not benefit functionally from increases in myocyte length. As a consequence, ∼7:1 myocytes generated the most work on moderate gels and ∼2:1 myocytes generated the most work on stiff gels, which were the shortest of all tested shapes. Thus, in stiff microenvironments, cell width appears to be more beneficial than cell length, which is consistent with how myocyte shape changes in concentric hypertrophy (23, 24). Our data also showed that lower aspect ratios generate less peak systolic stress, suggesting that lower aspect ratios could also reduce wall stress, a widely proposed explanation for cell shape remodeling in concentric hypertrophy (27, 47). Our data are suggestive of a model describing myocyte shape remodeling in concentric hypertrophy as a compensatory response to increased matrix elastic modulus, where myocyte shape adapts to maximize contractility in response to extracellular matrix remodeling (Fig. 8).
Fig. 8.

Matrix elasticity determines the optimal myocyte shape for contractile function. Our proposed model for myocyte shape remodeling in concentric hypertrophy. In a healthy heart, myocytes have an aspect ratio of ∼7:1. In pressure overload, matrix elastic modulus increases, microtubules hyperpolymerize, and cell shortening decreases. To compensate, myocyte aspect ratio decreases to maximize cell shortening and force generation in response to increased matrix elastic modulus. On the scale of the ventricle, this cellular remodeling could contribute to the development of ventricular wall thickening concentric hypertrophy. RV, right ventricle; LV, left ventricle.
To understand why an optimal cell aspect ratio exists and depends on matrix elasticity, we can rewrite Eq. 24 from our model in the following form:
| (24) |
Mathematically, it can be seen from the above equation that peak systolic work wx,p decreases with aspect ratio s if we keep the multiplying factor in the second bracket constant, while it increases with aspect ratio s if the multiplying factor in the first bracket is kept constant. Thus the product of these two brackets yields a nonmonotonical relationship between peak systolic work wx,p and cell aspect ratio s, with an optimal aspect ratio at which peak systolic work wx,p is maximized. Other parameters also dictate the optimal aspect ratio, such that it is a function of matrix elastic modulus (Em), cell elastic modulus (Ec), time to peak contraction (tp), and fit parameters for isometric stress (σ0) and maximum percent cell shortening rate (γ). Using parameter values either measured experimentally, fit with our experimental data, or taken from the literature, we found the optimal aspect ratio to be ∼7:1 on 13-kPa matrix and ∼2:1 on 90-kPa matrix, similar to our experimental data. The nonmonotonical relationship between peak systolic work wx,p and cell aspect ratio s can also be understood as a balance between cell length and cell width. When a rectangular cell gets longer (and aspect ratio s gets larger), the magnitude of absolute shortening by each individual myofibril increases. However, the cell also gets thinner when aspect ratio s increases, which decreases the total number of myofibrils in the cell. Thus the cell as a whole pulls on a smaller area of matrix, which decreases the total amount of work done on the matrix. The competition of these two factors leads to the existence of an optimal aspect ratio.
Besides the mechanical mechanisms described above, we also found that time to peak systole contributes to an optimal aspect ratio. As indicated by Eq. 24, peak systolic work wx,p monotonically increases with time to peak contraction tp. Thus larger tp leads to larger peak systolic work wx,p. Interestingly, time to peak contraction followed the same trends we observed for peak systolic force, where aspect ratio ∼7:1 had the longest time to peak on moderate gels and ∼2:1 had the longest time to peak on stiff gels. Correlations between time to peak and twitch amplitude have been observed previously in isolated rat myocytes (19), providing ex vivo evidence that contraction dynamics regulate the magnitude of contractile stress. Time to peak contraction is primarily regulated by calcium, suggesting that remodeling of calcium handling proteins, which is observed in both pressure-overload hypertrophy and heart failure (60), could have a significant impact on contraction strength by altering contraction dynamics. Previous in vitro studies have shown that myocyte shape (36) and substrate stiffness (34, 44) can each independently regulate calcium handling, but further studies are needed to understand how shape- and elasticity-dependent differences in contractility are governed by calcium.
Microtubules in hypertrophied myocytes are hyperpolymerized compared with healthy myocytes (53–55), which is thought to impede cell shortening (5, 31) because microtubules resist compression (50). Our results showed that increased matrix elastic modulus induces microtubule hyperpolymerization, which could contribute to the reduced percent cell shortening we observed on stiff gels. Thus one potential mechanism that could be drawn from our data is that stiff matrix induces microtubule hyperpolymerization, which increases cell elastic modulus, resists cell shortening, and underlies contractile dysfunction. Because it is experimentally difficult to uncouple matrix elasticity and cell elasticity, we used our analytical model to independently modulate these two parameters. Our model predicted that variations in matrix elasticity contribute more to peak systolic work compared with cell elasticity, suggesting that targeting microtubules is less likely to be an effective treatment in concentric hypertrophy. Interestingly, studies in pressure overloaded rats (51) and felines (3) have shown that microtubules are hyperpolymerized in hypertrophied hearts, but treatment with the depolymerizing agent colchicine did not restore contractile function. These studies are consistent with the conclusion from our analytical model that microtubules and associated increases in intracellular elastic modulus are not the primary regulator of contractile dysfunction in concentric hypertrophy.
As with many in vitro studies, the implications of our work are limited by differences between in vivo and in vitro environments and therefore must be interpreted with caution. Observations made in individual cardiac myocytes cultured on elastic hydrogels might not translate to cardiac myocytes in the heart, which are coupled to other myocytes and are surrounded by an extracellular matrix consisting of collagen fibers. Another limitation of our work is that we did not make experimental measurements of cell elastic modulus for our model. Instead, we used a single value from the literature. We also used the same value of cell elastic modulus for both moderate and stiff gels, which may or may not be accurate, as suggested by our microtubule data. Another limitation of our model is that it is only applicable to 2-D rectangular muscle cells with all sarcomeres aligned along the same direction, which we assume could be extended to elongated, cylindrical 3-D cells. Our model is also based on the assumption that single myocytes are governed by the same stress-strain relationships as whole muscle (13). However, the match between our experimental and theoretical data suggests that the physiology of whole muscle, which is on the centimeter scale, is derived from the biophysical behavior of single myocytes, which are on the micrometer scale. Thus certain cellular behaviors scale to the organ level, illustrating how diseases such as concentric hypertrophy impact multiple spatial scales and thus require a systems-level approach to decipher disease mechanisms.
Current therapies for concentric hypertrophy are typically dependent on the underlying cause. For example, in the case of aortic valve stenosis, valve replacement surgery has been shown to alleviate the mechanical overload and reverse hypertrophic growth (37). Conversely, pharmacological treatments, including ACE inhibitors, beta-blockers, and calcium-channel blockers, have had limited success in reversing the phenotype (37). Our data suggest that the extracellular matrix could serve as a potential therapeutic target in concentric hypertrophy. Using pharmacological treatments to remodel the mechanical microenvironment of diseased hearts instead of modulating ion channels or chemical signaling could hold promise for reversing the contractile dysfunction typically associated with cardiac pathologies. Thus the extracellular matrix is not a passive support structure but instead is a powerful regulator of the structural and functional phenotype of cardiac myocytes in health and disease, suggesting that it also has potential as a therapeutic target.
GRANTS
This work was funded by the National Institutes of Health (Grants 1-R01-HL-079126, 1-UH2-TR-000522-01), Harvard Materials Research Science and Engineering Center supported by the National Science Foundation (DMR-0213805), and Harvard School of Engineering and Applied Sciences.
DISCLOSURES
No conflicts of interest, financial or otherwise, are declared by the author(s).
AUTHOR CONTRIBUTIONS
Author contributions: M.L.M., H.Y., and K.K.P. conception and design of research; M.L.M., H.Y., and P.H.C. performed experiments; M.L.M. and F.S.P. analyzed data; M.L.M., H.Y., F.S.P., P.H.C., and K.K.P. interpreted results of experiments; M.L.M., H.Y., and F.S.P. prepared figures; M.L.M. and H.Y. drafted manuscript; M.L.M., H.Y., F.S.P., P.H.C., and K.K.P. edited and revised manuscript; M.L.M., H.Y., F.S.P., P.H.C., and K.K.P. approved final version of manuscript.
ACKNOWLEDGMENTS
We thank the Harvard Center for Nanoscale Systems for use of cleanroom facilities.
Present address for M. L. McCain: Dept. of Biomedical Engineering, Viterbi School of Engineering, Univ. of Southern California, Los Angeles, CA 90089.
Present address for F. S. Pasqualini: Dept. of Anesthesia, Brigham and Women's Hospital, Boston, MA 02115.
Glossary
- a
Surface area of the cell
- s
Length-to-width cell aspect ratio
- b
Width of the cell
- c
A nondimensional parameter that accounts for unknown geometric factors between the cell and the 2-D gel
- γ
Maximum percent cell shortening rate
- Em
Young's modulus of the matrix
- Ec
Young's modulus of the cell
- ε
Percent cell shortening
- εp
Percent cell shortening at peak systole
- f⃗i
Force vector i
- fx,i
x-magnitude of force vector i
- fy,i
y-magnitude of force vector i
- Fx
Longitudinal contractile force
- Fx,p
Longitudinal contractile force at peak systole
- H
Height of the cell
- l
Left side of cell
- L
Diastolic length of the cell
- OOP
Orientational order parameter
- σ
Contractile stress
- σ⃗i
Traction stress vector i
- σ0
Contractile isometric stress
- σp
Contractile stress at peak systole
- r
Right side of cell
- t
Time
- tp
Time to peak systole
- TFM
Traction force microscopy
- u⃗i
Displacement vector i
- ux,i
x-magnitude of displacement vector i
- uy,i
y-magnitude of displacement vector i
- ν
Poisson ratio
- wp
Peak systolic work
- wx,p
Peak systolic longitudinal work
REFERENCES
- 1.Annoni G, Luvara G, Arosio B, Gagliano N, Fiordaliso F, Santambrogio D, Jeremic G, Mircoli L, Latini R, Vergani C, Masson S. Age-dependent expression of fibrosis-related genes and collagen deposition in the rat myocardium. Mech Ageing Dev 101: 57–72, 1998 [DOI] [PubMed] [Google Scholar]
- 2.Anversa P, Ricci R, Olivetti G. Quantitative structural analysis of the myocardium during physiologic growth and induced cardiac hypertrophy: a review. J Am Coll Cardiol 7: 1140–1149, 1986 [DOI] [PubMed] [Google Scholar]
- 3.Bailey BA, Dipla K, Li S, Houser SR. Cellular basis of contractile derangements of hypertrophied feline ventricular myocytes. J Mol Cell Cardiol 29: 1823–1835, 1997 [DOI] [PubMed] [Google Scholar]
- 4.Berry MF, Engler AJ, Woo YJ, Pirolli TJ, Bish LT, Jayasankar V, Morine KJ, Gardner TJ, Discher DE, Sweeney HL. Mesenchymal stem cell injection after myocardial infarction improves myocardial compliance. Am J Physiol Heart Circ Physiol 290: H2196–H2203, 2006 [DOI] [PubMed] [Google Scholar]
- 5.Brangwynne CP, MacKintosh FC, Kumar S, Geisse NA, Talbot J, Mahadevan L, Parker KK, Ingber DE, Weitz DA. Microtubules can bear enhanced compressive loads in living cells because of lateral reinforcement. J Cell Biol 173: 733–741, 2006 [DOI] [PMC free article] [PubMed] [Google Scholar]
- 6.Bray MA, Sheehy SP, Parker KK. Sarcomere alignment is regulated by myocyte shape. Cell Motil Cytoskeleton 65: 641–651, 2008 [DOI] [PMC free article] [PubMed] [Google Scholar]
- 7.Bugger H, Schwarzer M, Chen D, Schrepper A, Amorim PA, Schoepe M, Nguyen TD, Mohr FW, Khalimonchuk O, Weimer BC, Doenst T. Proteomic remodelling of mitochondrial oxidative pathways in pressure overload-induced heart failure. Cardiovasc Res 85: 376–384, 2010 [DOI] [PubMed] [Google Scholar]
- 8.Butler JP, Tolic-Norrelykke IM, Fabry B, Fredberg JJ. Traction fields, moments, and strain energy that cells exert on their surroundings. Am J Physiol Cell Physiol 282: C595–C605, 2002 [DOI] [PubMed] [Google Scholar]
- 9.Chen CS, Mrksich M, Huang S, Whitesides GM, Ingber DE. Geometric control of cell life and death. Science 276: 1425–1428, 1997 [DOI] [PubMed] [Google Scholar]
- 10.Chew C, Ziady GM, Raphael MJ, Oakley CM. The functional defect in amyloid heart disease. The “stiff heart” syndrome. Am J Cardiol 36: 438–444, 1975 [DOI] [PubMed] [Google Scholar]
- 11.Conrad CH, Brooks WW, Hayes JA, Sen S, Robinson KG, Bing OH. Myocardial fibrosis and stiffness with hypertrophy and heart failure in the spontaneously hypertensive rat. Circulation 91: 161–170, 1995 [DOI] [PubMed] [Google Scholar]
- 12.de la Bastie D, Levitsky D, Rappaport L, Mercadier JJ, Marotte F, Wisnewsky C, Brovkovich V, Schwartz K, Lompre AM. Function of the sarcoplasmic reticulum and expression of its Ca2+-ATPase gene in pressure overload-induced cardiac hypertrophy in the rat. Circ Res 66: 554–564, 1990 [DOI] [PubMed] [Google Scholar]
- 13.Deshpande VS, McMeeking RM, Evans AG. A bio-chemo-mechanical model for cell contractility. Proc Natl Acad Sci USA 103: 14015–14020, 2006 [DOI] [PMC free article] [PubMed] [Google Scholar]
- 14.Drazner MH. The progression of hypertensive heart disease. Circulation 123: 327–334, 2011 [DOI] [PubMed] [Google Scholar]
- 15.Engler AJ, Carag-Krieger C, Johnson CP, Raab M, Tang HY, Speicher DW, Sanger JW, Sanger JM, Discher DE. Embryonic cardiomyocytes beat best on a matrix with heart-like elasticity: scar-like rigidity inhibits beating. J Cell Sci 121: 3794–3802, 2008 [DOI] [PMC free article] [PubMed] [Google Scholar]
- 16.Engler AJ, Sen S, Sweeney HL, Discher DE. Matrix elasticity directs stem cell lineage specification. Cell 126: 677–689, 2006 [DOI] [PubMed] [Google Scholar]
- 17.Fassett JT, Xu X, Hu X, Zhu G, French J, Chen Y, Bache RJ. Adenosine regulation of microtubule dynamics in cardiac hypertrophy. Am J Physiol Heart Circ Physiol 297: H523–H532, 2009 [DOI] [PMC free article] [PubMed] [Google Scholar]
- 18.Feinberg AW, Alford PW, Jin H, Ripplinger CM, Werdich AA, Sheehy SP, Grosberg A, Parker KK. Controlling the contractile strength of engineered cardiac muscle by hierarchal tissue architecture. Biomaterials 33: 5732–5741, 2012 [DOI] [PMC free article] [PubMed] [Google Scholar]
- 19.Fraticelli A, Josephson R, Danziger R, Lakatta E, Spurgeon H. Morphological and contractile characteristics of rat cardiac myocytes from maturation to senescence. Am J Physiol Heart Circ Physiol 257: H259–H265, 1989 [DOI] [PubMed] [Google Scholar]
- 20.Fung YC. Biomechanics: Mechanical Properties of Living Tissues. New York: Springer-Verlag, 1993 [Google Scholar]
- 21.Gaasch WH, Levine HJ, Quinones MA, Alexander JK. Left ventricular compliance: mechanisms and clinical implications. Am J Cardiol 38: 645–653, 1976 [DOI] [PubMed] [Google Scholar]
- 22.Geisse NA, Sheehy SP, Parker KK. Control of myocyte remodeling in vitro with engineered substrates. In Vitro Cell Dev Biol Anim 45: 343–350, 2009 [DOI] [PubMed] [Google Scholar]
- 23.Gerdes AM. Cardiac myocyte remodeling in hypertrophy and progression to failure. J Card Fail 8: S264–S268, 2002 [DOI] [PubMed] [Google Scholar]
- 24.Gerdes AM. Remodeling of ventricular myocytes during cardiac hypertrophy and heart failure. J Fla Med Assoc 79: 253–255, 1992 [PubMed] [Google Scholar]
- 25.Grosberg A, Alford PW, McCain ML, Parker KK. Ensembles of engineered cardiac tissues for physiological and pharmacological study: heart on a chip. Lab Chip 11: 4165–4173, 2011 [DOI] [PMC free article] [PubMed] [Google Scholar]
- 26.Grosberg A, Kuo PL, Guo CL, Geisse NA, Bray MA, Adams WJ, Sheehy SP, Parker KK. Self-organization of muscle cell structure and function. PLoS Comput Biol 7: e1001088, 2011 [DOI] [PMC free article] [PubMed] [Google Scholar]
- 27.Grossman W, Jones D, McLaurin LP. Wall stress and patterns of hypertrophy in the human left ventricle. J Clin Invest 56: 56–64, 1975 [DOI] [PMC free article] [PubMed] [Google Scholar]
- 28.Herrmann KL, McCulloch AD, Omens JH. Glycated collagen cross-linking alters cardiac mechanics in volume-overload hypertrophy. Am J Physiol Heart Circ Physiol 284: H1277–H1284, 2003 [DOI] [PMC free article] [PubMed] [Google Scholar]
- 29.Ho CY, Lopez B, Coelho-Filho OR, Lakdawala NK, Cirino AL, Jarolim P, Kwong R, Gonzalez A, Colan SD, Seidman JG, Diez J, Seidman CE. Myocardial fibrosis as an early manifestation of hypertrophic cardiomyopathy. N Engl J Med 363: 552–563, 2010 [DOI] [PMC free article] [PubMed] [Google Scholar]
- 30.Hofmann UG, Rotsch C, Parak WJ, Radmacher M. Investigating the cytoskeleton of chicken cardiocytes with the atomic force microscope. J Struct Biol 119: 84–91, 1997 [DOI] [PubMed] [Google Scholar]
- 31.Ingber DE. Tensegrity. I. Cell structure and hierarchical systems biology. J Cell Sci 116: 1157–1173, 2003 [DOI] [PubMed] [Google Scholar]
- 32.Izumo S, Nadal-Ginard B, Mahdavi V. Protooncogene induction and reprogramming of cardiac gene expression produced by pressure overload. Proc Natl Acad Sci USA 85: 339–343, 1988 [DOI] [PMC free article] [PubMed] [Google Scholar]
- 33.Jacot JG, McCulloch AD, Omens JH. Substrate stiffness affects the functional maturation of neonatal rat ventricular myocytes. Biophys J 95: 3479–3487, 2008 [DOI] [PMC free article] [PubMed] [Google Scholar]
- 34.Johnson KL. Contact Mechanics. New York: Cambridge University Press, 1985 [Google Scholar]
- 35.Kagaya Y, Kanno Y, Takeyama D, Ishide N, Maruyama Y, Takahashi T, Ido T, Takishima T. Effects of long-term pressure overload on regional myocardial glucose and free fatty acid uptake in rats. A quantitative autoradiographic study. Circulation 81: 1353–1361, 1990 [DOI] [PubMed] [Google Scholar]
- 36.Kuo PL, Lee H, Bray MA, Geisse NA, Huang YT, Adams WJ, Sheehy SP, Parker KK. Myocyte shape regulates lateral registry of sarcomeres and contractility. Am J Pathol 181: 2030–2037, 2012 [DOI] [PMC free article] [PubMed] [Google Scholar]
- 37.Lorell BH, Carabello BA. Left ventricular hypertrophy: pathogenesis, detection, and prognosis. Circulation 102: 470–479, 2000 [DOI] [PubMed] [Google Scholar]
- 38.Machackova J, Barta J, Dhalla NS. Myofibrillar remodeling in cardiac hypertrophy, heart failure and cardiomyopathies. Can J Cardiol 22: 953–968, 2006 [DOI] [PMC free article] [PubMed] [Google Scholar]
- 39.Majkut S, Idema T, Swift J, Krieger C, Liu A, Discher DE. Heart-specific stiffening in early embryos parallels matrix and Myosin expression to optimize beating. Curr Biol 23: 2434–2439, 2013 [DOI] [PMC free article] [PubMed] [Google Scholar]
- 40.Mathur AB, Collinsworth AM, Reichert WM, Kraus WE, Truskey GA. Endothelial, cardiac muscle and skeletal muscle exhibit different viscous and elastic properties as determined by atomic force microscopy. J Biomech 34: 1545–1553, 2001 [DOI] [PubMed] [Google Scholar]
- 41.McCain ML, Lee H, Aratyn-Schaus Y, Kleber AG, Parker KK. Cooperative coupling of cell-matrix and cell-cell adhesions in cardiac muscle. Proc Natl Acad Sci USA 109: 9881–9886, 2012 [DOI] [PMC free article] [PubMed] [Google Scholar]
- 42.McCain ML, Parker KK. Mechanotransduction: the role of mechanical stress, myocyte shape, and cytoskeletal architecture on cardiac function. Pflügers Arch 462: 89–104, 2011 [DOI] [PubMed] [Google Scholar]
- 43.Minino AM, Murphy SL, Xu J, Kochanek KD. Deaths: final data for 2008. Natl Vital Stat Rep 59: 1–126, 2011 [PubMed] [Google Scholar]
- 44.Rodriguez AG, Han SJ, Regnier M, Sniadecki NJ. Substrate stiffness increases twitch power of neonatal cardiomyocytes in correlation with changes in myofibril structure and intracellular calcium. Biophys J 101: 2455–2464, 2011 [DOI] [PMC free article] [PubMed] [Google Scholar]
- 45.Rothen-Rutishauser BM, Ehler E, Perriard E, Messerli JM, Perriard JC. Different behaviour of the non-sarcomeric cytoskeleton in neonatal and adult rat cardiomyocytes. J Mol Cell Cardiol 30: 19–31, 1998 [DOI] [PubMed] [Google Scholar]
- 46.Sato Y, Nakajima S, Shiraga N, Atsumi H, Yoshida S, Koller T, Gerig G, Kikinis R. Three-dimensional multi-scale line filter for segmentation and visualization of curvilinear structures in medical images. Med Image Anal 2: 143–168, 1998 [DOI] [PubMed] [Google Scholar]
- 47.Savinova OV, Gerdes AM. Myocyte changes in heart failure. Heart Fail Clin 8: 1–6, 2012 [DOI] [PubMed] [Google Scholar]
- 48.Sheehy SP, Grosberg A, Parker KK. The contribution of cellular mechanotransduction to cardiomyocyte form and function. Biomech Model Mechanobiol 11: 1227–1239, 2012 [DOI] [PMC free article] [PubMed] [Google Scholar]
- 49.Sheehy SP, Huang S, Parker KK. Time-warped comparison of gene expression in adaptive and maladaptive cardiac hypertrophy. Circ Cardiovasc Genet 2: 116–124, 2009 [DOI] [PMC free article] [PubMed] [Google Scholar]
- 50.Stamenovic D, Mijailovich SM, Tolic-Norrelykke IM, Chen J, Wang N. Cell prestress. II. Contribution of microtubules. Am J Physiol Cell Physiol 282: C617–C624, 2002 [DOI] [PubMed] [Google Scholar]
- 51.Stones R, Benoist D, Peckham M, White E. Microtubule proliferation in right ventricular myocytes of rats with monocrotaline-induced pulmonary hypertension. J Mol Cell Cardiol 56: 91–96, 2013 [DOI] [PMC free article] [PubMed] [Google Scholar]
- 52.Sugden PH. Signalling pathways in cardiac myocyte hypertrophy. Ann Med 33: 611–622, 2001 [PubMed] [Google Scholar]
- 53.Tagawa H, Wang N, Narishige T, Ingber DE, Zile MR, Cooper GT. Cytoskeletal mechanics in pressure-overload cardiac hypertrophy. Circ Res 80: 281–289, 1997 [DOI] [PubMed] [Google Scholar]
- 54.Tsutsui H, Ishihara K, Cooper GT. Cytoskeletal role in the contractile dysfunction of hypertrophied myocardium. Science 260: 682–687, 1993 [DOI] [PubMed] [Google Scholar]
- 55.Tsutsui H, Tagawa H, Kent RL, McCollam PL, Ishihara K, Nagatsu M, Cooper GT. Role of microtubules in contractile dysfunction of hypertrophied cardiocytes. Circulation 90: 533–55, 1994 [DOI] [PubMed] [Google Scholar]
- 56.van Heerebeek L, Hamdani N, Handoko ML, Falcao-Pires I, Musters RJ, Kupreishvili K, Ijsselmuiden AJ, Schalkwijk CG, Bronzwaer JG, Diamant M, Borbely A, van der Velden J, Stienen GJ, Laarman GJ, Niessen HW, Paulus WJ. Diastolic stiffness of the failing diabetic heart: importance of fibrosis, advanced glycation end products, and myocyte resting tension. Circulation 117: 43–51, 2008 [DOI] [PubMed] [Google Scholar]
- 57.Villari B, Campbell SE, Hess OM, Mall G, Vassalli G, Weber KT, Krayenbuehl HP. Influence of collagen network on left ventricular systolic and diastolic function in aortic valve disease. J Am Coll Cardiol 22: 1477–1484, 1993 [DOI] [PubMed] [Google Scholar]
- 58.Wang N. Mechanical interactions among cytoskeletal filaments. Hypertension 32: 162–165, 1998 [DOI] [PubMed] [Google Scholar]
- 59.Wang N, Naruse K, Stamenovic D, Fredberg JJ, Mijailovich SM, Tolic-Norrelykke IM, Polte T, Mannix R, Ingber DE. Mechanical behavior in living cells consistent with the tensegrity model. Proc Natl Acad Sci USA 98: 7765–7770, 2001 [DOI] [PMC free article] [PubMed] [Google Scholar]
- 60.Wankerl M, Schwartz K. Calcium transport proteins in the nonfailing and failing heart: gene expression and function. J Mol Med 73: 487–496, 1995 [DOI] [PubMed] [Google Scholar]
- 61.Weber KT, Janicki JS, Shroff SG, Pick R, Chen RM, Bashey RI. Collagen remodeling of the pressure-overloaded, hypertrophied nonhuman primate myocardium. Circ Res 62: 757–765, 1988 [DOI] [PubMed] [Google Scholar]
- 62.Widmaier EP, Raff H, Strang KT, Vander AJ. Vander, Sherman, & Luciano's Human Physiology: The Mechanisms of Body Function. Boston, MA: McGraw-Hill Higher Education, 2004 [Google Scholar]
- 63.Zemel A, Rehfeldt F, Brown AE, Discher DE, Safran SA. Optimal matrix rigidity for stress fiber polarization in stem cells. Nat Phys 6: 468–473, 2010 [DOI] [PMC free article] [PubMed] [Google Scholar]
- 64.Zile MR, Baicu CF, Gaasch WH. Diastolic heart failure—abnormalities in active relaxation and passive stiffness of the left ventricle. N Engl J Med 350: 1953–1959, 2004 [DOI] [PubMed] [Google Scholar]