

Abstract
Background
Over the last decade, genome-wide association studies (GWAS) have discovered many risk associated single nucleotide polymorphisms (SNPs) of prostate cancer (PCa). However, the majority of the associated PCa SNPs, including those in linkage disequilibrium (LD) blocks, are generally not located in protein coding regions. The systematical investigation of the functional roles of these SNPs, especially the non-coding SNPs, becomes very necessary and helpful to the understanding of the molecular mechanism of PCa.
Results
In this work, we proposed a comprehensive framework at network level to integrate the SNP annotation, target gene assignment, gene ontology (GO) classification, pathway enrichment analysis and regulatory network reconstruction to illustrate the molecular functions of PCa associated SNPs. By LD expansion, we first identified 1828 LD SNPs using 49 reported GWAS SNPs as a start. We carefully annotated these 1828 LD SNPs via either UCSC known genes, UCSC regulation elements, or expression Quantitative Trait Loci (eQTL) data. As a result, we found 1154 SNPs were functionally annotated and obtained 205 unique PCa genes for further enrichment analysis. The enriched GO biological processes and pathways were found mainly related to regulation of cell death, apoptosis, cell proliferation, and metabolic process, which have been proved essential to cancer development. We constructed PCa genes specific transcription regulatory networks, finding several important genetic regulators for PCa, such as IGF-1/IGF-2 receptors, SP1, CREB1, and androgen receptor (AR).
Conclusions
A comprehensive framework was proposed for integrative and systematic analysis of PCa SNPs, the analysis can provide essential information for the understanding of the regulatory function of GWAS SNPs in PCa, and will facilitate the discovery of novel candidate biomarkers for diagnosis and prognosis of PCa.
Keywords: Genome-wide association study, prostate cancer, gene ontology, pathway, network
Background
As one of the most common but complex malignancy in men of developed countries, prostate cancer (PCa) has been the second death-leading one among various cancers [1-4]. However, the pathophysiology and molecular mechanism for PCa have remained poorly understood. According to the National Human Genome Research Institute (NHGRI) Catalog of published genome-wide association studies (GWAS) [5], there have been 49 SNPs reported in 14 publications (Caucasian population, as of June 3, 2011) relevant to PCa. Although these comprehensive studies have elucidated the mechanism of incidence of PCa to a certain extent, limited conclusions have been made regarding the causal correlation between the identified SNPs and the molecular carcinogenesis of PCa [6]. Moreover, findings from GWAS cannot directly lead to the identification of disease associated genes. One way is to consider genes overlapped by the originally identified SNPs as functional markers to complex disease traits [7]. Through this approach, several genes have been reported to be associated with PCa, such as TCF2 [8], HNF1B [9], MSMB [9], and EHBP1 [10]. However, most of the PCa GWAS SNPs were found to be located in intergenic region [5,11-16], making it hard to characterize the biological function at the gene level.
Gene expression has been reported to play essential roles in numerous important biological process and is highly heritable [17]. Considering the SNPs may have functional impacts on gene expression, the expression Quantitative Trait Loci (eQTL) approach has been proposed and commonly used to facilitate the identification of associations between intergenic SNPs and traits [18-20]. To date, several studies have demonstrated the great power of the eQTL approach to detect SNPs with stronger effects on gene expression from various human samples, including lymphoblastoid cell lines (LCLs) [19,21-28], monocytes [29], lymphocytes [30], adipose [31], brain [32], and liver [33]. However, those eQTL SNPs are also reported to act in a tissue-specific manner [34,35]. In this study, we mainly chose eQTLs of LCLs or those reported similar to LCLs [36-38], such as monocytes [29], and lymphocytes [30], which may provide much more information than LCLs alone.
Despite the significant power of genetic mapping in complex traits using eQTLs approach, there are many other factors may affect gene expression, such as the transcript stability, epigenetic effects, environmental stimuli, drug exposure, populations, and clinical covariates [17,36,39,40]. So far, most of PCa marker studies mainly focus on single genes, while how the discovered genes interact together to exert a significant combined effect on PCa still remains elusive. Recent studies [41,42] indicate that genes with altered expression levels may individually contribute a moderate risk to disease, but act in a synergistic mode at biological pathway or gene-network level [43,44]. Methods that focus on pathway/network rather than individual genes can detect significant coordinated changes. A representative analytic approach is the Gene Set Enrichment Analysis (GSEA), which has been commonly adapted [3,4,45-49] to sort the collected genes into predefined pathways or functional categories.
In this study, first, we performed a comprehensive assessment of the potential function of PCa related SNPs, utilizing the Encyclopedia of DNA Elements (ENCODE) genomic annotation databases, the annotation systems from University of California Santa Cruz database (UCSC table browser; http://genome.ucsc.edu/), and knowledge of PCa specific transcription factor binding sites (TFBS), e.g., AR, ER, and FoxA1, defined by previous studies [50,51]. Then, we collected the Pca related genes by either overlaying the SNPs or eQTL mapping. Functional enrichment analysis of the collected genes was then performed using Gene Ontology (GO) and predefined canonical pathways encoded in MetaCore™ (GeneGo, Inc.), a commercial integrated knowledge database. Finally, PCa-specific transcription regulatory networks were constructed from the inferred gene set. Our work may provide a practical framework for integrative genomics analysis of PCa at system level, which may provide a better insight into PCa and other complex diseases.
Results
Identification and annotation of SNPs in LD with GWAS PCa risk SNPs
We identified a total of 1828 SNPs in LD with the 49 reported GWAS PCa SNPs (Additional file 1). All SNPs were mapped to SNPs database (NCBI36/hg18 assembly, Mar. 2006, UCSC) to extract the information of alleles. Then the UCSC Known Gene annotation encoded in ANNOVAR [52] was processed on the identified 1828 SNPs. The results of the annotation were provided in Additional file 2, in which the first column explained the genomic locations of the SNP, e.g., exonic, intronic, splicing, ncRNA, 3'UTR, 5'UTR, upstream, downstream or intergenic, with the corresponding gene or the flanking gene symbols in the second column. Of the 1828 SNPs, 8, 599, 377, 4, 12, 6, and 10 SNPs were found in exon, intron, ncRNA, 5'UTR, 3'UTR, upstream, and downstream, respectively, while the rest 852 SNPs were located in intergenic regions, which was demonstrated as a pie-chart in Figure 1. On the other hand, we also collected regulatory data from three UCSC tracks, Yale TFBS, broad histone, and regulatory elements, as well as binding sites of AR/ER/FoxA1 defined by previous studies [50,51] (Additional file 3), to analyze all 1828 SNPs. As a result, 284 SNPs were annotated (Additional file 4), including 86 intergenic SNPs. Since the regulatory data were still under power to interpret the intergenic SNPs and could not directly lead to the corresponding gene, we mapped the all 852 intergenic SNPs to eQTL data (see Materials and Method part), and identified 151 unique genes corresponding to 138 SNPs.
Figure 1.
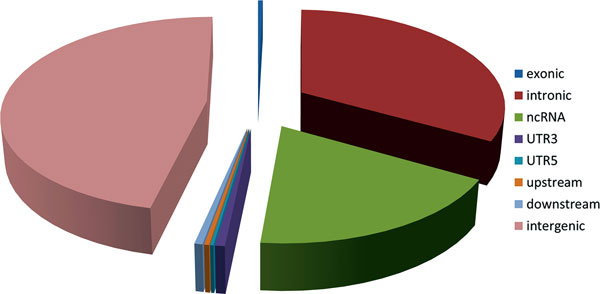
Pie-chart of genomic distributions of the 1828 PCa SNPs. Labels with different colors were used for clarity.
Enrichment analysis for PCa candidate genes
In total, we compiled a set of 205 unique PCa candidate genes, including 41 genes from ANNOVAR annotation using UCSC known genes, 151 genes by eQTL mapping, and 33 genes reported by the 14 GWAS publications, for enrichment analysis. To explore the synergistic function among the PCa genes, GO enrichment was performed using GeneGO. The top 10 terms of the three GO functional ontologies were listed in Table 1. The most significant term in each category was: regulation of cell death in biological process (p-value = 4.944 × 10⁻⁹), insulin-like growth factor receptor binding in molecular functions (p-value = 6.617 × 10⁻¹⁸), and cytoplasmic part in localizations (p-value = 1.009 × 10⁻⁶). Other significant terms of interest were also high-lighted, including regulation of apoptosis, metabolic process, insulin receptor binding, hormone activity, and NADH dehydrogenase complex. We also performed a pathway enrichment test for these 205 PCa genes, utilizing pre-defined canonical pathway sets from GeneGO system. As shown in Table 2, 8 pathways belong to oxidative, ubiquinone, transcription, development, cell adhesion, and cell cycle were significantly enriched with our PCa genes, including phosphorylation (p-value = 3.187 × 10⁻⁴), metabolism (p-value = 4.790 × 10⁻⁴), CREB pathway (p-value = 7.620 × 10⁻⁴), etc.
Table 1.
The top 10 terms of GO functional ontologies.
| GO terms | Observed* | p-value# |
|---|---|---|
| GO Biological Processes | ||
| Regulation of cell death | 40 | 4.944 × 10⁻⁹ |
| Regulation of apoptosis | 39 | 5.506 × 10⁻⁹ |
| Regulation of programmed cell death | 39 | 6.945 × 10⁻⁹ |
| Response to external stimulus | 39 | 1.237 × 10⁻⁸ |
| Metabolic process | 133 | 2.357 × 10⁻⁸ |
| Epithelial cell proliferation | 9 | 7.699 × 10⁻⁸ |
| Response to organic cyclic compound | 19 | 1.153 × 10⁻⁷ |
| Negative regulation of biological process | 61 | 1.650 × 10⁻⁷ |
| Rhythmic process | 15 | 2.056 × 10⁻⁷ |
| Branching morphogenesis of a tube | 12 | 2.070 × 10⁻⁷ |
| GO Molecular Functions | ||
| Insulin-like growth factor receptor binding | 11 | 6.617 × 10⁻¹⁸ |
| Insulin receptor binding | 10 | 1.501 × 10⁻¹² |
| Protease binding | 11 | 1.685 × 10⁻¹¹ |
| Binding | 156 | 1.574 × 10⁻¹⁰ |
| Protein binding | 115 | 1.593 × 10⁻⁹ |
| Protein complex binding | 17 | 2.310 × 10⁻⁷ |
| Hormone activity | 10 | 4.671 × 10⁻⁶ |
| Catalytic activity | 76 | 3.102 × 10⁻⁵ |
| Oxidoreductase activity, acting on NADH or NADPH, quinone or similar compound as acceptor | 5 | 6.596 × 10⁻⁵ |
| 4 iron, 4 sulfur cluster binding | 4 | 8.215 × 10⁻⁵ |
| GO Localizations | ||
| Cytoplasmic part | 99 | 1.009 × 10⁻⁶ |
| Mitochondrial envelope | 19 | 2.992 × 10⁻⁶ |
| Mitochondrial part | 22 | 9.733 × 10⁻⁶ |
| Envelope | 23 | 1.480 × 10⁻⁵ |
| Mitochondrion | 34 | 2.505 × 10⁻⁵ |
| Organelle envelope | 22 | 3.432 × 10⁻⁵ |
| Mitochondrial inner membrane | 13 | 7.758 × 10⁻⁵ |
| Mitochondrial respiratory chain complex I | 5 | 7.937 × 10⁻⁵ |
| NADH dehydrogenase complex | 5 | 7.937 × 10⁻⁵ |
| Respiratory chain complex I | 5 | 7.937 × 10⁻⁵ |
* Number of the observed genes of the gene list in the category
# p-values were calculated by FDR (0.05) adjustment
Table 2.
The enriched GeneGO canonical pathways.
| Category | GeneGO canonical pathways | p-value# |
|---|---|---|
| Oxidative | Phosphorylation | 3.187 × 10⁻⁴ |
| Ubiquinone | Metabolism | 4.790 × 10⁻⁴ |
| Transcription | CREB pathway | 7.620 × 10⁻⁴ |
| Development | WNT signaling pathway. Part 1. Degradation of beta-catenin in the absence WNT signaling | 5.859 × 10⁻⁴ |
| Cell adhesion | ECM remodeling | 1.119 × 10⁻³ |
| Cell cycle | Role of SCF complex in cell cycle regulation | 2.073 × 10⁻³ |
| Cell cycle | ESR1 regulation of G1/S transition | 3.018 × 10⁻³ |
| Cell cycle | Regulation of G1/S transition (part 1) | 4.521 × 10⁻³ |
# p-values were calculated by FDR (0.05) adjustment
PCa-specific transcription regulatory networks
Using the network construction module in GeneGO, we constructed the putative significant PCa-specific networks with determined p-values. Of the 205 PCa genes, 18 genes were failed to be enriched with any transcription regulatory network. Specifically, by retrieving the additional nodes such as interconnected genes or transcription factors, the top 10 significant transcription regulation networks were shown in Additional file 5. In the constructed transcription regulation networks, the most significant one was a network connecting AML1/ETO fusion protein, IGF-1 receptor, Insulin (INS) receptor, and IGF-2 receptor. 64 of 99 genes in this network are in our PCa candidate gene list (named as seed nodes) and the other 35 genes were recruited from the interaction database from GeneGO. It was obvious that most of the genes in this network were highly enriched in cellular metabolic process (45.3%, p-value = 6.947 × 10⁻²¹) and peptide stimulus (25.3%, p-value = 2.680 × 10⁻²¹), which had been proved significantly associated with the pathophysiology hypothesis of PCa incidence [53-55]. We visualized the network map in Figure 2, in which the genes were classified into four localizations: extracellular, membrane, cytoplasm, and nucleus, to clearly illustrate the activities of cellular process. Of note, different symbols were used to represent different genes, which were listed in Additional file 6 (Nodes sheet). And each color was assigned to the different mechanism between two genes, for example, green lines implied activation, brown implied inhibition, and grey indicated unspecified mechanism (Additional file 6, Interactions sheet). To better describe the importance of collected PCa genes, we highlighted the edges connecting critical nodes in this network, such as IGF-2, IGF-1, IRS-1, INS, STAT1, CREB1, STAT3, STAT5, c-Myc and Tcf. Moreover, we used GeneGO to conduct the statistical analysis to identify the important interactions, hubs, transcription factors, and receptors, which was listed in Additional file 6 (note, there were different sheets in Additional file 6). In this network, we identified 19 hubs, of which 11 are transcription factors, including c-Myc, CREB1, STAT1, etc. (Additional file 6, Hubs sheet), which is in good agreement with our annotation results of Yale TFBS. As indicated by Additional file 5, it is obvious that IGF-1/IGF-2 receptors were highly involved in PCa specific transcription regulation networks, and in fact, these two receptors were certainly involved in the development of PCa [56], indicating great importance of two genetic regulators. Another useful module in GeneGO is the disease enrichment approach, which can directly point out whether the constructed network is associated with studied disease, e.g., PCa in our work. After enrichment test, we found that 3 of the top 10 networks were significantly associated with PCa, that is "HNF3, IGF-1 receptor, IGF-2 receptor" (p-value = 1.610 × 10⁻¹⁷), "TEF, IGF-1 receptor, IGF-2 receptor (p-value = 3.920 × 10⁻¹¹)" and "COUP-TF, IGF-1 receptor, IGF-2 receptor (p-value = 1.148 × 10⁻¹¹)", which greatly raised the feasibility of our method.
Figure 2.
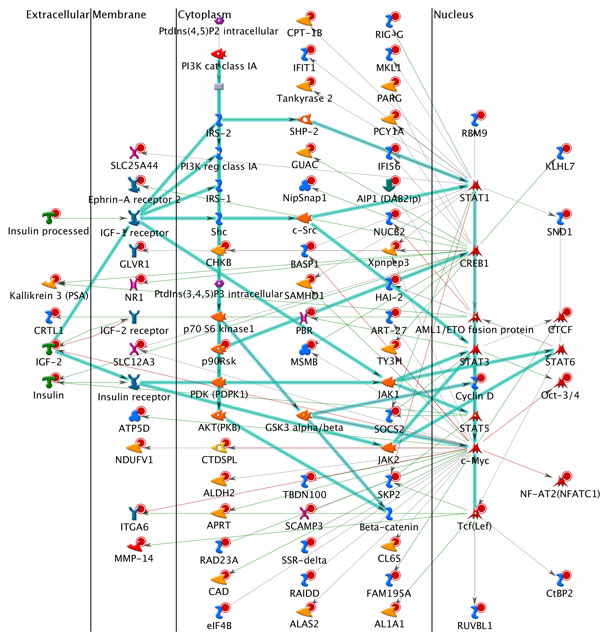
Network map of complex pattern of AML1/ETO fusion protein, IGF-1 receptor, Insulin receptor and IGF-2 receptor. Legends of nodes (genes) and edges (interaction) of the network were illustrated in Additional file 6.
To examine which genetic factor, e.g., transcriptional factor, involve in PCa genes, we also constructed the transcription factor networks. As shown in Additional file 5, the most significant transcription factor network among the top 10 significant ones was "SP1", which was comprised of 48 PCa genes and 1 GeneGO gene. We visualized this network in Figure 3. Note that different symbols represent different genes, which were shown in Additional file 6, while green and grey arrow lines in the figure displayed activation and inhibition interaction between the two genes, respectively. Interestingly, most of transcription factor networks were reported to be related with PCa, such as SP1 [57], c-Myc [58], AR [59], and p53 [60], supporting the hypothesis that the collected genes from systematic annotation of PCa GWAS LD SNPs were putative PCa biomarkers, and therefore provided more informative insights for regulatory systems in PCa, rather than the analysis of SNPs alone.
Figure 3.
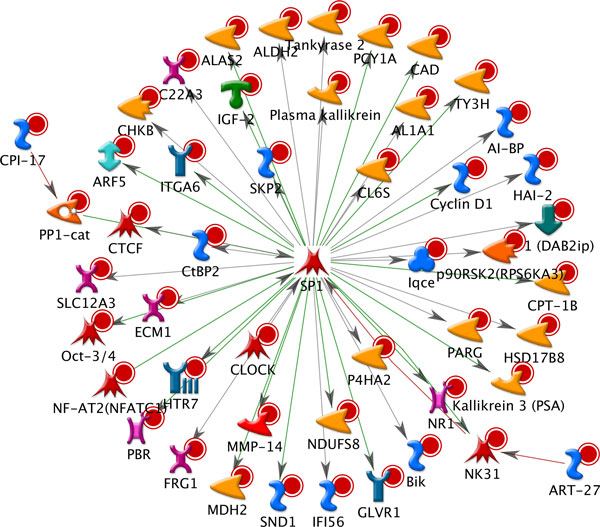
Network map of transcription factor SP1.
Discussion
Although PCa risk-associated SNPs identified from GWAS have been extensively investigated, the study of their synergistic function of the SNPs still remains elusive. One practical approach is to map the SNPs to related genes, which can be utilized for further systematic studies. Preliminary annotation of all 1828 LD SNPs indicated that nearly 50% of the SNPs were located in gene desert region. After collecting the 205 unique genes by gene overlapping or eQTL mapping, we further studied their biological functions by performing GO and pathway enrichment test, and constructing regulatory networks. The whole pipeline may offer us new insights into the function of PCa SNPs, genes, and relevant regulatory networks.
Our SNP annotation and eQTL analysis showed that 1154 of the 1828 SNPs had been functionally interpreted with corresponding genes. We found that these 1154 SNPs were distributed in 40 SNP blocks, which was listed in Additional file 7. 8q24 has long been confirmed as a susceptible locus of PCa [9,12-14,61]. In our study, it was obvious that more SNPs (265) were located on chromosome 8 (chr8), compared to chr10 (185), chr4 (180), chr17 (157), chr2 (118), and chr3 (112), indicating that regulatory regions in chr8 might be more sensitive and critical in prostate cancer. We also found that 284 of the identified 1828 SNPs were located in genomic regions of 29 pre-defined well-known regulators from UCSC annotation tracks. As shown in Figure 4, it was obvious that most of regulators showed a moderate enrichment, while, interestingly, ~60% of 284 annotated SNPs were associated with epigenetic functions, such as methylation and acetylation of histone H3 (enhancer: h3k4me1 and h3k4me2, transcriptional activity: h3k4me3 and h3k9ac). This indicated that epigenetics might play a crucial role in the mechanism of PCa, although further experimental investigation is required.
Figure 4.
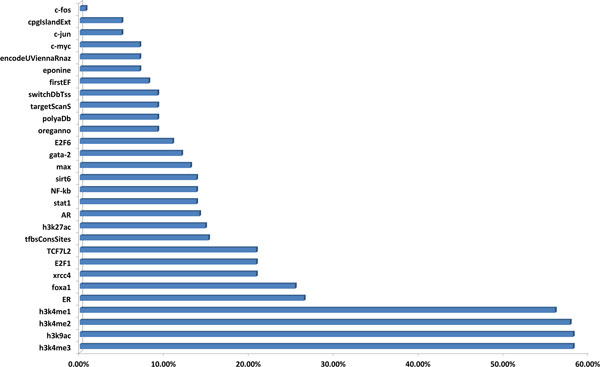
Functional annotation of PCa SNPs using UCSC annotation tracks and AR/ER/FoxA1 TFBS data. 29 regulators were analyzed and ranked.
Our GO enrichment analysis of the collected genes revealed the significant biological associations with PCa. The enriched GO biological process terms were mostly related with cellular regulation and metabolic process. In terms of biological process, we found that some genes of these GO enriched PCa genes have already been proved important in PCa, such as NADH dehydrogenase (NDUF) subcomplexes [52] (NDUFA11, NDUFA13, NDUFA3, NDUFS8, NDUFV1), IGF-2 [58] and CTCF [62] in the cellular regulation process, and SOCS2 [63], HNF1B [64], CCND1 [61], and INS [65] in the metabolic process. While top enriched terms in molecular function indicated that our PCa genes might actively involve in transcription factor binding activities. Although not surprising, the identified significant GeneGO pathways were previously reported important pathways in PCa, such as phosphorylation [66], metabolism [67], CREB signaling pathway [68-70], Wnt signaling pathway [71-73], and ECM remodeling [74].
Networks allowed us to explore the systematic gene interactions involved in cell signaling and metabolism, from initial receptor-ligand interactions to second messenger and signal transduction cascades. Interestingly, we observed a strong enrichment in transcription regulation and transcription factor networks, involving important genetic regulators, such as IGF-1, IGF-2, SP1, c-Myc, AR, and p53. In summary, our approach was efficient to discover the putative PCa associated genes using the reported GWAS SNPs as a start and public annotation data, e.g., known genes and eQTLs. Another advantage of our work is that we do not require the raw genotyping data, thus less computational burden.
Nevertheless, our works still has a few limitations. First, the number of reported GWAS SNPs is increasing according to the NHGRI website, our analysis need to be updated in the future with the changing. Second, we paid more attention to PCa genes and involved regulatory networks rather than the SNPs, which might ignore the importance of SNPs themselves, e.g., corresponding mutations at SNP sites in gene region. Third, we used LCL related eQTLs data for SNPs mapping in this study, while eQTLs derived from prostate tissue should be more comprehensive, which will be considered if data are available in the future. Fourth, the PCa specific networks were constructed based on GeneGO database. Although the quality of the databases has been validated, the interactions in the network are still with the accumulation of the scientific findings. Fifth, our work was carried out based on our computational strategies, which required further experimental validation. However, the work here explains a part of the intergenic SNPs, and therefore provides a practical and effective framework to the annotation of disease associated SNPs, especially the intergenic SNPs, at systems biology or network level.
Conclusions
We developed a systems biology framework to evaluate the function of PCa GWAS SNPs and their synergistic biological function in PCa. We explored well defined annotation data from UCSC tracks and eQTL from publications to collect the putative PCa specific genes. Our approach offered a comprehensive analysis including GO enrichment, pathway enrichment, and network construction, providing informative insights for further study of PCa, and could be applied to other complex diseases.
Materials and methods
Definition and annotation of SNPs in linkage disequilibrium (LD) with the GWAS PCa risk associated SNPs
All SNPs in linkage disequilibrium (LD) (r2 ≥ 0.5) with the 49 GWAS PCa SNPs (reached genome-wide significance level with a p-value ≤ 10-5) were obtained from SNAP database (http://www.broadinstitute.org/mpg/snap/ldsearchpw.php; proxy search; CEU genotype; 1000 Genomes Pilot 1 data set) [75]. We mapped all identified SNPs to UCSC known genes (NCBI36/hg18 assembly, Mar. 2006) using ANNOVAR [52]. Predefined regulatory regions for Yale TFBS, histone modifications defined by ENCODE project, and 11 regulatory elements were extracted from the UCSC database (Additional file 3). Transcription factors (AR, ER and FoxA1) binding sites from previous studies [50,51] were also applied for functional annotation [76].
Functional enrichment of the PCa candidate gene set
The PCa associated gene list was obtained according to annotation results as followed, if the SNP was located in the gene region, then the corresponding gene was selected. Otherwise, we mapped the SNPs to collected eQTL data, which was built based on a set of previously published papers [18,19,21-26,29,30,34] and a web-based database, SCAN [27], to discover the target genes.
To study the functional roles of the gene list, GeneGO database was used for Gene Ontology (GO) and pathway enrichment analysis. The significance of the enrichment (p-value) was determined by hypergeometric distribution for the probability of finding a set of genes within a given GO term or pathway, in which lower p-value indicated higher potential of non-randomness of the finding. The p-value was then adjusted by false discover rate (FDR) with a value of 0.05.
Construction of PCa-specific transcription regulatory networks
To construct the PCa-specific transcription regulatory networks, the algorithms implemented in GeneGO were applied to the PCa associated genes. In our study, transcription regulation and transcription factor networks were constructed, and the generated networks were ranked by statistical significance of enrichment (the p-values). For transcription regulation network construction, the transcription factors were added into the initial gene list to build a separate network around each transcription factor. Additional nodes from GeneGO database were extracted in order to make the target network interconnected. Transcription factor network with shortest paths between the transcription factor and the direct receptor was built using the PCa associated genes as seed nodes.
Competing interests
The authors declare that they have no competing interests.
Supplementary Material
Summary of the linkage disequilibrium (LD) relationship among the identified 1828 PCa SNPs.
Functional annotation of the identified 1828 PCa SNPs using UCSC Known Gene of ANNOVAR.
Annotation databases used for the bioinformatics analysis of PCa SNPs.
Annotation information over the identified 1828 PCa SNPs based on genomic databases, of which 284 SNPs were successfully interpreted.
Details of the 10 most significant transcription regulation and transcription factor networks.
Statistical information of the network of AML1/ETO fusion protein, IGF-1 receptor, Insulin receptor and IGF-2 receptor. Note, multiple sheets are offered.
Summary of the identified 40 SNP blocks of 1154 SNPs which were functionally interpreted with a gene.
Contributor Information
Junfeng Jiang, Email: 20104012001@suda.edu.cn.
Weirong Cui, Email: 20114212001@suda.edu.cn.
Wanwipa Vongsangnak, Email: wanwipa@suda.edu.cn.
Guang Hu, Email: huguang@suda.edu.cn.
Bairong Shen, Email: bairong.shen@suda.edu.cn.
Acknowledgements
We gratefully acknowledge financial support from the National Natural Science Foundation of China grants (91230117, 31170795, 91029703), the Specialized Research Fund for the Doctoral Program of Higher Education of China (20113201110015), International S&T Cooperation Program of Suzhou (SH201120) and the National High Technology Research and Development Program of China (863 program, Grant No. 2012AA02A601).
Declarations
The publication costs for this article were funded by the above grants.
This article has been published as part of BMC Genomics Volume 14 Supplement 8, 2013: Selected articles from the International Conference on Intelligent Biology and Medicine (ICIBM 2013): Genomics. The full contents of the supplement are available online at http://www.biomedcentral.com/bmcgenomics/supplements/14/S8.
References
- Crawford ED. Epidemiology of prostate cancer. Urology. 2003;14(6 Suppl 1):3–12. doi: 10.1016/j.urology.2003.10.013. [DOI] [PubMed] [Google Scholar]
- Chen J, Zhang D, Yan W, Yang D, Shen B. Translational bioinformatics for diagnostic and prognostic prediction of prostate cancer in the next-generation sequencing era. BioMed research international. 2013;14:901578. doi: 10.1155/2013/901578. [DOI] [PMC free article] [PubMed] [Google Scholar]
- Tang Y, Yan W, Chen J, Luo C, Kaipia A, Shen B. Identification of novel microRNA regulatory pathways associated with heterogeneous prostate cancer. BMC systems biology. 2013;14(Suppl 3):S6. doi: 10.1186/1752-0509-7-S3-S6. [DOI] [PMC free article] [PubMed] [Google Scholar]
- Wang Y, Chen J, Li Q, Wang H, Liu G, Jing Q, Shen B. Identifying novel prostate cancer associated pathways based on integrative microarray data analysis. Comput Biol Chem. 2011;14(3):151–158. doi: 10.1016/j.compbiolchem.2011.04.003. [DOI] [PubMed] [Google Scholar]
- Hindorff LA, Sethupathy P, Junkins HA, Ramos EM, Mehta JP, Collins FS, Manolio TA. Potential etiologic and functional implications of genome-wide association loci for human diseases and traits. Proc Natl Acad Sci USA. 2009;14(23):9362–9367. doi: 10.1073/pnas.0903103106. [DOI] [PMC free article] [PubMed] [Google Scholar]
- Drake TA, Schadt EE, Davis RC, Lusis AJ. Integrating genetic and gene expression data to study the metabolic syndrome and diabetes in mice. Am J Ther. 2005;14(6):503–511. doi: 10.1097/01.mjt.0000178775.39149.64. [DOI] [PubMed] [Google Scholar]
- Botstein D, Risch N. Discovering genotypes underlying human phenotypes: past successes for mendelian disease, future approaches for complex disease. Nat Genet. 2003;14:228–237. doi: 10.1038/ng1090. [DOI] [PubMed] [Google Scholar]
- Gudmundsson J, Sulem P, Steinthorsdottir V, Bergthorsson JT, Thorleifsson G, Manolescu A, Rafnar T, Gudbjartsson D, Agnarsson BA, Baker A. et al. Two variants on chromosome 17 confer prostate cancer risk, and the one in TCF2 protects against type 2 diabetes. Nat Genet. 2007;14(8):977–983. doi: 10.1038/ng2062. [DOI] [PubMed] [Google Scholar]
- Thomas G, Jacobs KB, Yeager M, Kraft P, Wacholder S, Orr N, Yu K, Chatterjee N, Welch R, Hutchinson A. et al. Multiple loci identified in a genome-wide association study of prostate cancer. Nat Genet. 2008;14(3):310–315. doi: 10.1038/ng.91. [DOI] [PubMed] [Google Scholar]
- Gudmundsson J, Sulem P, Rafnar T, Bergthorsson JT, Manolescu A, Gudbjartsson D, Agnarsson BA, Sigurdsson A, Benediktsdottir KR, Blondal T. et al. Common sequence variants on 2p15 and Xp11.22 confer susceptibility to prostate cancer. Nat Genet. 2008;14(3):281–283. doi: 10.1038/ng.89. [DOI] [PMC free article] [PubMed] [Google Scholar]
- Lu Y, Zhang Z, Yu H, Zheng SL, Isaacs WB, Xu J, Sun J. Functional annotation of risk loci identified through genome-wide association studies for prostate cancer. Prostate. 2011;14:955–963. doi: 10.1002/pros.21311. [DOI] [PMC free article] [PubMed] [Google Scholar]
- Eeles RA, Kote-Jarai Z, Giles GG, Olama AA, Guy M, Jugurnauth SK, Mulholland S, Leongamornlert DA, Edwards SM, Morrison J. et al. Multiple newly identified loci associated with prostate cancer susceptibility. Nat Genet. 2008;14(3):316–321. doi: 10.1038/ng.90. [DOI] [PubMed] [Google Scholar]
- Gudmundsson J, Sulem P, Manolescu A, Amundadottir LT, Gudbjartsson D, Helgason A, Rafnar T, Bergthorsson JT, Agnarsson BA, Baker A. et al. Genome-wide association study identifies a second prostate cancer susceptibility variant at 8q24. Nat Genet. 2007;14(5):631–637. doi: 10.1038/ng1999. [DOI] [PubMed] [Google Scholar]
- Yeager M, Orr N, Hayes RB, Jacobs KB, Kraft P, Wacholder S, Minichiello MJ, Fearnhead P, Yu K, Chatterjee N. et al. Genome-wide association study of prostate cancer identifies a second risk locus at 8q24. Nat Genet. 2007;14(5):645–649. doi: 10.1038/ng2022. [DOI] [PubMed] [Google Scholar]
- Lou H, Yeager M, Li H, Bosquet JG, Hayes RB, Orr N, Yu K, Hutchinson A, Jacobs KB, Kraft P. et al. Fine mapping and functional analysis of a common variant in MSMB on chromosome 10q11.2 associated with prostate cancer susceptibility. Proc Natl Acad Sci USA. 2009;14(19):7933–7938. doi: 10.1073/pnas.0902104106. [DOI] [PMC free article] [PubMed] [Google Scholar]
- Chang BL, Cramer SD, Wiklund F, Isaacs SD, Stevens VL, Sun J, Smith S, Pruett K, Romero LM, Wiley KE. et al. Fine mapping association study and functional analysis implicate a SNP in MSMB at 10q11 as a causal variant for prostate cancer risk. Hum Mol Genet. 2009;14(7):1368–1375. doi: 10.1093/hmg/ddp035. [DOI] [PMC free article] [PubMed] [Google Scholar]
- Storey JD, Madeoy J, Strout JL, Wurfel M, Ronald J, Akey JM. Gene-expression variation within and among human populations. Am J Hum Genet. 2007;14(3):502–509. doi: 10.1086/512017. [DOI] [PMC free article] [PubMed] [Google Scholar]
- Stranger BE, Nica AC, Forrest MS, Dimas A, Bird CP, Beazley C, Ingle CE, Dunning M, Flicek P, Koller D. et al. Population genomics of human gene expression. Nat Genet. 2007;14(10):1217–1224. doi: 10.1038/ng2142. [DOI] [PMC free article] [PubMed] [Google Scholar]
- Dixon AL, Liang L, Moffatt MF, Chen W, Heath S, Wong KC, Taylor J, Burnett E, Gut I, Farrall M. et al. A genome-wide association study of global gene expression. Nat Genet. 2007;14(10):1202–1207. doi: 10.1038/ng2109. [DOI] [PubMed] [Google Scholar]
- Schadt EE, Monks SA, Drake TA, Lusis AJ, Che N, Colinayo V, Ruff TG, Milligan SB, Lamb JR, Cavet G. et al. Genetics of gene expression surveyed in maize, mouse and man. Nature. 2003;14(6929):297–302. doi: 10.1038/nature01434. [DOI] [PubMed] [Google Scholar]
- Cheung VG, Spielman RS, Ewens KG, Weber TM, Morley M, Burdick JT. Mapping determinants of human gene expression by regional and genome-wide association. Nature. 2005;14(7063):1365–1369. doi: 10.1038/nature04244. [DOI] [PMC free article] [PubMed] [Google Scholar]
- Kwan T, Benovoy D, Dias C, Gurd S, Provencher C, Beaulieu P, Hudson TJ, Sladek R, Majewski J. Genome-wide analysis of transcript isoform variation in humans. Nat Genet. 2008;14(2):225–231. doi: 10.1038/ng.2007.57. [DOI] [PubMed] [Google Scholar]
- Petretto E, Mangion J, Dickens NJ, Cook SA, Kumaran MK, Lu H, Fischer J, Maatz H, Kren V, Pravenec M. et al. Heritability and tissue specificity of expression quantitative trait loci. PLoS Genet. 2006;14(10):e172. doi: 10.1371/journal.pgen.0020172. [DOI] [PMC free article] [PubMed] [Google Scholar]
- Stranger BE, Forrest MS, Dunning M, Ingle CE, Beazley C, Thorne N, Redon R, Bird CP, de Grassi A, Lee C. et al. Relative impact of nucleotide and copy number variation on gene expression phenotypes. Science. 2007;14(5813):848–853. doi: 10.1126/science.1136678. [DOI] [PMC free article] [PubMed] [Google Scholar]
- Min JL, Taylor JM, Richards JB, Watts T, Pettersson FH, Broxholme J, Ahmadi KR, Surdulescu GL, Lowy E, Gieger C. et al. The use of genome-wide eQTL associations in lymphoblastoid cell lines to identify novel genetic pathways involved in complex traits. PloS one. 2011;14(7):e22070. doi: 10.1371/journal.pone.0022070. [DOI] [PMC free article] [PubMed] [Google Scholar]
- Veyrieras JB, Kudaravalli S, Kim SY, Dermitzakis ET, Gilad Y, Stephens M, Pritchard JK. High-resolution mapping of expression-QTLs yields insight into human gene regulation. PLoS Genet. 2008;14(10):e1000214. doi: 10.1371/journal.pgen.1000214. [DOI] [PMC free article] [PubMed] [Google Scholar]
- Gamazon ER, Zhang W, Konkashbaev A, Duan S, Kistner EO, Nicolae DL, Dolan ME, Cox NJ. SCAN: SNP and copy number annotation. Bioinformatics. 2010;14(2):259–262. doi: 10.1093/bioinformatics/btp644. [DOI] [PMC free article] [PubMed] [Google Scholar]
- Emilsson V, Thorleifsson G, Zhang B, Leonardson AS, Zink F, Zhu J, Carlson S, Helgason A, Walters GB, Gunnarsdottir S. et al. Genetics of gene expression and its effect on disease. Nature. 2008;14(7186):423–428. doi: 10.1038/nature06758. [DOI] [PubMed] [Google Scholar]
- Zeller T, Wild P, Szymczak S, Rotival M, Schillert A, Castagne R, Maouche S, Germain M, Lackner K, Rossmann H. et al. Genetics and beyond--the transcriptome of human monocytes and disease susceptibility. PloS one. 2010;14(5):e10693. doi: 10.1371/journal.pone.0010693. [DOI] [PMC free article] [PubMed] [Google Scholar]
- Goring HH, Curran JE, Johnson MP, Dyer TD, Charlesworth J, Cole SA, Jowett JB, Abraham LJ, Rainwater DL, Comuzzie AG. et al. Discovery of expression QTLs using large-scale transcriptional profiling in human lymphocytes. Nat Genet. 2007;14(10):1208–1216. doi: 10.1038/ng2119. [DOI] [PubMed] [Google Scholar]
- Chen Y, Zhu J, Lum PY, Yang X, Pinto S, MacNeil DJ, Zhang C, Lamb J, Edwards S, Sieberts SK. et al. Variations in DNA elucidate molecular networks that cause disease. Nature. 2008;14(7186):429–435. doi: 10.1038/nature06757. [DOI] [PMC free article] [PubMed] [Google Scholar]
- Myers AJ, Gibbs JR, Webster JA, Rohrer K, Zhao A, Marlowe L, Kaleem M, Leung D, Bryden L, Nath P. et al. A survey of genetic human cortical gene expression. Nat Genet. 2007;14(12):1494–1499. doi: 10.1038/ng.2007.16. [DOI] [PubMed] [Google Scholar]
- Schadt EE, Molony C, Chudin E, Hao K, Yang X, Lum PY, Kasarskis A, Zhang B, Wang S, Suver C. et al. Mapping the genetic architecture of gene expression in human liver. PLoS Biol. 2008;14(5):e107. doi: 10.1371/journal.pbio.0060107. [DOI] [PMC free article] [PubMed] [Google Scholar]
- Dimas AS, Deutsch S, Stranger BE, Montgomery SB, Borel C, Attar-Cohen H, Ingle C, Beazley C, Gutierrez Arcelus M, Sekowska M. et al. Common regulatory variation impacts gene expression in a cell type-dependent manner. Science. 2009;14(5945):1246–1250. doi: 10.1126/science.1174148. [DOI] [PMC free article] [PubMed] [Google Scholar]
- Heinzen EL, Ge D, Cronin KD, Maia JM, Shianna KV, Gabriel WN, Welsh-Bohmer KA, Hulette CM, Denny TN, Goldstein DB. Tissue-specific genetic control of splicing: implications for the study of complex traits. PLoS Biol. 2008;14(12):e1. doi: 10.1371/journal.pbio.1000001. [DOI] [PMC free article] [PubMed] [Google Scholar]
- Cookson W, Liang L, Abecasis G, Moffatt M, Lathrop M. Mapping complex disease traits with global gene expression. Nat Rev Genet. 2009;14(3):184–194. doi: 10.1038/nrg2537. [DOI] [PMC free article] [PubMed] [Google Scholar]
- Ding J, Gudjonsson JE, Liang L, Stuart PE, Li Y, Chen W, Weichenthal M, Ellinghaus E, Franke A, Cookson W. et al. Gene expression in skin and lymphoblastoid cells: Refined statistical method reveals extensive overlap in cis-eQTL signals. Am J Hum Genet. 2010;14(6):779–789. doi: 10.1016/j.ajhg.2010.10.024. [DOI] [PMC free article] [PubMed] [Google Scholar]
- Nica AC, Parts L, Glass D, Nisbet J, Barrett A, Sekowska M, Travers M, Potter S, Grundberg E, Small K. et al. The architecture of gene regulatory variation across multiple human tissues: the MuTHER study. PLoS Genet. 2011;14(2):e1002003. doi: 10.1371/journal.pgen.1002003. [DOI] [PMC free article] [PubMed] [Google Scholar]
- Spielman RS, Bastone LA, Burdick JT, Morley M, Ewens WJ, Cheung VG. Common genetic variants account for differences in gene expression among ethnic groups. Nat Genet. 2007;14(2):226–231. doi: 10.1038/ng1955. [DOI] [PMC free article] [PubMed] [Google Scholar]
- Innocenti F, Cooper GM, Stanaway IB, Gamazon ER, Smith JD, Mirkov S, Ramirez J, Liu W, Lin YS, Moloney C. et al. Identification, replication, and functional fine-mapping of expression quantitative trait loci in primary human liver tissue. PLoS Genet. 2011;14(5):e1002078. doi: 10.1371/journal.pgen.1002078. [DOI] [PMC free article] [PubMed] [Google Scholar]
- Guo AY, Sun J, Jia P, Zhao Z. A novel microRNA and transcription factor mediated regulatory network in schizophrenia. BMC systems biology. 2010;14:10. doi: 10.1186/1752-0509-4-10. [DOI] [PMC free article] [PubMed] [Google Scholar]
- Jia P, Zheng S, Long J, Zheng W, Zhao Z. dmGWAS: dense module searching for genome-wide association studies in protein-protein interaction networks. Bioinformatics. 2011;14(1):95–102. doi: 10.1093/bioinformatics/btq615. [DOI] [PMC free article] [PubMed] [Google Scholar]
- Sun J, Jia P, Fanous AH, van den Oord E, Chen X, Riley BP, Amdur RL, Kendler KS, Zhao Z. Schizophrenia gene networks and pathways and their applications for novel candidate gene selection. PloS one. 2010;14(6):e11351. doi: 10.1371/journal.pone.0011351. [DOI] [PMC free article] [PubMed] [Google Scholar]
- Jia P, Ewers JM, Zhao Z. Prioritization of epilepsy associated candidate genes by convergent analysis. PloS one. 2011;14(2):e17162. doi: 10.1371/journal.pone.0017162. [DOI] [PMC free article] [PubMed] [Google Scholar]
- Mootha VK, Lindgren CM, Eriksson KF, Subramanian A, Sihag S, Lehar J, Puigserver P, Carlsson E, Ridderstrale M, Laurila E. et al. PGC-1alpha-responsive genes involved in oxidative phosphorylation are coordinately downregulated in human diabetes. Nat Genet. 2003;14(3):267–273. doi: 10.1038/ng1180. [DOI] [PubMed] [Google Scholar]
- Subramanian A, Tamayo P, Mootha VK, Mukherjee S, Ebert BL, Gillette MA, Paulovich A, Pomeroy SL, Golub TR, Lander ES. et al. Gene set enrichment analysis: a knowledge-based approach for interpreting genome-wide expression profiles. Proc Natl Acad Sci USA. 2005;14(43):15545–15550. doi: 10.1073/pnas.0506580102. [DOI] [PMC free article] [PubMed] [Google Scholar]
- Wang K, Li M, Bucan M. Pathway-based approaches for analysis of genomewide association studies. Am J Hum Genet. 2007;14(6):1278–1283. doi: 10.1086/522374. [DOI] [PMC free article] [PubMed] [Google Scholar]
- Chen J, Wang Y, Shen B, Zhang D. Molecular signature of cancer at gene level or pathway level? Case studies of colorectal cancer and prostate cancer microarray data. Computational and mathematical methods in medicine. 2013;14:909525. doi: 10.1155/2013/909525. [DOI] [PMC free article] [PubMed] [Google Scholar]
- Chen J, Zhang D, Zhang W, Tang Y, Yan W, Guo L, Shen B. Clear cell renal cell carcinoma associated microRNA expression signatures identified by an integrated bioinformatics analysis. Journal of translational medicine. 2013;14:169. doi: 10.1186/1479-5876-11-169. [DOI] [PMC free article] [PubMed] [Google Scholar]
- Wang Q, Li W, Zhang Y, Yuan X, Xu K, Yu J, Chen Z, Beroukhim R, Wang H, Lupien M. et al. Androgen receptor regulates a distinct transcription program in androgen-independent prostate cancer. Cell. 2009;14(2):245–256. doi: 10.1016/j.cell.2009.04.056. [DOI] [PMC free article] [PubMed] [Google Scholar]
- Carroll JS, Meyer CA, Song J, Li W, Geistlinger TR, Eeckhoute J, Brodsky AS, Keeton EK, Fertuck KC, Hall GF. et al. Genome-wide analysis of estrogen receptor binding sites. Nat Genet. 2006;14(11):1289–1297. doi: 10.1038/ng1901. [DOI] [PubMed] [Google Scholar]
- Pavlides S, Tsirigos A, Vera I, Flomenberg N, Frank PG, Casimiro MC, Wang C, Fortina P, Addya S, Pestell RG. et al. Loss of stromal caveolin-1 leads to oxidative stress, mimics hypoxia and drives inflammation in the tumor microenvironment, conferring the "reverse Warburg effect": a transcriptional informatics analysis with validation. Cell Cycle. 2010;14(11):2201–2219. doi: 10.4161/cc.9.11.11848. [DOI] [PubMed] [Google Scholar]
- Tombal B. What is the pathophysiology of a hormone-resistant prostate tumour? Eur J Cancer. 2011;14(Suppl 3):S179–188. doi: 10.1016/S0959-8049(11)70163-0. [DOI] [PubMed] [Google Scholar]
- Vesely DL. Metabolic targets of cardiac hormones' therapeutic anti-cancer effects. Curr Pharm Des. 2010;14(9):1159–1166. doi: 10.2174/138161210790963887. [DOI] [PubMed] [Google Scholar]
- Redig AJ, Munshi HG. Metabolic syndrome after hormone-modifying therapy: risks associated with antineoplastic therapy. Oncology (Williston Park) 2010;14(9):839–844. [PubMed] [Google Scholar]
- Russell PJ, Bennett S, Stricker P. Growth factor involvement in progression of prostate cancer. Clin Chem. 1998;14(4):705–723. [PubMed] [Google Scholar]
- Sankpal UT, Goodison S, Abdelrahim M, Basha R. Targeting Sp1 transcription factors in prostate cancer therapy. Med Chem. 2011;14(5):518–525. doi: 10.2174/157340611796799203. [DOI] [PubMed] [Google Scholar]
- Djavan B, Waldert M, Seitz C, Marberger M. Insulin-like growth factors and prostate cancer. World J Urol. 2001;14(4):225–233. doi: 10.1007/s003450100220. [DOI] [PubMed] [Google Scholar]
- Heinlein CA, Chang C. Androgen receptor in prostate cancer. Endocr Rev. 2004;14(2):276–308. doi: 10.1210/er.2002-0032. [DOI] [PubMed] [Google Scholar]
- Chi SG, deVere White RW, Meyers FJ, Siders DB, Lee F, Gumerlock PH. p53 in prostate cancer: frequent expressed transition mutations. J Natl Cancer Inst. 1994;14(12):926–933. doi: 10.1093/jnci/86.12.926. [DOI] [PubMed] [Google Scholar]
- Kaltz-Wittmer C, Klenk U, Glaessgen A, Aust DE, Diebold J, Lohrs U, Baretton GB. FISH analysis of gene aberrations (MYC, CCND1, ERBB2, RB, and AR) in advanced prostatic carcinomas before and after androgen deprivation therapy. Lab Invest. 2000;14(9):1455–1464. doi: 10.1038/labinvest.3780152. [DOI] [PubMed] [Google Scholar]
- Filippova GN. Genetics and epigenetics of the multifunctional protein CTCF. Curr Top Dev Biol. 2008;14:337–360. doi: 10.1016/S0070-2153(07)80009-3. [DOI] [PubMed] [Google Scholar]
- Zhu JG, Dai QS, Han ZD, He HC, Mo RJ, Chen G, Chen YF, Wu YD, Yang SB, Jiang FN. et al. Expression of SOCSs in human prostate cancer and their association in prognosis. Mol Cell Biochem. 2013;14:51–59. doi: 10.1007/s11010-013-1687-6. [DOI] [PubMed] [Google Scholar]
- Sun J, Zheng SL, Wiklund F, Isaacs SD, Purcell LD, Gao Z, Hsu FC, Kim ST, Liu W, Zhu Y. et al. Evidence for two independent prostate cancer risk-associated loci in the HNF1B gene at 17q12. Nat Genet. 2008;14(10):1153–1155. doi: 10.1038/ng.214. [DOI] [PMC free article] [PubMed] [Google Scholar]
- Neuhausen SL, Slattery ML, Garner CP, Ding YC, Hoffman M, Brothman AR. Prostate cancer risk and IRS1, IRS2, IGF1, and INS polymorphisms: strong association of IRS1 G972R variant and cancer risk. Prostate. 2005;14(2):168–174. doi: 10.1002/pros.20216. [DOI] [PubMed] [Google Scholar]
- Xiao D, Powolny AA, Moura MB, Kelley EE, Bommareddy A, Kim SH, Hahm ER, Normolle D, Van Houten B, Singh SV. Phenethyl isothiocyanate inhibits oxidative phosphorylation to trigger reactive oxygen species-mediated death of human prostate cancer cells. J Biol Chem. 2010;14(34):26558–26569. doi: 10.1074/jbc.M109.063255. [DOI] [PMC free article] [PubMed] [Google Scholar]
- Taylor BS, Pal M, Yu J, Laxman B, Kalyana-Sundaram S, Zhao R, Menon A, Wei JT, Nesvizhskii AI, Ghosh D. et al. Humoral response profiling reveals pathways to prostate cancer progression. Mol Cell Proteomics. 2008;14(3):600–611. doi: 10.1074/mcp.M700263-MCP200. [DOI] [PubMed] [Google Scholar]
- Shaywitz AJ, Greenberg ME. CREB: a stimulus-induced transcription factor activated by a diverse array of extracellular signals. Annu Rev Biochem. 1999;14:821–861. doi: 10.1146/annurev.biochem.68.1.821. [DOI] [PubMed] [Google Scholar]
- Unni E, Sun S, Nan B, McPhaul MJ, Cheskis B, Mancini MA, Marcelli M. Changes in androgen receptor nongenotropic signaling correlate with transition of LNCaP cells to androgen independence. Cancer Res. 2004;14(19):7156–7168. doi: 10.1158/0008-5472.CAN-04-1121. [DOI] [PubMed] [Google Scholar]
- Mantamadiotis T, Papalexis N, Dworkin S. CREB signalling in neural stem/progenitor cells: Recent developments and the implications for brain tumour biology. Bioessays. 2012. [DOI] [PubMed]
- Moon RT, Miller JR. The APC tumor suppressor protein in development and cancer. Trends Genet. 1997;14(7):256–258. doi: 10.1016/S0168-9525(97)01196-7. [DOI] [PubMed] [Google Scholar]
- Spink KE, Polakis P, Weis WI. Structural basis of the Axin-adenomatous polyposis coli interaction. EMBO J. 2000;14(10):2270–2279. doi: 10.1093/emboj/19.10.2270. [DOI] [PMC free article] [PubMed] [Google Scholar]
- Kharaishvili G, Simkova D, Makharoblidze E, Trtkova K, Kolar Z, Bouchal J. Wnt signaling in prostate development and carcinogenesis. Biomed Pap Med Fac Univ Palacky Olomouc Czech Repub. 2011;14(1):11–18. doi: 10.5507/bp.2011.016. [DOI] [PubMed] [Google Scholar]
- Tuxhorn JA, Ayala GE, Smith MJ, Smith VC, Dang TD, Rowley DR. Reactive stroma in human prostate cancer: induction of myofibroblast phenotype and extracellular matrix remodeling. Clin Cancer Res. 2002;14(9):2912–2923. [PubMed] [Google Scholar]
- Johnson AD, Handsaker RE, Pulit SL, Nizzari MM, O'Donnell CJ, de Bakker PI. SNAP: a web-based tool for identification and annotation of proxy SNPs using HapMap. Bioinformatics. 2008;14(24):2938–2939. doi: 10.1093/bioinformatics/btn564. [DOI] [PMC free article] [PubMed] [Google Scholar]
- Lu Y, Zhang Z, Yu H, Zheng SL, Isaacs WB, Xu J, Sun J. Functional annotation of risk loci identified through genome-wide association studies for prostate cancer. Prostate. 2011;14(9):955–963. doi: 10.1002/pros.21311. [DOI] [PMC free article] [PubMed] [Google Scholar]
Associated Data
This section collects any data citations, data availability statements, or supplementary materials included in this article.
Supplementary Materials
Summary of the linkage disequilibrium (LD) relationship among the identified 1828 PCa SNPs.
Functional annotation of the identified 1828 PCa SNPs using UCSC Known Gene of ANNOVAR.
Annotation databases used for the bioinformatics analysis of PCa SNPs.
Annotation information over the identified 1828 PCa SNPs based on genomic databases, of which 284 SNPs were successfully interpreted.
Details of the 10 most significant transcription regulation and transcription factor networks.
Statistical information of the network of AML1/ETO fusion protein, IGF-1 receptor, Insulin receptor and IGF-2 receptor. Note, multiple sheets are offered.
Summary of the identified 40 SNP blocks of 1154 SNPs which were functionally interpreted with a gene.