

Abstract
Low intensity focused ultrasound was applied with microbubbles (Definity, 0.02 mL/kg) to produce brain lesions in 50 rats at 558 kHz. Burst sonications (burst length: 10 ms; pulse repetition frequency: 1 Hz; total exposure: 5 min; acoustic powers: 0.47-1.3W) generated ischemic or hemorrhagic lesions at the focal volume revealed by both MR imaging and histology. Shorter burst (2 ms) or shorter sonication time (1 min) reduced the probability of lesion production. Longer pulses (200ms, 500ms and continuous wave) caused significant near-field damages. Using microbubbles with focused ultrasound significantly reduced the acoustic power levels, therefore avoided skull heating issues and potentially can extend the treatable volume of transcranial focused ultrasound to the brain tissues close to the skull.
Keywords: focused ultrasound, microbubble, brain lesion, hemorrhage, transcranial ultrasound
INTRODUCTION
In the past decade, transcranial high intensity focused ultrasound (HIFU) has emerged as a noninvasive neurosurgical tool for the potential treatment of various brain diseases. A hemispherical design of large-array transducers operating below one MHz allows acoustic energy passing through the maximum available skull area, therefore reduces skull heating while delivering sufficient energy for thermally ablating the focal volume (Sun and Hynynen 1999). A large array also enables phase correction on transducer elements to restore the focal distortion due to variance of skull thickness and density (Hynynen and Jolesz 1998, Tanter et al. 1998, Hynynen and Sun 1999, Clement and Hynynen 2002). Furthermore, magnetic resonance imaging (MRI) provides excellent anatomical guidance and dynamic temperature monitoring of the focal spot and surrounding tissues (De Poorter et al. 1995, Ishihara et al. 1995), which significantly improves the accuracy of heat deposition and the safety profile of the procedure (Hynynen et al. 2004). Preliminary patient trials using a magnetic resonance-guided focused ultrasound (MRgFUS) brain system have been performed for tumor ablation (McDannold et al. 2010) and neuropathic pain treatment (Martin et al. 2009, Jeanmonod et al. 2012).
Despite significant progresses, thermal ablation is only feasible in the middle of the brain. If targets are close to the skull, near-field or far-field heating on that piece of bone may still be significant (McDannold et al. 2010, Pulkkinen et al. 2011). Therefore, alternative methods have been explored to potentiate the ultrasound damage on the tissue with reduced acoustic intensity to avoid bone overheating. Previously it has been shown that with an intravenous injection of preformed microbubbles, the focused ultrasound (FUS) power needed to produce brain lesions was reduced by an order of magnitude (McDannold et al. 2006, Vykhodtseva et al. 2006). These studies were performed with a 1.5 MHz focused transducer with continuous wave (CW) sonication or with 50% duty cycles. Craniotomies were performed on rabbits to avoid acoustic attenuation. Significant temperature elevations were observed at the focal volume. However, the temperature increase was lower than the level required for thermal tissue ablation (5.9 ° C temperature elevation at 50% probability of tissue necrosis). Therefore, the presence of microbubbles during the sonication might sensitize the tissue to the thermal exposure. The detailed mechanism was still not well understood.
Microbubbles have also been used with FUS to reversibly disrupt blood-brain barrier (BBB) for delivering drugs to the brain (Hynynen et al. 2001, Choi et al. 2007, McDanold et al. 2008 (1,2), Liu et al. 2010, Tung et al. 2011). Microbubbles act as a nucleation promotion agent in an ultrasound field for either stable or inertial cavitation, which mechanically impacts upon the micro-vasculature (McDannold et al. 2006 (2), Tung et al. 2010). With a proper combination of FUS parameters, it has been shown that the tight junctions between the endothelial cells in the brain capillaries can be reversibly broken up without or with only minimal red blood cell extravasation (Sheikov et al. 2004). So far, all these studies aimed on improving vascular permeability for drug delivery. Extensive hemorrhage/neuron damage was considered as a side effect which should be avoided. To our knowledge, other than the two brain lesion studies referred earlier (McDannold et al. 2006, Vykhodtseva et al. 2006), no other study has been published with the attempt to cause brain lesions by combining thermal exposures with FUS and microbubbles.
The previous studies on brain lesioning were performed at 1.5 MHz with craniotomies. In the current study, a 558 kHz FUS transducer was used since this frequency is more suitable for transcranial sonications for human applications. The clinical brain HIFU system (ExAblate 4000, InSightec, Tirat Carmel, Israel) is available at 650 kHz and 230 kHz. Therefore, the results at 558 kHz are within the range to be translated for potential clinical applications. Continuous wave/long duty cycle sonications have been shown to cause near-field heating/tissue damage in the presence of microbubbles (McDannold et al. 2006, Tung et al. 2006). In this study, short pulses similar to BBB studies were applied, while acoustic parameters were increased for maximizing the microvascular damage. The hypothesis was that with a higher acoustic power and/or a longer sonication time than that used for BBB disruption, damage could be induced on the capillary endothelial walls, which led to the disturbance of blood supply and the formation of localized brain lesions.
MATERIALS AND METHODS
Animal Preparation
Animal experiments were performed on 50 Sprauge-Dawley rats weighing 400-600 g. The procedures were approved by the Institutional Animal Care Committee. Animals underwent anesthesia using a mixture of 50 mg/kg ketamine hydrochloride (Abbott Laboratories, North Chicago, IL, USA) and 10 mg/kg xylazine (Phoenix Pharmaceuticals, St Joseph, MO, USA). The hairs on the rat head were removed using hair clippers and depilatory lotion. A catheter was inserted into the tail vein for microbubble and MRI contrast agent injections.
Focused Ultrasound
A MR-compatible focused ultrasound system was used with a 1.5 T MRI scanner (Signa, GE Healthcare, Milwaukee, USA). The ultrasound beam was generated by a piezoelectric transducer (10 cm diameter, 7.8 cm radius of curvature, 558 kHz centre frequency, manufactured in house). The focal volume was 3 mm in the lateral dimension and 10 mm in the axial. The transducer was positioned in a degassed water tank using a MRI-compatible three-axis motorized system (Chopra et al. 2009). The experiment setup is illustrated by an annotated MR image in Figure 1. The transducer was driven by a function generator (Wavetek, model 395, San Diego, USA) and RF amplifier (ENI, model 240L, 50dB, Rochester, USA). The transducer's electrical impedance was matched to the output impedance of the amplifier (50Ω) with a custom-made passive matching circuit. The electrical power was measured in CW mode by a power meter (Hewlett Packard, model 438A, Palo Alto, USA) connected to a dual directional coupler (Werlatone, model C173, Brewster, USA). Prior to the experiment, the power meter readings were calibrated using a radiation force method for the acoustic power. Burst sonications at four levels of acoustic powers were used (0.47, 0.59, 0.89, and 1.3W). The peak pressure at the focus was calibrated by using a factory-calibrated fiber-optic hydrophone (active tip diameter of 10 μm, Precision Acoustics, Dorset, UK) in water, then measured skull insertion loss of 21% (O'Reilly et al. 2011) and 5 Np/m/MHz (Goss et al. 1979) attenuation coefficient for 5 mm brain tissue were used to estimate in situ negative peak-pressure amplitudes (267, 300, 366, 444 kPa). These pressure levels were higher than the level we used for BBB disruptions at 558 kHz (245 kPa, with an average of 20% increase of Gd enhancement without hemorrhage. Burgess et al. 2012). Microbubbles (Definity, Lantheus Medical Imaging, N. Billerica, MA, USA) were injected as a bolus intravenously at 0.02 mL/kg simultaneous to the start of sonications. Four non-overlapping locations per brain (two in each hemisphere) were sonicated. Overall, 142 sonicated locations were included in this study. Locations excluded were due to either one of the following reasons: 1. ultrasound parameters tested initially, but discontinued later due to non-significant biological difference from the main parameters included in this study; 2. animal motion during sonications; 3. tail vein collapsed; 4. water coupling issues. Five-minute sonications with 10 ms bursts at 1 Hz PRF were used as the standard pulse scheme in 76 of 142 locations. The 10 ms/Hz pulse was optimized in Hynynen et al. 2001. The 5 min sonication was intended to fully use the microbubble bolus before its clearance in the vasculature (1.3-1.9 min vascular half-life in human according to the Definity labels), and was earlier shown to result in tissue damage (Chopra et al. 2010). At other locations, shorter (2 ms) or longer bursts (200 ms, 500 ms and CW) of either 5 min or 1 min sonications were tested to investigate the impact of FUS parameters on the characteristics of brain lesions.
Figure 1.

An annotated MR image illustrating the experimental setup.
MRI
Anatomical images were acquired in multiple planes before and after sonications using a T2-weighted fast spin echo (FSE) sequence (TE = 62 ms, TR = 2000 ms, ETL = 4, Bandwidth = 6.94 kHz, 128 × 128 matrix, slice thickness = 1 mm, NEX = 2, FOV = 6 cm) to evaluate signs of tissue damage or edema after exposures. After sonications, a bolus injection of MRI contrast agent (Omniscan, 0.1 mmol/kg, GE Healthcare, USA) was administered in order to visualize BBB disruption. Contrast-enhanced images were acquired using a T1-weighted FSE sequence (TE = 10 ms, TR = 500 ms, ETL = 4, Bandwidth = 15.63 kHz, NEX = 6). In addition, proton resonance frequency-based MRI thermometry sequence was applied to monitor the temperature elevation (gradient echo sequence, TR = 39 ms, TE = 20 ms, Flip angle = 30, 5 sec/phase). The time lags between the microbubble injection (start of sonication) and the start of the thermometry sequence was about 30 seconds, which were compensated by linear interpolation in the analysis of the temperature data.
Histology
The animals were sacrificed 2 to 5 hours (N=39), 24 hours (N=5), 48 hours (N=3) or 7 days (N=3) after sonications. Animals were transcardially perfused with 10% neutral formalin and 5 μm brain sections (1 mm spacing) were stained with hematoxylin and eosin (H&E) for routine histological evaluation. Eight sections each containing four spots of sonicated volumes (sacrificed at 5, 24 and 48h) were selected based on the confirmation of lesion productions by H&E staining for TUNEL staining (ApopTag, CHEMICON International, Inc., CA) for labeling DNA strand breaks that occur during apoptosis (Gavrieli et al. 1992). Two sections from two animals sacrificed at 7 days were immunostained with antibodies for glial firbrillary acidic protein (GFAP), the marker for reactive astrocytes. The GFAP is an intermediate filament protein that is specific for astrocytes. Following injury astrocytes become reactive and respond in a typical manner, termed astrogliosis. Therefore the GFAP staining reveals reactive astrocytes following lesioning.
RESULTS
Sonications with 10 ms/Hz, 5 minutes
Eight H&E stained histology sections from each brain were examined. With the standard 10ms/Hz, 5 min sonications, the most consistent features were extravasations of red blood cells into the brain parenchyma and associated acute degeneration of the surrounding tissues. Neuron death/clearance in the sonicated volume in H&E staining was used to confirm lesion formation. At the lowest pressure of 267 kPa, the probability for lesion production was ~39% (7/18) at 2 hours to 48 hours. The lesions were predominately characterized by ischemic necrosis. At 300, 366 and 444 kPa, the probability of lesion production was 50% (7/14), 61% (11/18) and 71% (10/14), respectively. However, the difference at the four estimated pressure levels were not statistically significant at the 5% significance level (Fisher's exact test, p>0.05). This might be caused by the uncertainty of in vivo pressure levels due to standing waves. Extensive hemorrhage and hemorrhagic necrosis dominated. The severity of hemorrhage seems to be correlated with the acoustic pressure: at the lowest pressure of 267 kPa, only moderate hemorrhage was observed, while at higher pressure levels extensive hemorrhages were apparent. All locations demonstrated typical cell fragments or apoptotic bodies and could extend next to the skull bone. In TUNEL staining, apoptotic cells were identified by the presence of various types of chromatin condensation or apoptotic bodies (dark- brown, round or oval in shape). However, the amount of apoptotic cells found in the sonicated regions were not correlated to the acoustic pressure: at some locations with significant hemorrhage after high pressure sonications, fewer apoptotic cells were found than those locations sonicated at lower pressures. At 7 days, at locations sonicated at 267 and 300 kPa, only scattered macrophages were detected, while at 366 and 444 kPa, sonicated locations demonstrated cellular infiltrations of a mixture of astrocytes and macrophages. GFAP staining reveals reactive astrocytes.
T1- and T2-weighted images consistently revealed BBB disruptions and edemas after sonications. Among the four sonicated spots in each animal, the time difference from the first sonication to the last one was about 30 min. Two boluses of Gd injections were given to visualize the BBB disruptions at all four spots: one after the first and the other after the third sonication. Therefore, the levels of Gd enhancement at the four locations were not expected to be only correlated to the acoustic pressure levels. Similarly, post-sonication T2-weighted images were acquired after the 4th sonication for the detection of edemas. Edema develops over time, therefore signal intensities and area of edema at the four locations were weighted by time: at the 4th location only immediate edema response was visualized.
Figure 2 shows an example of four sonicated spots in one animal sacrificed 24 hours post sonication. The histological analysis revealed different characteristics of the lesions at four power levels explained in details in the caption. Figure 3 shows an animal sacrificed in 7 days, with reactive astrocytes in GFAP staining but no residual hemorrhage found in the H&E.
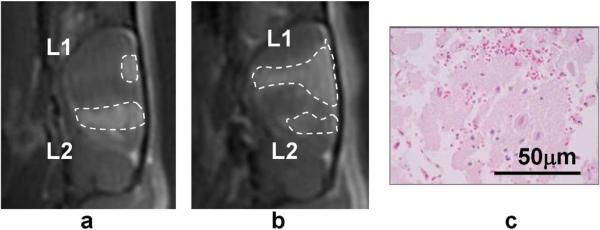
Figure 2.

One example of imaging and histology results by 10ms/Hz, 5 min sonications. The animal was sacrificed in 24 hours. Images (a)-(c) are the T1, T2-weighted MR images and the gross H&E image. L1-L4 indicate the four locations with 267, 300, 366 and 444 kPa sonications, respectively. Images (d)-(f) shows the H&E and TUNEL staining at L1. Despite the moderate perivascular extravasations, ischemic lesion was formed. At 24 hours this area was clear of tissue structure and contained only a few cell fragments and debris (arrows). There was autolysis resulting in the early formation of a semi-liquid mass of dead cells with mild inflammatory infiltration. Images (g)-(i) shows the corresponding histology results at L4. Hemorrhagic necrosis (infarct) was dominant (arrows). However, despite more numerous hemorrhages than that at L1, the number of apoptotic cells at L4 (brown dots in i) was fewer than L1 (f).
Figure 3.

Results of one animal sacrificed in 7 days. Sonication was 10ms/Hz, 5 min, at 366, 444, 267 and 300 kPa at L1-L4, respectively. Image (a) is the Gd-enhanced T1-weighted image showing the BBB disruption following sonications. H&E stained image (b) found no residual hemorrhage. The zoom-in at L2 (c) shows cellular infiltrations of a mixture of astrocytes and macrophages. Gross GFAP staining (d) and zoom-in at L2 (e) reveal reactive astrocytes at the region of sonication.
Sonications with Other Parameters
Only 1 of 31 exposures of one minute duration produced a necrotic lesion (at 300 kPa), while at the rest 30 locations at all pressure levels used, only scattered extravasation of red blood cells and selective neuronal necrosis were observed. The probability of inducing lesions with one-minute sonication was significantly lower than 5-minute sonication (p<0.001). An example is shown in Figure 4. With shorter FUS bursts of 2 ms and 5 min sonication time, the probability for lesion production was 0% (0/7) at 267 kPa, 30% (3/10) at 300 kPa, 25% (2/8) at 366 kPa, and 100% (2/2) at 444 kPa. The probability of inducing lesions with the 2ms pulse was significantly lower than the 10 ms pulse, both with 5 min duration (p=0.02). Sonications with 2 ms, 5 min, however, had a significantly higher chance to induce lesion than 10ms, 1 min sonications (p=0.02). With a longer burst length of 200 ms, destruction of vessel walls and mechanical destruction of the brain parenchyma were found (Figure 5). However, an observation was that with 500ms and CW, ultrasound appeared to be blocked by bubble cavitations close to the skull, therefore damages to target in the brain were less severe than that with the 200 ms bursts. This may suggest that a low duty cycle should be used for FUS applications with microbubbles, to allow cavitated bubbles be carried away from the ultrasound near-field by blood perfusion when the ultrasound is off.
Figure 4.

Example of 10ms/Hz, 1 min sonications. Pressures at L1-L4 were 267, 300, 366 and 444 kPa, respectively. The animal was sacrificed in 48 hours. T1-weighted MR image (a) shows good BBB disruptions, and mild edemas were seen on the T2-weighted image (b). In H&E (c-e), scattered hemorrhages were found, but normal neurons (short arrow in e) were seen adjacent to degenerated neurons (long arrows). No large area of discrete lesion was formed.
Figure 5.
Imaging and histology results of two animals by 200, 500ms/Hz, and CW sonications (5 min). Animals sacrificed in 24 hours. Image (a) is a sagittal T1-weighted image showing the BBB disruption along the acoustical axis with 500 ms bursts at L1 and 200 ms bursts at L2, both at 267 kPa. BBB was only disrupted at the superficial level with the 500 ms bursts. Image (b) shows the result of 200 ms bursts at L1 and CW at L2, both at 444 kPa. BBB disruption was less extended with CW than that with 200 ms. H&E staining (c) reveals mechanical destruction of the brain parenchyma at L1 of (b).
MR Thermometry
Despite the low power levels used, ultrasound-produced heating presented in MRI thermometry images acquired during the sonications. However, artifacts were observed around the focus due to the cavitation of air bubbles. Therefore, it was difficult to determine the exact shape and magnitude of the temperature distribution. Temperature measurements were further complicated by background magnetic drift and animal motions (respiratory and eye movements) during the five-minute sonications. Temperature measurements were taken by a 3×3 region of interest (ROI) at the centre of the focus. Background magnetic drifts were compensated by measuring a 10×10 ROI in the brain on the opposite hemisphere of the sonication. Data with significant motion were excluded. The temperature elevations appeared to be in proportion to the acoustic pressures. At 267, 300, 366 and 444 kPa, temperature increases were 2.4±1.5 °C, 4.2±2.3 °C, 7.7±5.5 °C, and 10.0±7.3 °C, respectively. Fig.6 shows a measurement of a 5-min sonication at 444 kPa, 10 ms/Hz. Additional 5-min scan were taken post the sonication to measure the temperature decrease. The temperature decline post sonication appeared to be very slow and artifacts were still present 5 mins post sonication.
Figure 6.
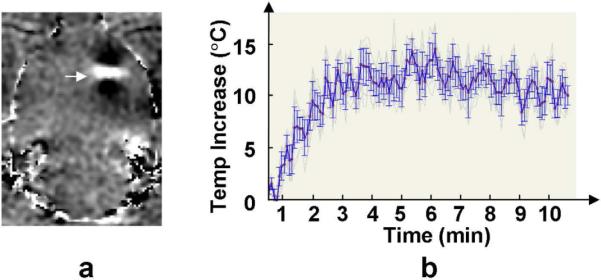
MR thermometry measurement of one 5-min sonication at 444 kPa, 10 ms/Hz. Arrow in (a) indicates temperature change at the focus (bright), surrounded by dipole pattern artifacts (dark). Image (b) shows the temporal profile of the temperature elevation and subsequent cooling at the focal volume.
DISCUSSION
In this study we demonstrated that 558 kHz FUS combined with microbubble was able to produce localized lesions in the brain at reduced acoustical power starting next to the skull bone. The highest time-average acoustic power in this study with the 10ms/Hz pulses was only 13 mW (1.3W × 1% duty cycle), or ~0.07 W/cm2 in intensity. For human studies, maybe an even lower frequency, such as the 230 kHz available on the ExAblate brain system, allows a larger steering range and removes the need for phase correction. However, the focal size at 230 kHz (6 mm in the lateral dimension) is too large for multiple sonications in rat brains, therefore was not used in this study.
The histological findings suggest that FUS with microbubble might produce localized lesions through two cavitation-mediated processes: ischemia due to occlusion of the capillary blood vessels (through the formation of emboli and platelet aggregation) and hemorrhagic necrosis. The cavitated microbubbles might obstruct blood flow in the capillaries, thus causing tissue ischemia followed by inflammatory response and complement activation. Aggregation of platelets and clot formation might occur as well following damage on endothelial cells, leading to further obstruction of microcirculation and tissue damage. Studies in animal models and humans demonstrated that the presence of gas microbubbles causes the pro-thrombotic effects through mechanisms that include increased platelet aggregation (Thorsen et al. 1989, Poliachik et al. 2001, 2004, Shigeta el al. 2003), complement activation (Borden et al. 2008), fibrinolysis (Tachibana et al. 1995, Prokop et al. 2007), release of tissue-factor (Jalali et al. 2010), reduced endothelial function (Villanueva et al. 1997), and increased leukocyte infiltration (Lindner et al. 2000). Using platelet-rich plasma (Poliachik et al. 2001, 2004), it was demonstrated that high-intensity focused ultrasound (HIFU) activated platelets, stimulated them to aggregate and promoted their adherence to a collagen-coated surface. Ischemic lesions by vascular occlusion, if can be achieved over a controlled volume, are presumably preferred in the clinical situation. Hemorrhagic lesions are normally considered come with a higher risk in the brain if bleeding is not controllable in some patients. Furthermore, as evident in this study, more apoptotic cells were detected in the ischemic lesions than in the hemorrhagic lesions. Apoptosis has the advantage of not causing significant inflammatory response as in necrosis (Vykhodtseva et al. 2006, Miller et al. 2007). However, excessive cavitation may also alter platelet functions which impede aggregation to occur, partially preserving blood flow in some capillaries. This might explain that despite multiple perivascular hemorrhages (e.g. L3 in Fig.2), some neurons in sonicated region appeared to survive. Therefore, it will be important to control the level of vascular damage by adjusting the acoustic power levels, potentially based on cavitation feedback (Gyongy et al. 2010, 2011, Jensen et al. 2012, Arvanitis et al. 2012). This deserves further studies in the future.
In this work, 2 ms to CW sonications of 1 or 5 mins were applied. One minute sonication significantly lowered the chance of lesion forming. This suggests a shorter sonication is more appropriate for BBB disruptions in the context of drug delivery. Bolus injections of microbubble were used in this study, therefore the longest sonication time (5 min) was limited by the clearance rate of microbubbles in vivo. If microbubbles are infused over a longer time frame, the characteristics of lesion forming at various acoustic parameters might be different. It is also demonstrated that long duty cycles (500ms, CW) were not appropriate for sonicating microbubbles, as the cavitations on the ultrasound path blocked most of the energy from reaching the focus.
At 558 kHz, it has been shown that the focus profile through rat skulls were not significantly distorted (O'Reilly et al. 2011). However, standing wave is a known issue in rat experiments with transcranial FUS, due to the parallel structures between the outer skull and the skull base, and their short distance (~ 10 mm). As a low frequency ultrasound was used (558 kHz), the relatively long wavelength (~2.5 mm) and the low attenuation in brain tissues might result in significant standing wave in the brain. Standing wave caused uncertainties on acoustic pressures in vivo, therefore the results of various pressure levels were mixed. The purpose of this preliminary work was to understand the nature of the lesions with a range of acoustic parameters. In future studies, pressure levels should be better controlled by either using short-burst sonication to avoid standing wave (O'Reilly et al. 2010), or adjusting the acoustic power by the cavitation feedback from hydrophones in real-time either with or without standing waves (O'Reilly and Hynynen 2012). In human studies with a hemispherical array, it has been shown that the impact of standing wave was minimized to be negligible (Song et al. 2012).
MRI in general can visualize the lesions/edemas and the corresponding BBB disruptions. However, the timing of the scan appeared to be important. In this study, all the T2-weighted images were acquired immediately after the last sonication, therefore in many cases the lesion of the last sonication has not been formed. Furthermore, T2-weighted MRI is not able to differentiate different types of lesions revealed by histology. Other types of MRI sequences, such as T2*-weighted sequence for hemorrhage imaging (Liu et al. 2008), and diffusion-weighted sequence for detecting ischemic regions (Kucharczyk et al. 1991) might be useful.
In MR thermometry imaging, artifacts observed around the focus were presumably susceptibility artifacts induced by the microbubbles or extravasated red blood cells. The artifacts encountered here were not observed in the previous study that used Optison and 1.5 MHz ultrasound exposures (McDannold et al. 2006). It might be that the bubbles grew to a larger size in the present study due to the lower ultrasound frequency used, producing a larger susceptibility artifact. Artifacts in MR thermometry caused by gas bubbles in HIFU (Khokhlova et al. 2009) and RF ablation (Viallon et al. 2010) were reported. However, to our best knowledge, this is the first study showing this pattern of artifacts with microbubbles. It was not certain if the quantitative measurements were accurate in the presence of these artifacts. This needs to be investigated in future studies. Furthermore, the slow decay of temperature post sonication was unexpected. It might be that the local perfusion was destroyed therefore the heat could not be carried away, or the extravasated red blood cells caused significant T2* artifacts.
In conclusion, this work demonstrates that FUS combined with microbubbles can produce brain lesions with low powers at a frequency suitable for transcranial applications in human. Future work will be necessary to monitor and control the sonications, to optimize the exposure parameters for producing well-defined ischemic lesions without the complication of extensive hemorrhages.
Table 1.
Number of lesions produced at various acoustic pressures.
| No.of Lesions | 267 kPa | 300 kPa | 366 kPa | 444 kPa | Total |
|---|---|---|---|---|---|
| 10 ms/Hz, 5 min | 7/18 | 7/14 | 11/18 | 10/14 | 35/64 |
| 10 ms/Hz, 1 min | 0/9 | 1/9 | 0/7 | 0/6 | 1/31 |
| 2 ms/Hz, 5 min | 0/7 | 3/10 | 2/8 | 2/2 | 7/27 |
| Total | 7/34 | 11/33 | 13/33 | 12/22 |
ACKNOWLEDGEMENTS
The authors thank Ping Wu, Shawna Rideout-Gros, Alexandra Garces and Milan Ganguly for assisting on the experiments, and acknowledge the funding support by NIH research grants R01EB003268, U41RR019703.
Footnotes
Publisher's Disclaimer: This is a PDF file of an unedited manuscript that has been accepted for publication. As a service to our customers we are providing this early version of the manuscript. The manuscript will undergo copyediting, typesetting, and review of the resulting proof before it is published in its final citable form. Please note that during the production process errors may be discovered which could affect the content, and all legal disclaimers that apply to the journal pertain.
REFERENCES
- Arvanitis CD, Livingstone MS, Vykhodtseva N, McDannold N. Controlled ultrasound-induced blood-brain barrier disruption using passive acoustic emissions monitoring. PLoS One. 2012;7:e45783. doi: 10.1371/journal.pone.0045783. [DOI] [PMC free article] [PubMed] [Google Scholar]
- Borden MA, Zhang H, Gillies RJ, Dayton PA, Ferrara KW. A stimulus-responsive contrast agent for ultrasound molecular imaging. Biomaterials. 2008;29:597–606. doi: 10.1016/j.biomaterials.2007.10.011. [DOI] [PMC free article] [PubMed] [Google Scholar]
- Burgess A, Huang Y, Querbes W, Sah DW, Hynynen K. Focused ultrasound for targeted delivery of siRNA and efficient knockdown of Htt expression. J Control Release. 2012;163:125–9. doi: 10.1016/j.jconrel.2012.08.012. [DOI] [PMC free article] [PubMed] [Google Scholar]
- Choi JJ, Pernot M, Small SA, Konofagou EE. Noninvasive, transcranial and localized opening of the blood-brain barrier using focused ultrasound in mice. Ultrasound Med Biol. 2007;33:95–104. doi: 10.1016/j.ultrasmedbio.2006.07.018. [DOI] [PubMed] [Google Scholar]
- Chopra R, Curiel L, Staruch R, Morrison L, Hynynen K. An MRI-compatible system for focused ultrasound experiments in small animal models. Med Phys. 2009;36:1867–74. doi: 10.1118/1.3115680. [DOI] [PMC free article] [PubMed] [Google Scholar]
- Chopra R, Vykhodtseva N, Hynynen K. Influence of exposure time and pressure amplitude on blood-brain-barrier opening using transcranial ultrasound exposures. ACS Chem Neurosci. 2010;1:391–8. doi: 10.1021/cn9000445. [DOI] [PMC free article] [PubMed] [Google Scholar]
- Clement GT, Hynynen K. A non-invasive method for focusing ultrasound through the human skull. Phys Med Biol. 2002;47:1219–36. doi: 10.1088/0031-9155/47/8/301. [DOI] [PubMed] [Google Scholar]
- De Poorter J, De Wagter C, De Deene Y, Thomsen C, Stahlberg F, Achten E. Noninvasive MRI thermometry with the proton resonance frequency (PRF) method: in vivo results in human muscle. Magn Reson Med. 1995;33:74–81. doi: 10.1002/mrm.1910330111. [DOI] [PubMed] [Google Scholar]
- Gavrieli Y, Sherman Y, Ben-Sasson SA. Identification of programmed cell death in situ via specific labeling of nuclear DNA fragmentation. J Cell Biol. 1992;119:493–501. doi: 10.1083/jcb.119.3.493. [DOI] [PMC free article] [PubMed] [Google Scholar]
- Goss SA, Frizzell LA, Dunn F. Ultrasonic absorption and attenuation in mammalian tissues. Ultrasound Med Biol. 1979;5:181–6. doi: 10.1016/0301-5629(79)90086-3. [DOI] [PubMed] [Google Scholar]
- Gyongy M, Coussios CC. Passive spatial mapping of inertial cavitation during HIFU exposure. IEEE Trans Biomed Eng. 2010;57:48–56. doi: 10.1109/TBME.2009.2026907. [DOI] [PubMed] [Google Scholar]
- Gyongy M, Coviello CM. Passive cavitation mapping with temporal sparsity constraint. J Acoust Soc Am. 2011;130:3489–97. doi: 10.1121/1.3626138. [DOI] [PubMed] [Google Scholar]
- Hynynen K, Jolesz FA. Demonstration of potential noninvasive ultrasound brain therapy through an intact skull. Ultrasound Med Biol. 1998;24:275–83. doi: 10.1016/s0301-5629(97)00269-x. [DOI] [PubMed] [Google Scholar]
- Hynynen K, Sun J. Trans-skull ultrasound therapy: the feasibility of using image-derived skull thickness information to correct the phase distortion. IEEE Trans Ultrason Ferroelectr Freq Control. 1999;46:752–5. doi: 10.1109/58.764862. [DOI] [PubMed] [Google Scholar]
- Hynynen K, McDannold N, Vykhodtseva N, Jolesz FA. Noninvasive MR imaging-guided focal opening of the blood-brain barrier in rabbits. Radiology. 2001;220:640–6. doi: 10.1148/radiol.2202001804. [DOI] [PubMed] [Google Scholar]
- Hynynen K, Clement GT, McDannold N, Vykhodtseva N, King R, White PJ, Vitek S, Jolesz FA. 500-element ultrasound phased array system for noninvasive focal surgery of the brain: a preliminary rabbit study with ex vivo human skulls. Magn Reson Med. 2004;52:100–7. doi: 10.1002/mrm.20118. [DOI] [PubMed] [Google Scholar]
- Ishihara Y, Calderon A, Watanabe H, et al. A precise and fast temperature mapping using water proton chemical shift. Magn Reson Med. 1995;34:814–23. doi: 10.1002/mrm.1910340606. [DOI] [PubMed] [Google Scholar]
- Jalali S, Huang Y, Dumont DJ, Hynynen K. Focused ultrasound-mediated bbb disruption is associated with an increase in activation of AKT: experimental study in rats. BMC Neurol. 2010;10:114. doi: 10.1186/1471-2377-10-114. [DOI] [PMC free article] [PubMed] [Google Scholar]
- Jeanmonod D, Werner B, Morel A, Michels L, Zadicario E, Schiff G, Martin E. Transcranial magnetic resonance imaging-guided focused ultrasound: noninvasive central lateral thalamotomy for chronic neuropathic pain. Neurosurg Focus. 2012;32:E1. doi: 10.3171/2011.10.FOCUS11248. [DOI] [PubMed] [Google Scholar]
- Jensen CR, Ritchie RW, Gyongy M, Collin JR, Leslie T, Coussios CC. Spatiotemporal monitoring of high-intensity focused ultrasound therapy with passive acoustic mapping. Radiology. 2012;262:252–61. doi: 10.1148/radiol.11110670. [DOI] [PubMed] [Google Scholar]
- Khokhlova TD, Canney MS, Lee D, Marro KI, Crum LA, Khokhlova VA, Bailey MR. Magnetic resonance imaging of boiling induced by high intensity focused ultrasound. J Acoust Soc Am. 2009;125:2420–31. doi: 10.1121/1.3081393. [DOI] [PMC free article] [PubMed] [Google Scholar]
- Kucharczyk J, Mintorovitch J, Asgari HS, Moseley M. Diffusion/perfusion MR imaging of acute cerebral ischemia. Magn Reson Med. 1991;19:311–5. doi: 10.1002/mrm.1910190220. [DOI] [PubMed] [Google Scholar]
- Lindner JR, Song J, Xu F, Klibanov AL, Singbartl K, Ley K, Kaul S. Noninvasive ultrasound imaging of inflammation using microbubbles targeted to activated leukocytes. Circulation. 2000;102:2745–50. doi: 10.1161/01.cir.102.22.2745. [DOI] [PubMed] [Google Scholar]
- Liu HL, Wai YY, Chen WS, Chen JC, Hsu PH, Wu XY, Huang WC, Yen TC, Wang JJ. Hemorrhage detection during focused-ultrasound induced blood-brain-barrier opening by using susceptibility-weighted magnetic resonance imaging. Ultrasound Med Biol. 2008;34:598–606. doi: 10.1016/j.ultrasmedbio.2008.01.011. [DOI] [PubMed] [Google Scholar]
- Liu HL, Hua MY, Chen PY, Chu PC, Pan CH, Yang HW, Huang CY, Wang JJ, Yen TC, Wei KC. Blood-brain barrier disruption with focused ultrasound enhances delivery of chemotherapeutic drugs for glioblastoma treatment. Radiology. 2010;255:415–25. doi: 10.1148/radiol.10090699. [DOI] [PubMed] [Google Scholar]
- Martin E, Jeanmonod D, Morel A, Zadicario E, Werner B. High-intensity focused ultrasound for noninvasive functional neurosurgery. Ann Neurol. 2009;66:858–61. doi: 10.1002/ana.21801. [DOI] [PubMed] [Google Scholar]
- McDannold N, Vykhodtseva N, Hynynen K. Microbubble contrast agent with focused ultrasound to create brain lesions at low power levels: MR imaging and histologic study in rabbits. Radiology. 2006;241:95–106. doi: 10.1148/radiol.2411051170. [DOI] [PubMed] [Google Scholar]
- McDannold N, Vykhodtseva N, Hynynen K. Targeted disruption of the blood-brain barrier with focused ultrasound: association with cavitation activity. Phys Med Biol. 2006;51:793–807. doi: 10.1088/0031-9155/51/4/003. [DOI] [PubMed] [Google Scholar]
- McDannold N, Vykhodtseva N, Hynynen K. Blood-brain barrier disruption induced by focused ultrasound and circulating preformed microbubbles appears to be characterized by the mechanical index. Ultrasound Med Biol. 2008;34:834–40. doi: 10.1016/j.ultrasmedbio.2007.10.016. [DOI] [PMC free article] [PubMed] [Google Scholar]
- McDannold N, Vykhodtseva N, Hynynen K. Effects of acoustic parameters and ultrasound contrast agent dose on focused-ultrasound induced blood-brain barrier disruption. Ultrasound Med Biol. 2008;34:930–7. doi: 10.1016/j.ultrasmedbio.2007.11.009. [DOI] [PMC free article] [PubMed] [Google Scholar]
- McDannold N, Clement GT, Black P, Jolesz F, Hynynen K. Transcranial magnetic resonance imaging-guided focused ultrasound surgery of brain tumors: initial findings in 3 patients. Neurosurgery. 2010;66:323–32. doi: 10.1227/01.NEU.0000360379.95800.2F. [DOI] [PMC free article] [PubMed] [Google Scholar]
- McDannold N, Park EJ, Mei CS, Zadicario E, Jolesz F. Evaluation of three-dimensional temperature distributions produced by a low-frequency transcranial focused ultrasound system within ex vivo human skulls. IEEE Trans Ultrason Ferroelectr Freq Control. 2010;57:1967–76. doi: 10.1109/TUFFC.2010.1644. [DOI] [PMC free article] [PubMed] [Google Scholar]
- Miller DL, Li P, Dou C, Armstrong WF, Gordon D. Evans blue staining of cardiomyocytes induced by myocardial contrast echocardiography in rats: evidence for necrosis instead of apoptosis. Ultrasound Med Biol. 2007;33:1988–96. doi: 10.1016/j.ultrasmedbio.2007.06.008. [DOI] [PMC free article] [PubMed] [Google Scholar]
- O'Reilly MA, Huang Y, Hynynen K. The impact of standing wave effects on transcranial focused ultrasound disruption of the blood-brain barrier in a rat model. Phys Med Biol. 2010;55:5251–67. doi: 10.1088/0031-9155/55/18/001. [DOI] [PMC free article] [PubMed] [Google Scholar]
- O'Reilly MA, Muller A, Hynynen K. Ultrasound insertion loss of rat parietal bone appears to be proportional to animal mass at submegahertz frequencies. Ultrasound Med Biol. 2011;37:1930–7. doi: 10.1016/j.ultrasmedbio.2011.08.001. [DOI] [PMC free article] [PubMed] [Google Scholar]
- O'Reilly MA, Hynynen K. Blood-brain barrier: real-time feedback-controlled focused ultrasound disruption by using an acoustic emissions-based controller. Radiology. 2012;263:96–106. doi: 10.1148/radiol.11111417. [DOI] [PMC free article] [PubMed] [Google Scholar]
- Poliachik SL, Chandler WL, Mourad PD, Ollos RJ, Crum LA. Activation, aggregation and adhesion of platelets exposed to high-intensity focused ultrasound. Ultrasound Med Biol. 2001;27:1567–76. doi: 10.1016/s0301-5629(01)00444-6. [DOI] [PubMed] [Google Scholar]
- Poliachik SL, Chandler WL, Ollos RJ, Bailey MR, Crum LA. The relation between cavitation and platelet aggregation during exposure to high-intensity focused ultrasound. Ultrasound Med Biol. 2004;30:261–9. doi: 10.1016/j.ultrasmedbio.2003.10.012. [DOI] [PubMed] [Google Scholar]
- Prokop AF, Soltani A, Roy RA. Cavitational mechanisms in ultrasound-accelerated fibrinolysis. Ultrasound Med Biol. 2007;33:924–33. doi: 10.1016/j.ultrasmedbio.2006.11.022. [DOI] [PubMed] [Google Scholar]
- Pulkkinen A, Huang Y, Song J, Hynynen K. Simulations and measurements of transcranial low-frequency ultrasound therapy: skull-base heating and effective area of treatment. Phys Med Biol. 2011;56:4661–83. doi: 10.1088/0031-9155/56/15/003. [DOI] [PubMed] [Google Scholar]
- Sheikov N, McDannold N, Vykhodtseva N, Jolesz F, Hynynen K. Cellular mechanisms of the blood-brain barrier opening induced by ultrasound in presence of microbubbles. Ultrasound Med Biol. 2004;30:979–89. doi: 10.1016/j.ultrasmedbio.2004.04.010. [DOI] [PubMed] [Google Scholar]
- Shigeta K, Taniguchi N, Omoto K, Madoiwa S, Sakata Y, Mori M, Hatake K, Itoh K. In vitro platelet activation by an echo contrast agent. J Ultrasound Med. 2003;22:365–73. doi: 10.7863/jum.2003.22.4.365. [DOI] [PubMed] [Google Scholar]
- Song J, Pulkkinen A, Huang Y, Hynynen K. Investigation of standing-wave formation in a human skull for a clinical prototype of a large-aperture, transcranial MR-guided focused ultrasound (MRgFUS) phased array: an experimental and simulation study. IEEE Trans Biomed Eng. 2012;59:435–44. doi: 10.1109/TBME.2011.2174057. [DOI] [PMC free article] [PubMed] [Google Scholar]
- Sun J, Hynynen K. The potential of transskull ultrasound therapy and surgery using the maximum available skull surface area. J Acoust Soc Am. 1999;105:2519–27. doi: 10.1121/1.426863. [DOI] [PubMed] [Google Scholar]
- Tachibana K, Tachibana S. Albumin microbubble echo-contrast material as an enhancer for ultrasound accelerated thrombolysis. Circulation. 1995;92:1148–50. doi: 10.1161/01.cir.92.5.1148. [DOI] [PubMed] [Google Scholar]
- Tanter M, Thomas JL, Fink M. Focusing and steering through absorbing and aberating layers: Application to ultrasonic propagation through the skull. J. Acoust Soc Am. 1998;103:2403–10. doi: 10.1121/1.422759. [DOI] [PubMed] [Google Scholar]
- Thorsen T, Lie RT, Holmsen H. Induction of platelet aggregation in vitro by microbubbles of nitrogen. Undersea Biomed Res. 1989;16:453–64. [PubMed] [Google Scholar]
- Tung YS, Liu HL, Wu CC, Ju KC, Chen WS, Lin WL. Contrast-agent-enhanced ultrasound thermal ablation. Ultrasound Med Biol. 2006;32:1103–10. doi: 10.1016/j.ultrasmedbio.2006.04.005. [DOI] [PubMed] [Google Scholar]
- Tung YS, Vlachos F, Choi JJ, Deffieux T, Selert K, Konofagou EE. In vivo transcranial cavitation threshold detection during ultrasound-induced blood-brain barrier opening in mice. Phys Med Biol. 2010;55:6141–55. doi: 10.1088/0031-9155/55/20/007. [DOI] [PMC free article] [PubMed] [Google Scholar]
- Tung YS, Vlachos F, Feshitan JA, Borden MA, Konofagou EE. The mechanism of interaction between focused ultrasound and microbubbles in blood-brain barrier opening in mice. J Acoust Soc Am. 2011;130:3059–67. doi: 10.1121/1.3646905. [DOI] [PMC free article] [PubMed] [Google Scholar]
- Viallon M, Terraz S, Roland J, Dumont E, Becker CD, Salomir R. Observation and correction of transient cavitation-induced PRFS thermometry artifacts during radiofrequency ablation, using simultaneous ultrasound/MR imaging. Med Phys. 2010;37:1491–506. doi: 10.1118/1.3309439. [DOI] [PubMed] [Google Scholar]
- Villanueva FS, Jankowski RJ, Manaugh C, Wagner WR. Albumin microbubble adherence to human coronary endothelium: implications for assessment of endothelial function using myocardial contrast echocardiography. J Am Coll Cardiol. 1997;30:689–93. doi: 10.1016/s0735-1097(97)00197-6. [DOI] [PubMed] [Google Scholar]
- Vykhodtseva N, McDannold N, Hynynen K. Induction of apoptosis in vivo in the rabbit brain with focused ultrasound and optison. Ultrasound Med Biol. 2006;32:1923–9. doi: 10.1016/j.ultrasmedbio.2006.06.026. [DOI] [PubMed] [Google Scholar]