

Abstract
Objective
To examine cooking practices and 24-h personal and kitchen area exposures to fine particulate matter (PM2.5) and black carbon in cooks using biomass in Ghana.
Methods
Researchers administered a detailed survey to 421 households. In a sub-sample of 36 households, researchers collected 24-h integrated PM2.5 samples (personal and kitchen area); in addition, the primary cook was monitored for real-time PM2.5. All filters were also analyzed for black carbon using a multi-wavelength reflectance method. Predictors of PM2.5 exposure were analyzed, including cooking behaviors, fuel, stove and kitchen type, weather, demographic factors and other smoke sources.
Results
The majority of households cooked outdoors (55%; 231/417), used biomass (wood or charcoal) as their primary fuel (99%; 412/413), and cooked on traditional fires (77%, 323/421). In the sub-sample of 29 households with complete, valid exposure monitoring data, the 24-h integrated concentrations of PM2.5 were substantially higher in the kitchen sample (mean 446.8 μg/m3) than in the personal air sample (mean 128.5 μg/m3). Black carbon concentrations followed the same pattern such that concentrations were higher in the kitchen sample (14.5 μg/m3) than in the personal air sample (8.8 μg/m3). Spikes in real-time personal concentrations of PM2.5 accounted for the majority of exposure; the most polluted 5%, or 72 min, of the 24-h monitoring period accounted for 75% of all exposure. Two variables that had some predictive power for personal PM2.5 exposures were primary fuel type and ethnicity, while reported kerosene lantern use was associated with increased personal and kitchen area concentrations of black carbon.
Conclusion
Personal concentrations of PM2.5 exhibited considerable inter-subject variability across kitchen types (enclosed, semi-enclosed, outdoor), and can be elevated even in outdoor cooking settings. Furthermore, personal concentrations of PM2.5 were not associated with kitchen type and were not predicted by kitchen area samples; rather they were driven by spikes in PM2.5 concentrations during cooking. Personal exposures were more enriched with black carbon when compared to kitchen area samples, underscoring the need to explore other sources of incomplete combustion such as roadway emissions, charcoal production and kerosene use.
Keywords: Biomass, Cooking, Personal exposure, Black carbon, Fine particulate matter
1. Introduction
Approximately 2.5 billion people in developing countries rely on biomass fuels for their cooking and heating needs (Legros et al., 2009). These fuels—wood, animal dung, charcoal, crop residues—are typically burned in inefficient traditional stoves and result in emissions of particulate matter, carbon monoxide, oxygenated and chlorinated organics, free radicals hydrocarbons, and other harmful substances (UN, 2007; Bruce et al., 2000; Smith, 2000; WHO, 2006; Warwick and Doig, 2004; von Shirnding et al., 2002; Naeher et al., 2007). In 2010, household air pollution from solid fuels (biomass fuels and coal) constituted the second leading risk factor of disease burden in most of sub-Saharan Africa and the fourth leading risk factor globally, accounting for 3.5 million deaths and 4.5% of disability-adjusted life years (DALYs). Household air pollution from solid fuels represented the third leading risk factor (6.4% of global DALYs) among children under 5 years, and the second leading risk factor in disease burden for women globally (Lim et al., 2012). Convincing evidence links biomass burning to increased risk of acute lower respiratory infections in children and chronic obstructive pulmonary disease in adults, and epidemiologic studies have also linked biomass burning to lung cancer, asthma, tuberculosis, cardiac outcomes, cataracts, blindness, infant mortality, low weight babies and prenatal mortality (Bruce et al., 2000; Warwick and Doig, 2004; Boy et al., 2002; Ezzati and Kammen, 2002; von Shirnding et al., 2002; Smith et al., 2000; Malvalankar et al., 1991; Albalak et al., 1999, 2001).
The continued reliance on solid cooking fuels is also an important environmental concern due to deforestation and emissions of black carbon and greenhouse gases such as carbon dioxide, methane, and nitrogen dioxide (Ramanathan et al., 2007; Rehfuess et al., 2006). Black carbon, or soot, is emitted to the atmosphere from incomplete combustion of biomass and fossil fuels, and composed of fine particles of mostly elemental carbon that absorbs solar radiation thereby accelerating rising atmospheric temperatures as well as increasing snow and ice melt (Ramanathan et al., 2007; Highwood and Kinnersley, 2006; Ramanathan and Feng, 2008; Roden et al., 2006; Smith et al., 2009).
This study assessed the exposure to particulate matter and black carbon through detailed kitchen area and personal air monitoring, and related these exposures to cooking practices and behaviors in a rural area of Ghana. Although several prior studies have measured personal and kitchen area concentrations of particulate matter using a variety of methods (e.g., Ezzati et al., 2000; Dionisio et al., 2008), this study used both real-time and integrated techniques to investigate the levels and patterns of exposure in cooks who used a variety of kitchen types with regards to implied air exchange (enclosed, semi-enclosed and outdoor).
The study took place in rural central Ghana, where a significant fraction of people cook outdoors or in other well-ventilated spaces, which produce a wide range of exposures in a setting of fairly uniform fuel use and economic circumstances. The findings from the current study add to the small quantitative literature on cook-smoke exposures in sub-Saharan Africa, and lay a foundation for interventions to reduce exposures and corresponding adverse health impacts in this setting.
2. Materials and methods
The study protocol and questionnaires were approved by Columbia University Medical Center Institutional Review Boards and the Kintampo Health Research Centre’s Scientific Review Board and Institutional Ethics Committee. All study participants provided written informed consent.
2.1. Study site
The study was carried out by a joint team from Columbia University and the Kintampo Health Research Centre, one of the three health research centers of the Ghana Health Service. The team worked in the Kintampo North and South districts of the Brong Ahafo Region in central Ghana, where the Kintampo Health Research Centre maintains the Kintampo Health and Demographic Surveillance System. The Surveillance System was established in 2003 to determine and track the longitudinal dynamics of the resident population; documenting the age, sex distribution, birth rates, causes of death, household structure, water and sanitation availability and migrations (both in and out) of the defined population. As of July 2006, the resident district population was 139,510, consisting of 24,671 households; update survey rounds were held at 6-month intervals.
2.2. Study design
A cooking survey was developed for 440 households. In a subset of 36 households, an exposure survey and detailed area and personal exposure monitoring of PM2.5 and black carbon were conducted. All surveys were back translated into Twi and pre-tested for conceptual equivalence with bilingual English/Twi speakers. Data were gathered between July and December 2007 by a team of researchers from Columbia University and Kintampo Health Research Centre.
2.3. Household survey and population
A random sample of 440 households was selected. The selection procedure first randomly drew 22 villages from the 159 villages in the Kintampo Health and Demographic Surveillance System. Subsequently, 20 households were randomly selected in each village. A pre-tested and detailed questionnaire was administered by trained bilingual local field staff. The questionnaire captured kitchen, fuel and stove types, average lifetime and daily cooking time, other environmental exposures (including tobacco smoke, commercial or farm plot cooking, charcoal production, kerosene lanterns and mosquito coils), and household demographic and economic measures.
A study sensitization team visited each village and explained the study to local leaders prior to the survey implementation. A trained fieldworker administered the household questionnaire to the head of household or his/her representative. Each interview lasted less than 45 min. In the absence of the head of household or his/her representative after three consecutive household visits, no further visits were made.
2.4. Exposure assessment and population
A subset of 36 households was selected using a two-stage sampling method. Ten of the 22 villages involved in the household survey were randomly selected, then 36 households were randomly sampled within those villages using a random number generator. The selected households were equally stratified based on kitchen location (enclosed, semi-enclosed, outdoor), thus representing 12 households from each of the kitchen location strata. An “enclosed” kitchen is defined as fully enclosed, with four walls reaching up to meet a ceiling/roof; a “semi-enclosed” kitchen is partially enclosed by walls (i.e. less than four walls) or a roof only; and an “outdoor” kitchen is completely open and not surrounded by any walls and/or roof. The household head or his/her representative identified the primary adult cook of the household. Consent was obtained from the primary adult cook in each household.
In each of the 36 households, researchers administered a detailed survey both before and after exposure monitoring to capture kitchen, fuel and stove types, as well as cooking duration, behavior, weather and other smoke exposures during monitoring (including tobacco smoke, commercial cooking, charcoal production, kerosene lanterns, fish smoking and mosquito coils). While non-smoking households were given an eligibility criterion before exposure monitoring took place, no households were rejected if tobacco use was reported during the exposure monitoring period. In addition to the questionnaire data, the research team collected one integrated 24-h kitchen area sample of particulate matter (PM2.5), as well as one integrated and one real-time 24-h personal sample. The filter samples of PM2.5 and black carbon from kitchen area concentrations were collected using portable air sampling systems consisting of a Triplex stainless steel cyclone to remove particles larger than 2.5 μm in aerodynamic diameter from the air stream prior to sampling (BGI Inc., Waltham, MA, USA), and a conductive polypropylene cassette containing a 37-mm Teflon membrane filter (Gelman, Inc.). Air was pulled using a portable, battery-operated BGI air pump operating at 1.5 l/min±10%. Flow rates were checked and recorded at the beginning and end of each sampling event using a rotameter (SKC Inc.); sample durations were recorded both manually (digital watch) and directly (elapsed timer on the pumps). The area sampling equipment was housed in a weatherproof case, with tubing connected to the cyclone in a weatherproof cap made from conductive plastic. For consistency, the sampling equipment was placed at a horizontal distance of 100 cm away from the fire, and the cyclone/filter assembly was at a vertical distance of 93 cm from the ground near the breathing zone (Photo 1). In addition to the kitchen area concentrations, nine integrated 24-h ambient samples were collected outdoors for the duration of the study period to serve as background concentrations of PM2.5 and black carbon. The collection location of the ambient filters was removed from all biomass sources and provided a secure setting for multiple-day monitoring. All filter weights were adjusted using field blanks.
Photo 1.

Area air sampling system in weatherproof case during 24-h monitoring period of an outdoor kitchen.
Personal concentrations of PM2.5 were assessed using a portable air sampling system worn by the primary cook. The personal sampling system consisted of a Triplex cyclone (BGI Inc.) clipped to the participant’s clothing near her breathing zone, with an inlet tube linking the cyclone to a real-time optical aerosol monitor, the Personal Data Ram (PDR 1200, Thermo Electron Corp) that recorded PM2.5 concentrations in 60-s intervals. The PDR was followed by a Teflon filter to collect an integrated 24-h PM2.5 sample, and then by a battery operated TSI Sidepak SP530 (TSI Inc.) vacuum pump operating at 1.5 l/min±10% (Photo 2). The personal air sampling system was fitted in a pack and worn around the participant’s waist (Photo 3). The participant was informed of the importance of keeping the cyclone clipped to her clothing during the day and instructed how to detach the personal sampling pack and secure it to a provided tripod stand during bathing or sleeping times, which would keep the sampler inlet roughly 65 cm from the ground.
Photo 2.

Personal air sampling system including Triplex cyclone, Personal Data Ram, battery operated TSI Sidepak SP530, and waist pack.
Photo 3.

Personal air sampling system as worn by study participants. The Personal Data Ram and TSI Sidepak SP530 are fitted in waist pack while the Triplex cyclone remains near breathing zone.
2.5. Data quality control
Data from the household questionnaire were checked for completeness, accuracy, and consistency prior to double data entry conducted at Kintampo Health Research Centre. After sampling, real-time data from each PDR were downloaded by a Kintampo Health Research Centre technician for analysis and quality control ensuring sampling equipment had not malfunctioned and monitoring data had been successfully logged over the 24-h period. Filter cassettes were removed from the cyclone, sealed in the cassette, stored in double Ziploc bags and shipped to Columbia University, where filters were analyzed for mass (PM2.5) and black carbon. Filters were weighed pre- and post-sampling on a microbalance (Mettler UMX2) after being conditioned in a HEPA-filtered, temperature controlled (72° ± 2° F)/humidity controlled (40±2%RH) environment for at least 24 h (by cracking the Petri-slide cover) and statically discharged via a polonium source. The weighing protocol included daily use of class S calibration weights and weighing each filter until two consecutive weights agreed to within 2 μg of each other or until the individual weights were all within 2 μg of average of three consecutive weights. Pressure was recorded during both pre- and post-weighing to allow for barometric corrections. The filters were then analyzed for black carbon using a validated multi-wavelength reflectance method (Yan et al., 2011).
For both kitchen area and personal air sampling, all pertinent monitoring information (including filter numbers, monitoring duration, household number, distances of loggers from the fire, etc.) were recorded on field logs and monitoring forms.
2.6. Data analysis
Potential predictors of real-time personal and integrated kitchen air samples were analyzed, including cooking behavior, fuel, stove and kitchen ventilation characteristics (enclosed, semi-enclosed, outdoor). The field staff made careful observations of the position of the monitoring equipment and personal pack tubing after the 24-h monitoring period.
Sample sizes were too small for statistically meaningful multivariate analyses. Means and 95% confidence intervals are presented across variables for personal and kitchen area concentrations of PM2.5 and black carbon. Very few households were missing data for key variables, so no effort was made to impute missing values.
3. Results
Of the 440 randomly selected households, 421 households were contacted. All contacted households responded to the survey. All 36 households selected for the exposure survey participated in the exposure assessment.
3.1. Household survey
As shown in Table 1, the results from the household survey (n=421) show a majority (81%; 336/413) of the households surveyed used wood as their primary fuel in an open, three-stone stove (77%; 323/421), although a substantial portion of secondary fuel users used charcoal as a secondary fuel (87%, 172/197, not shown). With regards to other sources of smoke pollution, 19% (78/421) of households reported that any member smoked cigarettes in the past month, 40% (167/421) of households reported use of mosquito coils, and reported use of kerosene lanterns was ubiquitous (93%; 390/421). Some households reported proximity to trash burning or a busy road, and approximately 30% (126/421) reported producing charcoal.
Table 1.
Demographics and cooking characteristics for household survey and exposure assessment populations.
| Demographic characteristic | Household survey (n=421)a | Exposure assessment (n=29)b |
|---|---|---|
| Value ± SD | Value ± SD | |
| Age of primary cook in years | 39 ± 19 | 43 ± 11 |
| % Female as primary cook | 95 | 100 |
| Ave. time cooked/day (mins) | 185 ± 86 | 217 ± 103 |
| Ave. years cooked in lifetime (years) | 19 ± 15 | 23 ± 13 |
| Ave household size or persons cooked for (dinner) | 5.5 ± 3 | 7 ± 5 |
| Primary fuel | % | % |
| Wood | 81 | 86 |
| Charcoal | 18 | 14 |
| Kerosene | 0 | 0 |
| LPG/other | 1 | 0 |
| Stove-type | % | % |
| Traditional (3, 5 or 7)-stone | 77 | 86 |
| Clay/mud surrounded | 2 | 0 |
| Metal | 1 | 0 |
| Charcoal stove | 18 | 14 |
| Other or n/a | 2 | 0 |
| Kitchen type | % | % |
| Outdoors | 55 | 38 |
| Semi-enclosed | 28 | 38 |
| Fully enclosed | 17 | 24 |
| Tobacco use | % | % |
| Self (during monitoring) | Not asked | 4 |
| Other in household (during monitoring) | Not asked | 11 |
| Anyone in household (past month) | 19 | Not asked |
| Obtain firewood | % | % |
| Gather | 86 | 68 |
| Purchase | 10 | 0 |
| Gather and purchase | 4 | 9 |
| Other smoke exposuresc | % | % |
| Commercial cooking | 23 | 3 |
| Charcoal production | 30 | 3 |
| Cook at farm plot | 59 | 55 |
| Mosquito coil use | 40 | 7 |
| Lantern used | 93 | 66 |
Sample size varies between 366 and 421.
Sample size varies between 22 and 29.
For exposure assessment households, “other smoke exposures” pertain to 24-h monitoring period except “cook at farm plot” (ever).
For household survey, lantern use combines paraffin and kerosene; for exposure households, kerosene only. SD, standard deviation.
Forty percent (168/421) of households reported having a secondary cooking area (data not shown). Of these, 78% were semi-enclosed and 60% were reserved for use when it rains. Enclosed kitchens were largely made from thatched roofs and mud walls. A majority of households (59%; 247/421) also reported sometimes cooking at their farm plot. Cooking areas at the farm plot were nearly always fully outdoors or covered by a roof (less than 2% reported enclosed kitchens at their farm plot).
The population was diverse ethnically and culturally. Over 10 ethnic groups were sampled, and the two most prevalent ethnicities (Akan and Mo) account for just under half (47%; 198/421) of the households (data not shown). While the average household age was 24 years (SD, standard deviation±19), the average age of the main cook across households was 39 years (SD ±19). The average household size was 5.5 people (SD±3), with an average of 2.5 (SD±1.9) children under the age of 15 years, and.8 (SD±0.9) children under the age of 5 years.
Approximately 55% of primary cooks reported that children typically accompanied them while cooking; among those who were accompanied by children, the average number of children in tow was 1.6. About half of the female adults (over 18 years of age) worked in agriculture (48%), and about half of agricultural workers produced primarily for their own consumption. More than half (61%; 704/1153) of adults had not completed a primary education (responded either “no schooling” or “some primary”).
3.2. Exposure assessment
Valid 24-h real-time personal samples were obtained from 97% (35/36) of the households and 24-h integrated personal samples were obtained in 81% (29/36) of the households. For comparative analyses across personal and kitchen area samples, only households with valid integrated area, as well as real-time and integrated personal samples are used for analysis (n=29). Of the 29 households with valid air samples, 11 (38%) households were in each of the outdoor and semi-enclosed kitchen categories, while seven of the households (24%) were cooking in entirely enclosed kitchens.
One heavily loaded filter from kitchen area sampling showed an extremely poor model fit to black carbon using the multi-wavelength data and also fell far from the trend of the remaining data for PM2.5 versus black carbon; this outlier was removed from any black carbon plots and data analyses (n=28). As shown in Table 1, the participants enrolled in the exposure assessment study were all females with an average age of 43 years (SD±11), who had been cooking for an average of 23 years (SD±13). During the 24-h monitoring period, the participants cooked for an average of seven household members (including children), and for 3 h and 37 min per day. While most (86%; 25/29) of the households cooked with unprocessed biomass fuels (i.e. wood) on open fires, the remaining households used charcoal in a charcoal stove for at least some cooking tasks. A majority (68%; 15/22) of the participants gathered their own fire-wood. One cook reported smoking tobacco herself during the monitoring period, while three cooks reported someone else smoking in their household. No difference in personal and kitchen area samples was observed between households reporting tobacco use and households not reporting tobacco use.
A majority (66%) of the monitored households reported using kerosene lantern(s) during the 24-h sampling period. Whereas mean personal and kitchen area concentrations of PM2.5 and black carbon did not differ for the households using kerosene lamps during the sampling and those that did not, households reporting kerosene use had consistently higher personal and kitchen area concentrations of black carbon (~ 4 μg/m3 higher). Fig. 1 illustrates the comparison of black carbon exposures as a function of PM2.5 level indicating that both personal and kitchen samples were similarly enriched by black carbon when kerosene use was reported.
Fig. 1.

Black carbon concentrations for personal and area samples across households reporting kerosene lantern use and households reporting no kerosene lantern use during exposure monitoring period. A fractional polynomial fit was used to allow a semi-quantitative comparison of black carbon exposures as a function of PM2.5 level indicating that both personal and kitchen samples were similarly enriched by black carbon when kerosene use was reported.
There was no difference in mean personal exposures of PM2.5 and black carbon between women who reported spending time on the farm during monitoring and women who did not (data not shown). Only two households (~7%; 2/29) reported using mosquito coils during the monitoring period, even though the larger survey suggested much wider use. Mean personal concentrations of PM2.5 and black carbon in these two households did not differ from households that did not report the use of mosquito coils. Similarly, there were no differences in mean personal concentrations of PM2.5 and black carbon in households reporting rain compared to households reporting no rain during the monitoring period.
As shown in Table 2, the ambient/background measurements resulted in a mean PM2.5 concentration of 20 μg/m3 (95% CI, 12.1–27.9) and a mean black carbon concentration of 2.0 μg/m3 (95% CI, 1.1–2.9).
Table 2.
Summary statistics for kitchen area and personal exposure (integrated and real-time) black carbon and PM2.5 concentrations.
| Sample type | n | Black carbon (μg/m3)
|
PM2.5 (μg/m3)
|
||||
|---|---|---|---|---|---|---|---|
| Mean (95% CI) | Median | Range | Mean (95% CI) | Median | Range | ||
| Ambient | 9 | 2.0 (1.1, 2.9) | 1.7 | 0.7–4.1 | 20 (12.1, 27.9) | 20.8 | 4.1–33.2 |
| Kitchen area | 29a | 14.5 (12.0, 16.9) | 14.7 | 2.8–29.4 | 446.8 (297.8, 595.7) | 329.4 | 28.3–1761.2 |
| Personal (integrated) | 29 | 8.8 (7.4, 10.3) | 8.7 | 1.9–18.2 | 128.5 (100.0, 156.9) | 121.6 | 16.6–364.6 |
| Personal (real-time) | 29 | N/A | N/A | N/A | 208 (158, 259) | 180 | 30–618 |
Due to removal of one sample with poor model fit after application of multi-wavelength reflectance method (Yan et al., 2011), n=x−1 for “Kitchen Area” black carbon concentrations.
Regarding personal versus kitchen area concentrations of PM2.5 (Table 2), the mean personal exposure to biomass smoke as measured by the integrated average 24-h PM2.5 sampling (128.5 μg/m3, 95% CI, 100.0–156.9) was lower than the integrated mean concentrations of PM2.5 in the kitchen area (446.8 μg/m3; 95% CI, 297.8–595.7). The personal concentration of PM2.5 showed considerable between-subject variability and spanned a range (16.6–364.6 μg/m3) that is similar to the lower end of concentrations reported in past studies (e.g. Albalak et al., 2001; Dionisio et al., 2008; Ezzati et al., 2000; Painschab et al., 2013; Siddiqui et al., 2009); however, the mean personal concentration of PM2.5 (128.5 μg/m3) for this small Ghanaian cohort is somewhat lower than the mean 24-h personal exposure (266 μg/m3) reported in a subset of the RESPIRE cohort in Guatemala (McCracken et al., 2011).
We also observed that mean personal concentrations of black carbon were lower than matched kitchen area samples (8.8 μg/m3; 95% CI, 7.4–10.3 and 14.5 μg/m3; 95% CI, 12.0–16.9, respectively). There was no correlation between the personal and kitchen area concentrations of black carbon.
Results for kitchen area concentrations of PM2.5 across kitchen types (Table 3.1) showed that mean concentrations did not differ by cooking location (outdoor kitchen mean of 316.2 μg/m3; 95% CI, 194.7–437.7; enclosed kitchen mean of 474.9 μg/m3; 95% CI, 117.2–832.7; and semi-enclosed kitchen mean of 559.4 μg/m3; 95% CI, 208.0–910.7). Kitchen area concentrations of black carbon also did not differ across kitchen types. Similarly, personal concentrations of PM2.5 and black carbon across kitchen types did not differ by cooking location.
Table 3.
Mean PM2.5 and black carbon concentrations for kitchen area and personal samples by kitchen type (3.1), fuel type (3.2), and ethnic group (3.3).
| Sample type | PM2.5 (μg/m3) mean (95% CI)
|
Black carbon (μg/m3) mean (95% CI)
|
% Black carbon of PM2.5
|
||||
|---|---|---|---|---|---|---|---|
| 3.1 Kitchen type | Personal (integrated) | Kitchen area | Personal (integrated) | Kitchen area | Personal (integrated) | Kitchen area | n |
| Enclosed | 106.5 [69.5, 143.4] | 474.9 [117.2, 832.7] | 8.0 [5.3, 10.7] | 13.8 [7.2, 20.5] | 7.5% | 2.9% | 7 |
| Semi-enclosed | 95.2 [69.5, 120.9] | 559.4 [208.0, 910.7] | 7.2 [5.3, 9.0] | 15.6 [10.6, 20.6] | 7.6% | 2.8% | 11 |
| Outdoor | 175.7 [111.2, 240.3] | 316.2 [194.7, 437.7] | 11.0 [8.0, 14.0] | 13.7 [10.2, 17.2] | 6.3% | 4.3% | 11a |
| 3.2 Primary fuel | Personal (integrated) | Kitchen area | Personal (integrated) | Kitchen area | Personal (integrated) | Kitchen area | n |
| Wood | 141.9 [112.5, 171.3] | 507.8 [347.7, 667.9] | 9.7 [8.4, 11.1] | 16.2 [14.0, 18.3] | 6.8% | 3.2% | 25a |
| Charcoal | 44.6 [1.8, 87.4] | 65.2 [−2.4, 132.7] | 3.2 [0.6, 5.8] | 4.3 [1.6, 7.0] | 7.2% | 6.6% | 4 |
| 3.3 Ethnicity | Personal (integrated) | Kitchen area | Personal (integrated) | Kitchen area | n | ||
| Akan (Bono, Ashanti, Fanti, etc.) | 77.0 [56.3, 97.6] | 352.3 [140.8, 563.8] | 6.3 [4.7, 7.9] | 14.1 [9.0, 19.3] | 11 | ||
| All other | 159.9 [121.7, 198.1] | 504.5 [290.6, 718.3] | 10.4 [8.5, 12.2] | 14.7 [11.8, 17.6] | 18a | ||
Due to removal of one sample with poor model fit after application of multi-wavelength reflectance method (Yan et al., 2011), n=x−1 for “Kitchen Area” black carbon concentrations.
Households that report cooking with charcoal (and charcoal stoves) as their primary fuel had lower mean personal and kitchen area concentrations of PM2.5 when compared to those cooking with wood (Table 3.2) (personal mean of 141.9 μg/m3; 95% CI 112.5–171.3 for wood, and 44.6 μg/m3; 95% CI 1.8–87.4 for charcoal; kitchen area mean of 507.8 μg/m3; 95% CI 347.7–667.9 for wood, and 65.2 μg/m3; 95% CI −2.4 to 132.7 for charcoal). Similarly, both mean personal and kitchen area concentrations of black carbon in households cooking with charcoal fuel were lower when compared to households using wood fuel and traditional fires (personal mean of 9.7 μg/m3; 95% CI 8.4–11.1 for wood, and 3.2 μg/m3; 95% CI 0.6–5.8 for charcoal; kitchen area mean of 16.2 μg/m3; 95% CI 14.0–18.3 for wood, and 4.3 μg/m3; 95% CI 1.6–7.0 for charcoal).
Across kitchen and fuel types, the black carbon fraction of PM2.5 (black carbon/PM2.5) was higher in the personal exposure samples compared to the kitchen area concentrations (Table 3.1 and 3.2). The black carbon fraction across kitchen types constituted between 6.3% and 7.6% of the personal samples and 2.8% and 4.3% in the kitchen area samples (Table 3.1). Between the two fuel types, the difference in the black carbon fraction was greatest between the personal and kitchen area samples for households using wood (6.8% and 3.2%, respectively) while both personal and kitchen area samples for charcoal users were highly enriched with black carbon (7.2% and 6.6%, respectively, Table 3.2). The ambient samples had the highest black carbon fraction of PM2.5 at 10%.
Across ethnicities, we observed lower mean personal concentrations of PM2.5 and black carbon in the largest ethnic group (Akan, n=11) compared to all other ethnic groups (n=18) (PM2.5 personal mean of 77.0 μg/m3; 95% CI 56.3–97.6 for Akan, and 159.9 μg/m3; 95% CI 121.7–198.1 for all other ethnic groups; and black carbon personal mean of 6.3 μg/m3; 95% CI 4.7–7.9 for Akan, and 10.4 μg/m3; 95% CI 8.5–12.2 for all other ethnic groups). There was no difference observed in mean kitchen area concentrations of PM2.5 and black carbon between ethnicities, suggesting that behavior may mediate exposure.
Data supported a good correlation between PM2.5 and black carbon concentrations for both kitchen area and personal samples (Spearman rho=0.9 for kitchen area concentrations, p<0.0000, and Spearman rho=0.79, p<0.0000 for personal concentrations).
Inspection of the real-time personal data indicated prominent spikes in PM2.5 concentrations corresponding to cooking events superimposed on a very low background. Fig. 3 illustrates 24-h real-time personal PM2.5 concentrations in nine randomly selected households across the three kitchen types. All households reported using wood during the monitoring period. The panels of real-time concentrations of PM2.5 are intended for qualitative, not analytical purposes. Overall, spikes in PM2.5 concentrations accounted for the majority of exposure. When stripped of observations above the 95th percentile, the mean exposure based on the real-time data was only 56 μg/m3 (compared to 208 μg/m3 in the full data).
Fig. 3.
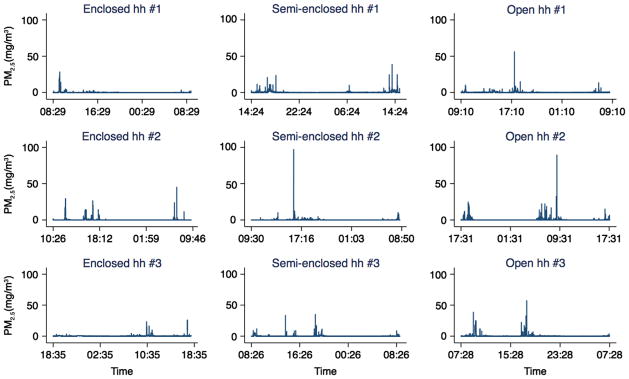
Panel of 24-h real-time PM2.5 concentrations in nine households stratified by kitchen type (enclosed, semi-enclosed, outdoor/open).
Although the Personal Data Ram real-time measurement had a positive bias of 55% higher values on average than the integrated personal exposure measurement, the 24-h PM2.5 means were highly correlated across the real-time and integrated methods, with a Spearman correlation of rho=0.9 (p<0.00001) (Fig. 2). Nephelometers are known to have different sensitivities to different types/sources of particulate matter due to the refractive index of specific sources (Karagulian et al., 2012; Liu et al., 2002; Xue et al., 2009). The nephelometer response may be corrected through division by the ratio of the gravimetric net filter weight, which averages the nephelometer reading over the duration of sample collection, and allows one to correct the nephelometer response for the average type of material collected onto the filter. In this pilot study, the correlation between the net gravimetric filter and the average real-time nephelometer data indicated a correction factor of 0.625 (the inverse of the slope of the best fit line in Fig. 2). This correction factor should be characteristic for the PDR 1200 for wood smoke and crop residue used in Ghana.
Fig. 2.

Correlation between real-time and integrated measurements of PM2.5 concentrations (slope=1.6, Spearman rho=0.9, p<0.00001; n=29).
4. Discussion
Data from this cross-sectional survey demonstrate widespread cooking with wood across a variety of largely well-ventilated kitchen types in rural Ghana, and underscore the importance of characterizing personal exposures to cook smoke for future health assessment. The results of this study point to an important intermediate range of exposures critical in determining biomass exposure and health response relationships, as well as noteworthy potential determinants of biomass exposure. If exposure to biomass smoke is meaningfully affected by behavior, this could constitute a critical factor in the design and implementation of interventions and educational campaigns to alleviate exposures to biomass smoke in rural Ghana.
Personal samples had overall lower mean concentrations of PM2.5 than kitchen area samples reflective of less time exposed to the fire emissions overall, while personal samples contained a higher black carbon fraction of the PM2.5. This enrichment of personal samples relative to the kitchen samples is consistent with the possibility of other, non-cooking combustion sources of personal exposure such as kerosene lamps and roadway traffic and further reinforces the importance of personal sampling to understand total exposure.
The mean personal exposure levels of both PM2.5 and black carbon are all between the mean levels seen for the kitchen sample and the ambient samples which had the highest black carbon fraction of PM2.5, suggesting a simple two source mixing model could be used. A crude mixing ratio approach for PM2.5 would suggest that the personal sample is made up of 75% ambient (20 μg/m3) and 25% kitchen area exposures (446.8 μg/m3). Application of this mixing ratio with the black carbon concentrations for ambient (2 μg/m3) and kitchen area (14.5 μg/m3) would suggest a personal exposure level to black carbon of 5.1 μg/m3, whereas the actual mean personal exposure level of black carbon measured was 8.8 μg/m3. This discrepancy suggests the presence of other source(s) of enriched black carbon such as kerosene lamps, emissions which are composed of nearly pure black carbon (i.e. mean black carbon/PM2.5 =0.95) (Lam et al., 2012a). Combustion of kerosene fuels for lighting and cooking is widespread in developing countries, and limited evidence shows emissions may impair lung function, exacerbate asthma, increase infectious illness (e.g. tuberculosis), cataract and cancer risks (Lam et al., 2012b). Future investigations into the PM2.5 composition (elemental and/or trace organics) should help to elucidate other alternative sources and scenarios.
As expected since charcoal burns cleaner than wood fuel, using charcoal and a charcoal stove versus wood on an open/outdoor stove decreases both kitchen area and personal concentrations of PM2.5 and black carbon. The observed differences across ethnic groups were present for personal exposures but not for kitchen area concentrations, further suggesting that behavior mediates exposure. While a larger sample size is needed to confirm these observations, user behavior could constitute a critical factor in the design and implementation of interventions to alleviate these exposures. Furthermore, ethnicity, as a proxy for a host of social and economic factors, may well be correlated with other plausible determinants of exposure.
Our real-time results point to the fact that short-term periods of elevated concentrations or spikes in PM2.5 concentrations constitute a substantial proportion of daily exposure. Our data indicate that mitigating the upper 1–5% of the PM2.5 concentration distribution (and similarly 1–5% of the time of exposure) would reduce personal mean exposure by 49–75%. Other studies have noted that peaks in particulate matter concentrations may have important implications for health (Dionisio et al., 2008; Dasgupta et al., 2006).
The sample size in the exposure assessment study was quite small and therefore we can only note that these are interesting results worthy of further study. In addition, while size of household, number of people cooked for, cooking duration, kitchen type and other sources such as kerosene, charcoal production and proximity to roadway had low or no predictive power, these and other potential determinants of personal exposure, such as type of foods cooked, need to be further examined with a larger sample size. Aside from the small sample size, which hampers rigorous analyses and extrapolation of results, another weakness of the study is the short duration of sampling thereby limiting our ability to characterize long-term exposures, due to high variability within households.
In this study, we demonstrated the feasibility of successful implementation and use of portable personal air monitoring systems measuring integrated and real-time PM2.5 and integrated black carbon concentrations over 24-h periods in rural villages of Ghana. The correlation between mean concentrations of PM2.5 measured via integrated and real-time sampling suggests that integrated measurements are a valid—as well as less costly, less invasive and less time-consuming—proxy for a 24-h mean. Furthermore, our findings underscore that kitchen area monitoring is not advisable as a proxy for personal air sampling of black carbon and PM2.5 concentrations.
Generally, a reduction in particulate matter emissions, especially black carbon, from household biomass combustion is of critical importance not only in improving health and air quality for millions of people in developing countries, but also in mitigating regional and global climate change (Smith et al., 2009; Venkataraman et al., 2005; Lam et al., 2012a). Black carbon is estimated to be the second or third largest warming agent after carbon dioxide (and methane) in terms of direct radiative forcing, a metric used to compare the strength of greenhouse pollutants (Pokhrel et al., 2010; Lam et al., 2012a; Forster et al., 2007; Ramanathan and Feng, 2008; Sato et al., 2003; Ramanathan and Carmichael, 2008; Jacobson, 2001; Ramanathan and Xu, 2010). Since the major anthropogenic sources of atmospheric black carbon is household combustion of biomass and coal, and black carbon is regionally distributed with a short atmospheric lifetime of days to weeks (unlike CO2), geographically targeted reduction strategies present a low-risk, cost-effective and high-reward option in climate change mitigation (Smith et al., 2009; Ramanathan and Xu, 2010; Wallack and Ramanathan, 2009; Molina et al., 2009). Some estimates suggest reducing black carbon by 50% through the use of cleaner technologies could offset 10–20 years of global warming from CO2 (Wallack and Ramanathan, 2009), and that replacing traditional cooking fires with clean-burning stoves could reduce climate warming from black carbon by 70–80% in southern Asia (Ramanathan and Carmichael, 2008).
Thus, regional and national policies aimed at reducing particulate matter and black carbon through improving local cooking and lighting technologies are an effective strategy with far-reaching health, air quality and climate benefits and implications. The data from this study contribute to the international literature and inform such critical international mitigation strategies.
Acknowledgments
Work was supported by NIH 5P30 ES009089 and by the Earth Institute at Columbia University; additional support was provided by NIH 5R01 ES019547. We thank the study participants for their valuable time and hospitality, Thomas Protus for his innovative technical design, and Dr. Regina Santella.
Footnotes
Human subjects study approval
The study protocol and questionnaires were approved by Columbia University Medical Center Institutional Review Boards and the Kintampo Health Research Centre Scientific Review Board and Institutional Ethics Committee. All study participants provided written informed consent.
References
- Albalak R, Bruce N, McCracken JP, Smith KR, De Gallardo T. Indoor respirable particulate matter concentrations from an open fire, improved cookstove, and LPG/open fire combination in a rural Guatemalan community. Environmental Science and Technology. 2001;35 (13):2650–2655. doi: 10.1021/es001940m. [DOI] [PubMed] [Google Scholar]
- Albalak R, Frisancho AR, Keeler GJ. Domestic biomass fuel combustion and chronic bronchitis in two rural Bolivian villages. Thorax. 1999;54 (11):1004–1008. doi: 10.1136/thx.54.11.1004. [DOI] [PMC free article] [PubMed] [Google Scholar]
- Boy E, Bruce N, Delgado H. Birth weight and exposure to kitchen wood smoke during pregnancy in rural Guatemala. Environmental Health Perspectives. 2002;110 (1):109–114. doi: 10.1289/ehp.02110109. [DOI] [PMC free article] [PubMed] [Google Scholar]
- Bruce N, Perez-Padilla R, Albalak R. Indoor air pollution in developing countries: a major environmental and public health challenge. Bulletin of the World Health Organization. 2000;78 (9):1078–1092. [PMC free article] [PubMed] [Google Scholar]
- Dasgupta S, Huq M, Khaliquzzaman M, Pandey K, Wheeler D. Indoor air quality for poor families: new evidence from Bangladesh. Indoor Air. 2006;16 (6):426–444. doi: 10.1111/j.1600-0668.2006.00436.x. [DOI] [PubMed] [Google Scholar]
- Dionisio KL, Howie S, Fornace KM, Chimah O, Adegbola RA, Ezzati M. Measuring the exposure of infants and children to indoor air pollution from biomass fuels in The Gambia. Indoor Air. 2008;18 (4):317–327. doi: 10.1111/j.1600-0668.2008.00533.x. [DOI] [PubMed] [Google Scholar]
- Ezzati M, Saleh H, Kammen DM. The contributions of emissions and spatial microenvironments to exposure to indoor air pollution from biomass combustion in Kenya. Environmental Health Perspectives. 2000;108:833–839. doi: 10.1289/ehp.00108833. [DOI] [PMC free article] [PubMed] [Google Scholar]
- Ezzati M, Kammen DM. The health impacts of exposure to indoor air pollution from solid fuels in developing countries: knowledge, gaps, and data needs. Environmental Health Perspectives. 2002;110 (11):1057–1068. doi: 10.1289/ehp.021101057. [DOI] [PMC free article] [PubMed] [Google Scholar]
- Forster P, Ramaswamy V, Artaxo P, Berntsen T, Betts R, Fahey DW, Haywood J, Lean J, Lowe DC, Myhre G, Nganga J, Prinn R, Raga G, Schulz M, Van Dorland R. Changes in atmospheric constituents and in radiative forcing. In: Solomon S, Qin D, Manning M, Chen Z, Marquis M, Averyt KB, Tignor M, Miller HL, editors. Climate Change 2007: The Physical Science Basis. Contribution of Working Group I to the Fourth Assessment Report of the Intergovernmental Panel on Climate Change. Cambridge University Press; Cambridge, United Kingdom, New York, NY, USA: 2007. [Google Scholar]
- Highwood EJ, Kinnersley RP. When smoke gets in our eyes: the multiple impacts of atmospheric black carbon on climate, air quality and health. Environment International. 2006;32 (4):560–566. doi: 10.1016/j.envint.2005.12.003. [DOI] [PubMed] [Google Scholar]
- Jacobson MZ. Strong radiative heating due to the mixing state of black carbon in atmospheric aerosols. Nature. 2001;409 (6821):695–697. doi: 10.1038/35055518. [DOI] [PubMed] [Google Scholar]
- Karagulian F, Belis CA, Lagler F, Barbiere M, Gerboles M. Evaluation of a portable nephelometer against the Tapered Element Oscillating Microbalance method for monitoring PM(2.5) Journal of Environmental Monitoring. 2012;14(August 8):2145–2153. doi: 10.1039/c2em30099k. (Epub 2012 Jul 6) [DOI] [PubMed] [Google Scholar]
- Lam NL, Chen Y, Weyant C, Venkataraman C, Sadavarte P, Johnson MA, Smith KR, Brem BT, Arineitwe J, Ellis JE, Bond TC. Household light makes global heat: high black carbon emissions from kerosene wick lamps. Environmental Science and Technology. 2012a;18 (46):13531–13538. doi: 10.1021/es302697h. (24) [DOI] [PMC free article] [PubMed] [Google Scholar]
- Lam NL, Smith KR, Gauthier A, Bates MN. Kerosene: a review of household uses and their hazards in low- and middle-income countries. Journal of Toxicology and Environmental Health Part B: Critical Reviews. 2012b;15 (6):396–432. doi: 10.1080/10937404.2012.710134. [DOI] [PMC free article] [PubMed] [Google Scholar]
- Legros G, Havet I, Bruce N, Bonjour S. The Energy Access Situation in Developing Countries: A Review Focusing on the Least Developed Countries and Sub-Saharan Africa. United Nations Development Programme and World Health Organization; New York: 2009. [Google Scholar]
- Lim SS, Vos T, Flaxman AD, Danaei G, et al. A comparative risk assessment of burden of disease and injury attributable to 67 risk factors and risk factor clusters in 21 regions, 1990–2010: a systematic analysis for the Global Burden of Disease Study 2010. The Lancet. 2012;380 (9859):2224–2260. doi: 10.1016/S0140-6736(12)61766-8. [DOI] [PMC free article] [PubMed] [Google Scholar]
- Liu LJ, Slaughter JC, Larson TV. Comparison of light scattering devices and impactors for particulate measurements in indoor, outdoor, and personal environments. Environmental Science and Technology. 2002;36(July 1 13):2977–2986. doi: 10.1021/es0112644. [DOI] [PubMed] [Google Scholar]
- Malvalankar D, Tivedi C, Gray R. Levels and risk factors for perinatal mortality in Ahmedabad. India Bulletin of World Health Organization. 1991;69 (4):435–442. [PMC free article] [PubMed] [Google Scholar]
- McCracken J, Smith KR, Stone P, Díaz A, Arana B, Schwartz J. Intervention to lower household wood smoke exposure in Guatemala reduces ST-segment depression on electrocardiograms. Environmental Health Perspectives. 2011;119 (11):1562–1568. doi: 10.1289/ehp.1002834. [DOI] [PMC free article] [PubMed] [Google Scholar]
- Molina M, Zaelke D, Sarma KM, Andersen SO, Ramanathan V, Kaniaru D. Reducing abrupt climate change risk using the Montreal Protocol and other regulatory actions to complement cuts in CO2 emissions. Proceedings of the National Academy of Sciences of the United States of America. 2009;106 (49):20616–20621. doi: 10.1073/pnas.0902568106. [DOI] [PMC free article] [PubMed] [Google Scholar]
- Naeher LP, Brauer M, Lipsett M, Zelikoff JT, Simpson CD, Koenig JQ, et al. Woodsmoke health effects: a review. Inhalation Toxicology. 2007;19 (1):67–106. doi: 10.1080/08958370600985875. [DOI] [PubMed] [Google Scholar]
- Painschab MS, Davila-Roman VG, Gilman RH, Vasquez-Villar AD, Pollard SL, Wise RA, Miranda JJ, Checkley W CRONICAS Cohort Study Group. Chronic exposure to biomass fuel is associated with increased carotid artery intima-media thickness and a higher prevalence of atherosclerotic plaque. Heart. 2013;99 (14):984–991. doi: 10.1136/heartjnl-2012-303440. [DOI] [PMC free article] [PubMed] [Google Scholar]
- Pokhrel AK, Bates MN, Verma SC, Joshi HS, Sreeramareddy CT, Smith KR. Tuberculosis and indoor biomass and kerosene use in Nepal: a case–control study. Environmental Health Perspectives. 2010;118 (4):558–564. doi: 10.1289/ehp.0901032. [DOI] [PMC free article] [PubMed] [Google Scholar]
- Ramanathan V, Ramana MV, Roberts G, Kim D, Corrigan C, Chung C, et al. Warming trends in Asia amplified by brown cloud solar absorption. Nature. 2007;448 (7153):575–578. doi: 10.1038/nature06019. [DOI] [PubMed] [Google Scholar]
- Ramanathan V, Carmichael G. Global and regional climate changes due to black carbon. Nature Geoscience. 2008;1 (4):221–227. [Google Scholar]
- Ramanathan V, Feng Y. On avoiding dangerous anthropogenic interference with the climate system: formidable challenges ahead. Proceedings of the National Academy of Sciences of the United States of America. 2008;105 (38):14245–14250. doi: 10.1073/pnas.0803838105. [DOI] [PMC free article] [PubMed] [Google Scholar]
- Ramanathan V, Xu Y. The Copenhagen Accord for limiting global warming: criteria, constraints, and available avenues. Proceedings of the National Academy of Sciences of the United States of America. 2010;107 (18):8055–8062. doi: 10.1073/pnas.1002293107. [DOI] [PMC free article] [PubMed] [Google Scholar]
- Rehfuess E, Mehta S, Prüss-Ustün A. Assessing household solid fuel use: multiple implications for the millennium development goals. Environmental Health Perspectives. 2006;114 (3):373–378. doi: 10.1289/ehp.8603. [DOI] [PMC free article] [PubMed] [Google Scholar]
- Roden C, Bond T, Conway S, Pinel A. Emission factors and real-time optical properties of particles emitted from traditional wood burning cook-stoves. Environmental Science and Technology. 2006;40(21):6750–6757. doi: 10.1021/es052080i. [DOI] [PubMed] [Google Scholar]
- Sato M, Hansen J, Koch D, Lacis A, Ruedy R, Dubovik O, et al. Global atmospheric black carbon inferred from AERONET. Proceedings of the National Academy of Sciences of the United States of America. 2003;100 (11):6319–6324. doi: 10.1073/pnas.0731897100. [DOI] [PMC free article] [PubMed] [Google Scholar]
- Siddiqui AR, Lee K, Bennett D, Yang X, Brown KH, Bhutta ZA, Gold EB. Indoor carbon monoxide and PM2.5 concentrations by cooking fuels in Pakistan. Indoor Air. 2009;19 (1):75–82. doi: 10.1111/j.1600-0668.2008.00563.x. [DOI] [PubMed] [Google Scholar]
- Smith KR. National burden of diseases in India from indoor air pollution. Proceedings of the National Academy of Sciences of the United States of America. 2000;97 (24):13286–13293. doi: 10.1073/pnas.97.24.13286. [DOI] [PMC free article] [PubMed] [Google Scholar]
- Smith KR, Samet JM, Romieu I, Bruce N. Indoor air pollution in developing countries and acute lower respiratory infections in children. Thorax. 2000;55 (6):518–532. doi: 10.1136/thorax.55.6.518. [DOI] [PMC free article] [PubMed] [Google Scholar]
- Smith KR, Jerrett M, Anderson HR, Burnett RT, Stone V, Derwent R, et al. Public health benefits of strategies to reduce greenhouse-gas emissions: health implications of short-lived greenhouse pollutants. Lancet. 2009;374 (9707):2091–2103. doi: 10.1016/S0140-6736(09)61716-5. [DOI] [PMC free article] [PubMed] [Google Scholar]
- United Nations (UN); Affairs UNoEaS, editor. Millennium Development Goals Report 2007. New York, United Nations: 2007. [Google Scholar]
- Venkataraman C, Habib G, Eiguren-Fernandez A, Miguel AH, Friedlander SK. Residential biofuels in South Asia: carbonaceous aerosol emissions and climate impacts. Science. 2005;307 (5714):1454–1456. doi: 10.1126/science.1104359. [DOI] [PubMed] [Google Scholar]
- von Shirnding Y, Bruce N, Smith KR, Ballard-Tremeer G, Ezzati M, Lvovsky K. Paper prepared for the Commission on Macroeconomics and Health. World Health Organization; Geneva: 2002. Addressing the impact of household energy and indoor air pollution on the health of the poor: implications for policy action and intervention Measures. [Google Scholar]
- Wallack V, Ramanathan V. The other climate changers: Why black carbon and ozone also matter. Foreign Affairs. 2009;88:105–113. [Google Scholar]
- Warwick H, Doig A. Indoor Air Pollution in Developing Countries. ITDG; London: 2004. Smoke—The Killer in the Kitchen. 2005. [Google Scholar]
- World Health Organization. Fuel For Life: Household Energy and Health. Geneva: 2006. [Google Scholar]
- Xue H, Khalizov AF, Wang L, Zheng J, Zhang R. Effects of dicarboxylic acid coating on the optical properties of soot. Physical Chemistry Chemical Physics. 2009;11 (36):7869–7875. doi: 10.1039/b904129j. (Epub 2009 Jun 10) [DOI] [PubMed] [Google Scholar]
- Yan B, Kennedy D, Miller RL, Cowin JP, Jung KH, Perzanowski M, Balletta M, Perera FP, Kinney PL, Chillrud SN. Validating a nondestructive optical method for apportioning colored particulate matter into black carbon and additional components. Atmospheric Environment. 2011;45 (39):7478–7486. doi: 10.1016/j.atmosenv.2011.01.044. [DOI] [PMC free article] [PubMed] [Google Scholar]