Abstract
Herb–drug interaction predictions remain challenging. Physiologically based pharmacokinetic (PBPK) modeling was used to improve prediction accuracy of potential herb–drug interactions using the semipurified milk thistle preparation, silibinin, as an exemplar herbal product. Interactions between silibinin constituents and the probe substrates warfarin (CYP2C9) and midazolam (CYP3A) were simulated. A low silibinin dose (160 mg/day × 14 days) was predicted to increase midazolam area under the curve (AUC) by 1%, which was corroborated with external data; a higher dose (1,650 mg/day × 7 days) was predicted to increase midazolam and (S)-warfarin AUC by 5% and 4%, respectively. A proof-of-concept clinical study confirmed minimal interaction between high-dose silibinin and both midazolam and (S)-warfarin (9 and 13% increase in AUC, respectively). Unexpectedly, (R)-warfarin AUC decreased (by 15%), but this is unlikely to be clinically important. Application of this PBPK modeling framework to other herb–drug interactions could facilitate development of guidelines for quantitative prediction of clinically relevant interactions.
Herbal products represent an ever-increasing component of Western pharmacotherapy due in part to the perception that “natural” equates with safety. Current regulatory oversight of herbal products in many Western countries, including the United States, does not include evaluation of drug interaction liability prior to marketing. Consequently, systematic approaches for quantitative prediction of both the magnitude and likelihood of herb–drug interactions are nonexistent.
Drug interaction liability assessment of herbal products is more challenging than for conventional drugs because unlike most drug products, herbal products typically are mixtures of bioactive constituents that vary substantially between preparations.1,2,3 Compounding this complexity is the often scant knowledge of specific causative constituents or systemic exposure of such constituents. Due to incomplete absorption and extensive presystemic clearance, herbal product constituents may reach sufficient concentrations in the intestine and liver to inhibit only first-pass extraction of sensitive substrates.4 Consequently, traditional (static) prediction approaches frequently do not translate to the clinical setting for herb–drug interactions.
Recent drug–drug interaction guidelines suggest dynamic modeling and simulation approaches to predict complex interactions.5,6 Extension of this approach to herb–drug interactions is a logical step to facilitate prospective evaluation of these interactions. As with drug–drug interactions,7,8 physiologically based pharmacokinetic (PBPK) modeling may be used to improve in vitro to in vivo extrapolation of herb–drug interactions. Well-characterized herbal products are needed to develop a quantitative framework.
Milk thistle preparations are top-ten selling herbal products in the United States.9 The crude extract, silymarin, contains at least seven flavonolignans and one flavonoid.10 The semipurified extract, silibinin, contains roughly a 1:1 mixture of the flavonolignans silybin A and silybin B and represents an exemplar herbal product for initial model development. First, silybin A and silybin B have been purified in quantities sufficient to recover requisite in vitro parameters.11,12 Second, in vitro studies have demonstrated both reversible and mechanism-based inhibition of the key drug metabolizing enzymes CYP2C913,14,15 and CYP3A4.13,14,16 Third, in vitro to in vivo extrapolation has been inconsistent.17,18,19 Based on these observations, the objective of this work was to advance the mechanistic understanding of this herb–drug interaction using PBPK modeling and simulation with warfarin and midazolam as probe substrates. The models were evaluated through a proof-of-concept clinical study in healthy volunteers. Results could help develop guidelines for prospective evaluation of herb–drug interaction liability.
Results
Modeling and simulation
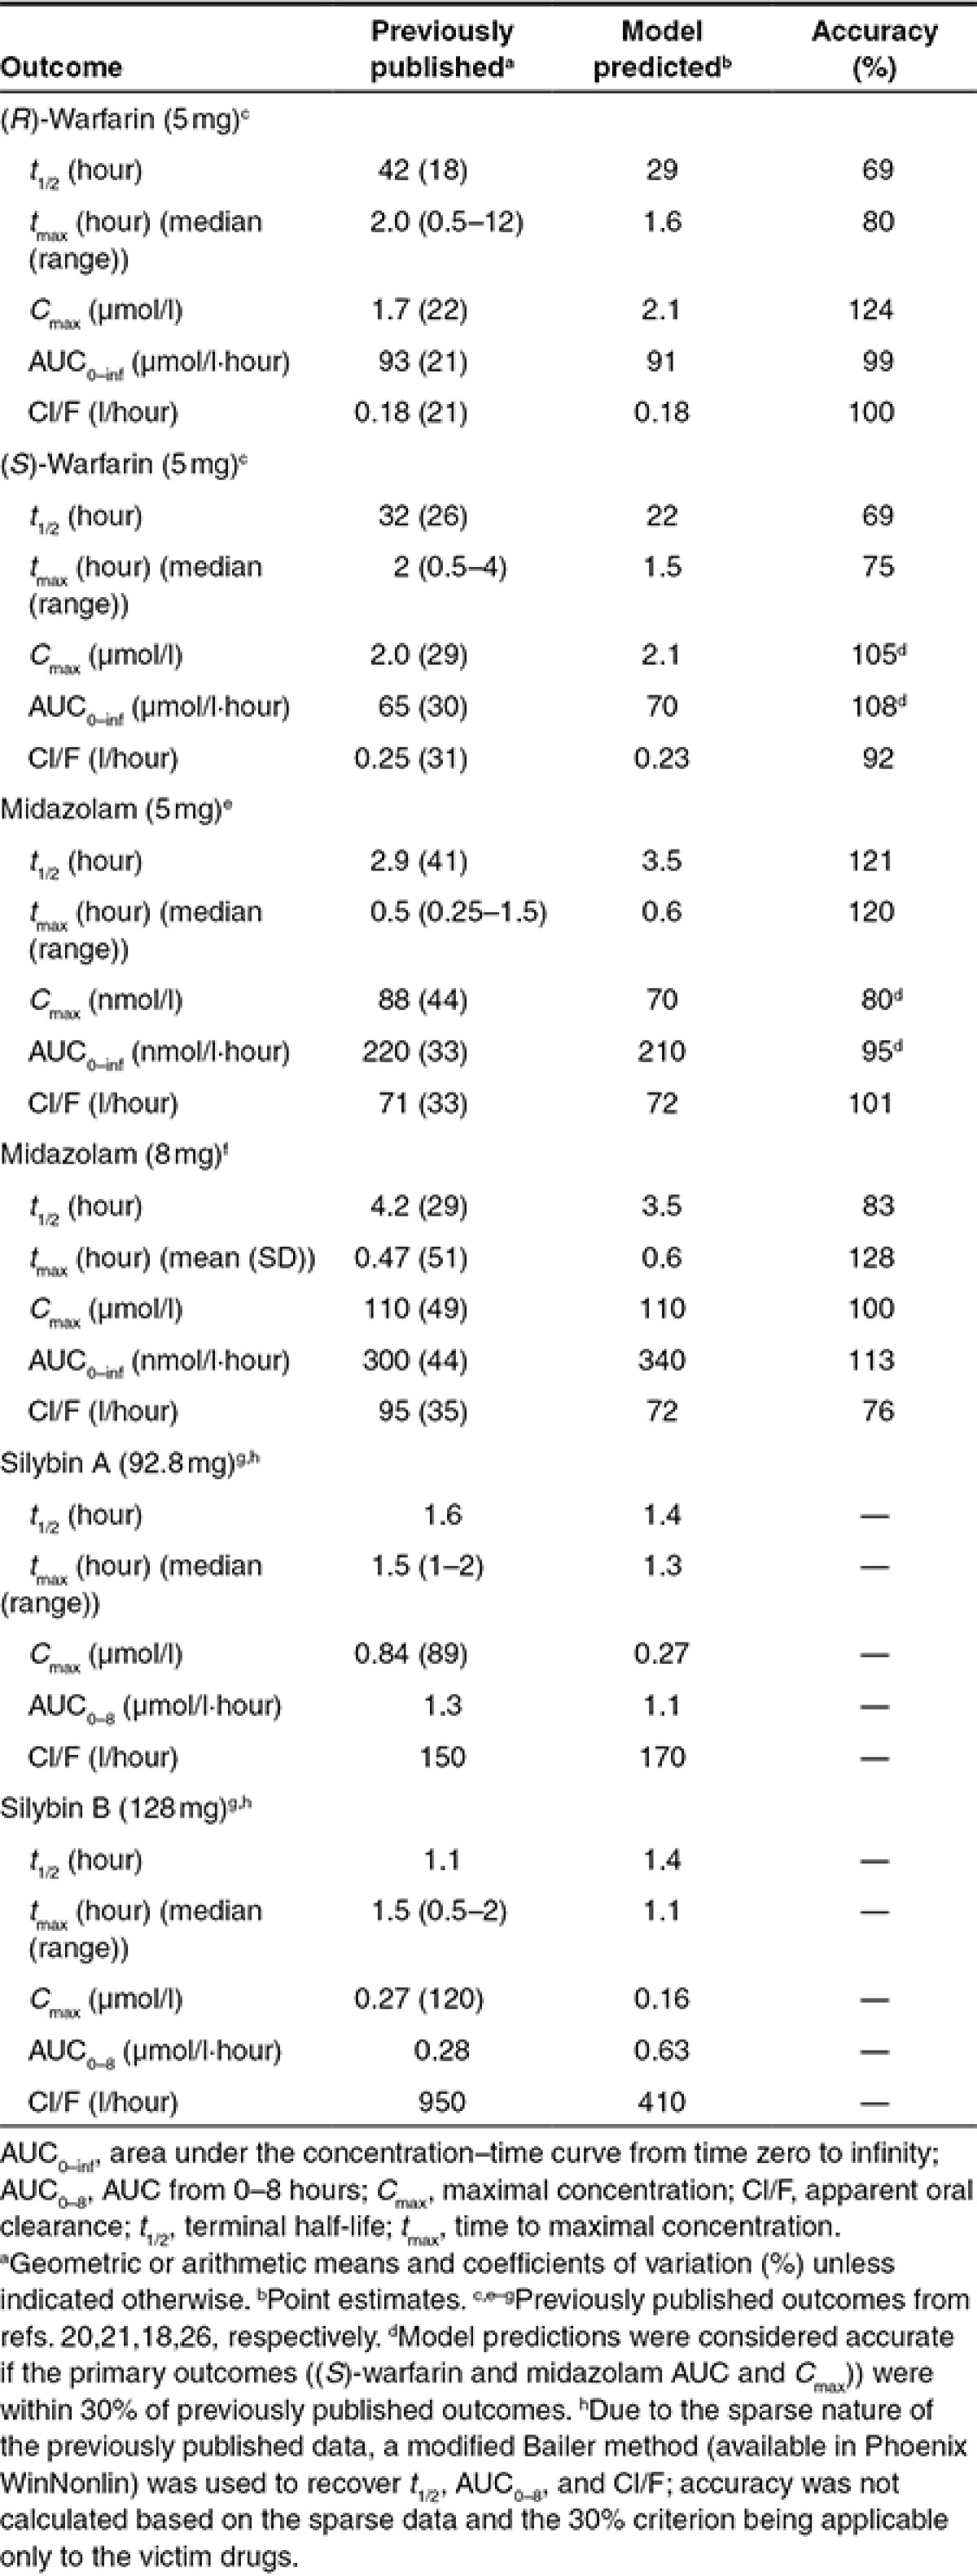
PBPK model generation and initial evaluation. Simulated probe substrate concentrations closely approximated previously published concentration–time profiles for both warfarin20 and midazolam21 under baseline conditions (data not shown). Model-predicted primary endpoints (area under the curve (AUC) and Cmax for (S)-warfarin and midazolam) were within the prespecified criterion (30%) for acceptable model performance (Table 1).
Table 1. Comparison of previously published and model-predicted pharmacokinetic outcomes.
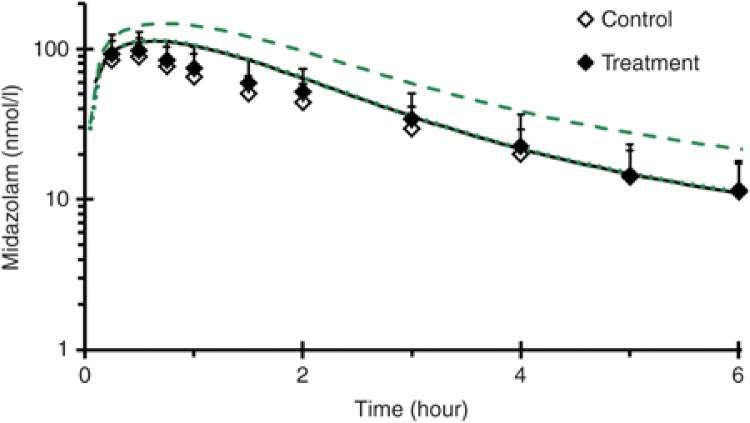
Prediction of silibinin–drug interaction magnitude. Simulations of a previously reported milk thistle-midazolam interaction, assuming reversible CYP3A inhibition solely due to silybin A and silybin B, demonstrated negligible changes in the midazolam concentration–time profile (Figure 1). The milk thistle product tested, silymarin, contained 100 mg of silybin A and 180 mg of silybin B and was administered daily for 14 days.18 Simulations assuming mechanism-based CYP3A inhibition predicted a 30% and 60% increase in midazolam Cmax and AUC, respectively; increases of 6% and 3% in midazolam Cmax and AUC, respectively, were reported18 (Figure 1).
Figure 1.
Mean concentration–time profile (0–6 hours) of midazolam in 19 healthy volunteers following an 8 mg oral midazolam dose given alone (open symbols) or following a 14-day treatment with milk thistle product (solid symbols).18 Lines denote physiologically based pharmacokinetic model simulations of the midazolam concentration–time profile when given alone (black) or with milk thistle (green). The dotted green line denotes incorporation of reversible inhibition of CYP3A, whereas the dashed green line denotes incorporation of mechanism-based inhibition of CYP3A. Symbols and error bars denote observed means and SDs, respectively, and were obtained from ref. 18.
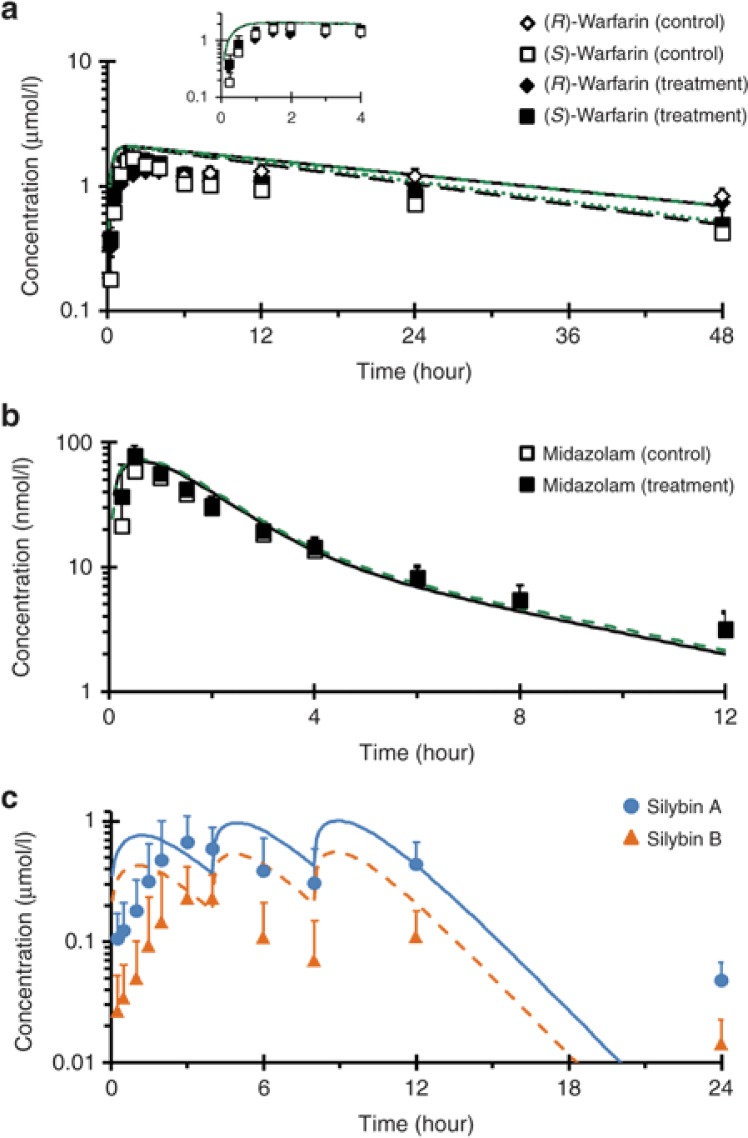
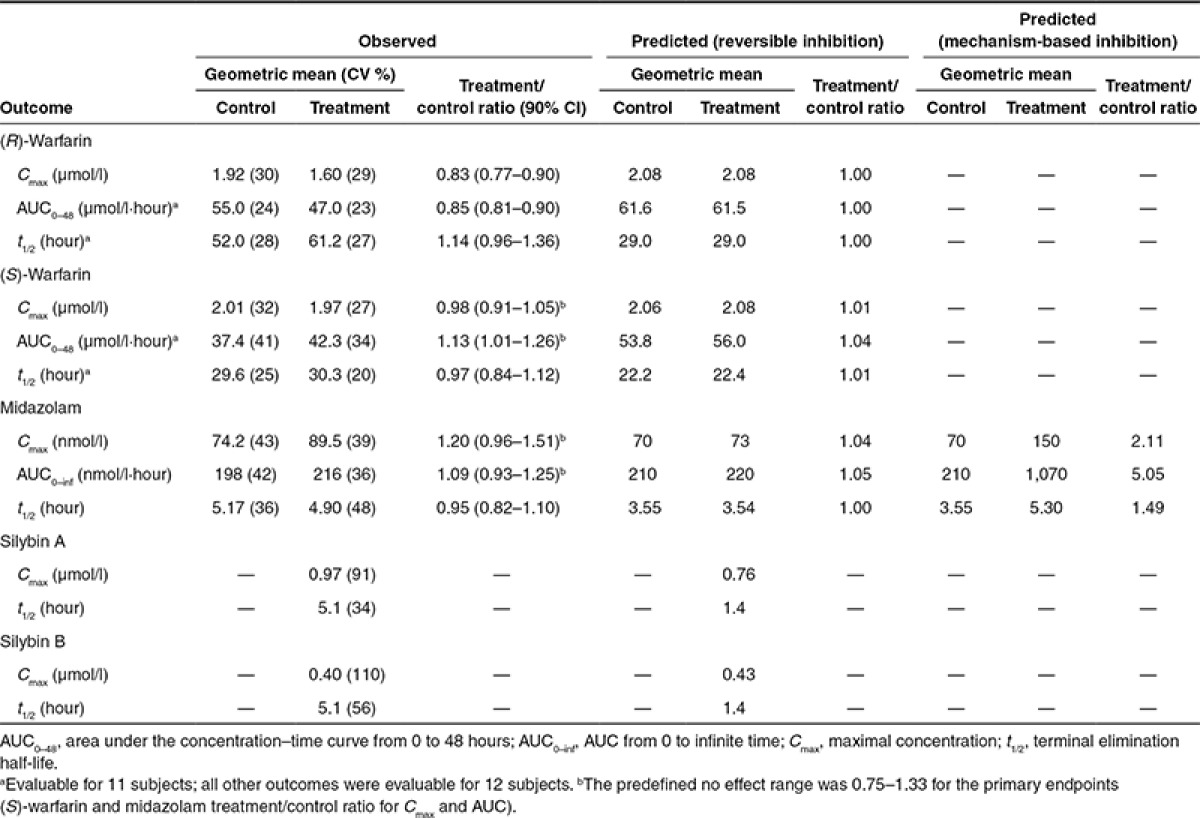
Simulations of the silibinin–warfarin interaction with a higher dose of silibinin (1,650 mg/day, or 720 mg silybin A plus 930 mg silybin B/day; see below), assuming reversible CYP2C9 inhibition only, predicted negligible changes (<5%) in all pharmacokinetic outcomes (Figure 2a; Table 2). Simulations of the high-dose silibinin–midazolam interaction assuming reversible CYP3A inhibition predicted no change in midazolam t1/2 and ≤5% increase in both Cmax and AUC (Figure 2b; Table 2). Simulations assuming mechanism-based CYP3A inhibition predicted a 2-, 5-, and 1.5-fold increase in Cmax, AUC, and t1/2, respectively (Table 2).
Figure 2.
Geometric mean concentration–time profile of (a) warfarin, (b) midazolam, and (c) silibinin in 12 healthy volunteers following a 10 mg oral dose of warfarin or 5 mg oral dose of midazolam given alone (open symbols) or following a 7-day treatment with silibinin (solid symbols). Lines in a and b denote physiologically based pharmacokinetic (PBPK) model simulations of the concentration–time profiles when the probe substrates were given alone (black) or with silibinin (green). Blue and orange lines in c denote PBPK model simulations of the concentration–time profiles of silybin A and silybin B, respectively. Symbols and error bars denote observed geometric means and upper limits of the 90% confidence interval, respectively.
Table 2. Comparison of proof-of-concept clinical study outcomes to physiologically based pharmacokinetic model predictions.
Proof-of-concept clinical evaluation
Silibinin content in test product. A single lot (#304090) of Siliphos capsules, labeled to contain 60 mg silibinin, was selected. The capsules were overfilled consistently, containing 69.1 ± 4.28 mg silibinin represented as 30.3 ± 1.88 mg silybin A and 38.9 ± 2.39 mg silybin B. The capsules also contained minor amounts of the regioisomers isosilybin A (1.55 ± 0.09 mg) and isosilybin B (0.94 ± 0.06 mg).
Study subjects. All enrolled subjects completed the study (Supplementary Table S2). The study drugs and silibinin generally were well tolerated. One subject experienced mild gastrointestinal upset following the first dose of silibinin. The effect was deemed likely to be drug related by the study physician but was transient and did not limit the subject's continued participation. During Clinical and Translational Research Center (CTRC) visits, four subjects (two in both phases) reported mild headaches attributed to caffeine withdrawal. No international normalized ratio elevations from baseline were observed following warfarin administration.
CYP2C9 genotyping. All enrolled subjects consented to genotyping. Ten subjects were homozygous for the reference CYP2C9*1 allele. Two subjects carried one copy of the reference allele and either the CYP2C9*2 or CYP2C9*3 allele.
Effects of high-dose silibinin on warfarin and midazolam pharmacokinetics. The effects of high-dose silibinin (1,650 mg/day) were compared to baseline oral pharmacokinetics of warfarin and midazolam. Due to the reported mechanism-based inhibition of CYP3A in vitro,14,16 silibinin was administered three times daily for 6 days prior to administration of the probe substrates. Silibinin constituents were not expected to accumulate during the administration period due to short reported half-lives (<4 hours).22 One subject demonstrated poor goodness-of-fit statistics for the t1/2 of both warfarin enantiomers in both phases (R2 < 0.85). Accordingly, data from this subject were excluded from analysis of AUC0–48 and t1/2.
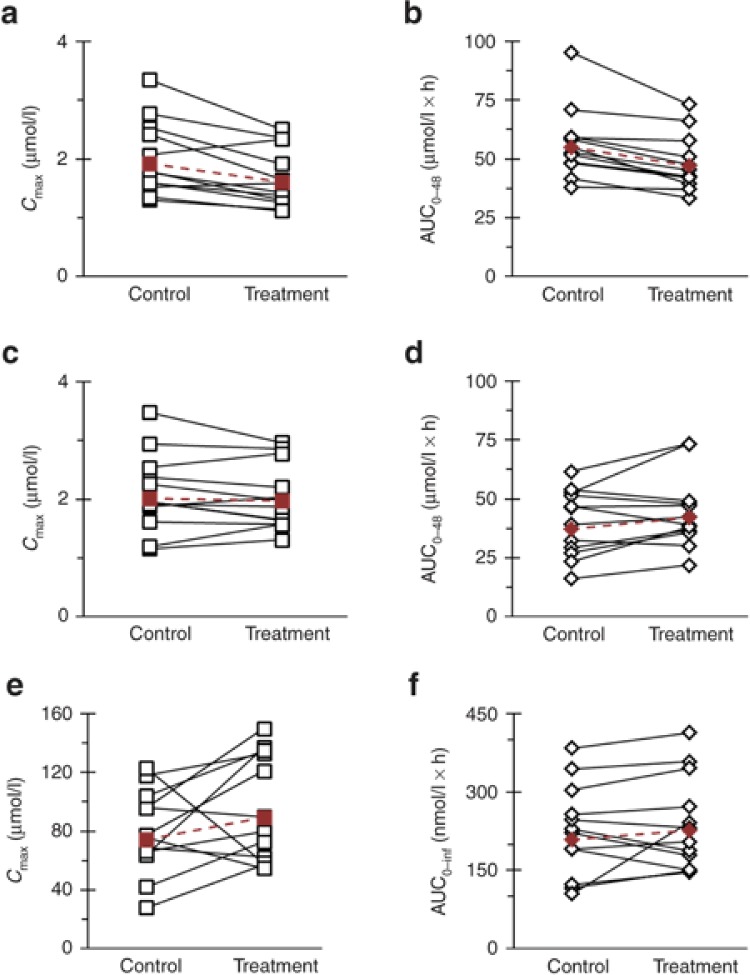
Warfarin enantiomers were absorbed rapidly during both study phases, with median tmax occurring at 1.25 and 1.5 hours for (R)- and (S)-warfarin, respectively (Figure 2a). Coadministration with silibinin did not alter median (S)-warfarin tmax but delayed median (R)-warfarin tmax by 15 minutes. Relative to control (baseline), silibinin decreased (R)-warfarin geometric mean Cmax by 17% (Figure 3a; Table 2) and AUC0–48 by 15% (Figure 3b; Table 2). Silibinin decreased geometric mean (S)-warfarin Cmax by 2% (Figure 3c; Table 2). Geometric mean AUC0–48 of (S)-warfarin increased by 13% (Figure 3d; Table 2), with three subjects lying outside the predefined no effect range (0.75–1.33). The 90% confidence intervals for the (S)-warfarin primary endpoints (Cmax and AUC) lay within the predefined no effect range (Table 2).
Figure 3.
Effects of silibinin (1,650 mg/day for 7 days) on (a,c,e) Cmax and (b,d,f) AUC of (a,b) (R)-warfarin, (c,d) (S)-warfarin, and (e,f) midazolam in 12 healthy volunteers following oral administration of warfarin (10 mg) and midazolam (5 mg). Open symbols connected by solid lines denote individual values. Solid symbols connected by dashed lines denote geometric means.
The rapid absorption of midazolam was unaltered by coadministration with silibinin, with median tmax occurring at 0.5 hours (Figure 2b). Relative to control, silibinin increased midazolam geometric mean Cmax by 20% (Figure 3e; Table 2) and AUC0–inf by 9% (Figure 3f; Table 2). Except for one subject (2.3-fold increase), treatment/control ratios of AUC0–inf lay within the predefined no effect range (Figure 3f). The 90% confidence interval for midazolam treatment/control ratio of Cmax extended above, whereas that of AUC0–inf lay within, the predefined no effect range (Table 2).
The sampling strategy was not optimized for recovery of silybin A and silybin B pharmacokinetic outcomes; as such, these outcomes were interpreted for qualitative rather than quantitative purposes. The median tmax of silybin A and silybin B following the initial administration of silibinin (3 and 3.5 hours, respectively) nearly coincided with the second administration of silibinin (Figure 2c). Geometric mean Cmax for silybin A was more than double that for silybin B (Table 2). Geometric mean t1/2 of both silybin A and silybin B was ~5 hours (Table 2).
DISCUSSION
Although herbal product usage continues to increase, current regulatory guidelines in several Western countries do not request premarket evaluation of herb–drug interaction liability. Investigations into such liabilities are fraught with inconsistent results due to the lack of a standard system for evaluation, high compositional variation between herbal products, and uncertainty about causative constituents. Unlike conventional drug products, the relative composition of herbal products may vary substantially depending on weather conditions, product collection and storage methods, and processing procedures.4 Accurate predictions of herb–drug interaction liability require not only identification and quantification of causative constituents, but also measures of exposure in organs with metabolic capability. Silibinin was selected as an exemplar herbal product due to a well-characterized composition, availability of inhibitory kinetic parameters from individual constituents, and disparate impact of milk thistle products on victim drug pharmacokinetics in previous clinical studies.17,18,19 A PBPK modeling and simulation approach was used to address the challenges inherent to investigation of herb–drug interaction liability.
Warfarin is a widely used oral anticoagulant with a narrow therapeutic window. Warfarin is associated with a notoriously complicated pharmacotherapy due in part to myriad drugs and herbal products that alter the metabolism or anticoagulant activity of warfarin. As the clearance of the more pharmacologically active (S)-enantiomer is mediated primarily by CYP2C9, inhibition of this enzyme can lead to increased risk of bleeding. Silymarin was shown previously to increase systemic exposure to the CYP2C9/3A substrate losartan,19 prompting evaluation of the interaction potential between milk thistle and warfarin. Of the milk thistle constituents whose CYP2C9 interaction liability has been evaluated in vitro, silybin A and silybin B were the most potent.15 These observations led to the selection of silibinin, which consists primarily of these two constituents, for clinical evaluation.
Relative to control, silibinin unexpectedly decreased both the geometric mean Cmax and AUC0–last of (R)-warfarin. Clinical manifestation of the previously reported CYP1A2 induction by a milk thistle extract23 is consistent with this decrease in exposure. In contrast to the doubling of losartan exposure following administration of silymarin, high-dose silibinin did not increase geometric mean (S)-warfarin exposure to a clinically relevant extent. However, increases above 33% were observed in three subjects, indicating that the CYP2C9 interaction potential of silibinin cannot be disregarded completely. Consistent with the expected decrease in (S)-warfarin clearance, the subject carrying the reduced function CYP2C9*3 allele demonstrated prolonged warfarin exposure, which was not captured in the 48-hour sampling window. As such, the AUC and t1/2 for this subject were excluded from analysis.
Modeling and simulation of the silibinin–warfarin interaction demonstrated that the rapid clearance of the silibinin constituents precluded marked inhibition of warfarin clearance. Sensitivity analysis of this interaction potential demonstrated that 10-fold increases in silybin A or silybin B inhibition potency (reversible Ki) would lead to roughly 15% increases in (S)-warfarin AUC (Supplementary Figure S1). Extensive intestinal and hepatic conjugation of silybin A and silybin B followed by rapid elimination likely would limit the interaction potential to first-pass clearance of sensitive substrates. Warfarin is not sensitive to first-pass elimination and is cleared only upon subsequent passages through the liver, at which time any reversible inhibition of CYP2C9 by silybin A and silybin B would be abated. In contrast, losartan has a low bioavailability (33%) that is attributed, in part, to first-pass elimination.24 This observation, coupled with the differences in study population and herbal product tested, could explain the difference between the reported interaction with losartan19 and the lack of interaction with warfarin in the present study. Collectively, these observations suggest examination of other CYP2C9 substrates sensitive to first-pass elimination, such as fluvastatin, to understand fully the milk thistle-CYP2C9 interaction potential.
Midazolam is a gold standard CYP3A probe substrate metabolized extensively by intestinal and hepatic enzymes. Inhibition of CYP3A at either site can increase systemic exposure to midazolam; inhibition of hepatic CYP3A also can increase t1/2. Milk thistle constituents, including silybin A and silybin B, have been shown to be reversible and mechanism-based inhibitors of CYP3A activity in both human liver microsomes and expressed enzyme systems.13,14,16 Previous clinical interaction studies with midazolam17,18 have demonstrated limited interaction liability with the milk thistle product silymarin, albeit the doses administered were not sufficient to determine the difference between reversible and mechanism-based inhibition of CYP3A (Figure 1). The “supratherapeutic” silibinin dose in the current study was selected to provide a large range between the predicted interaction based on reversible and mechanism-based inhibition of CYP3A and to maximize the ability to observe a clinical interaction. The lack of an interaction observed in all but one subject indicated that the CYP3A interaction liability for silibinin is low and is more consistent with reversible than mechanism-based inhibition (assuming inhibition indeed occurred). The current work represents another example of a potential mechanism-based inhibitor identified in vitro16 that does not manifest clinically.
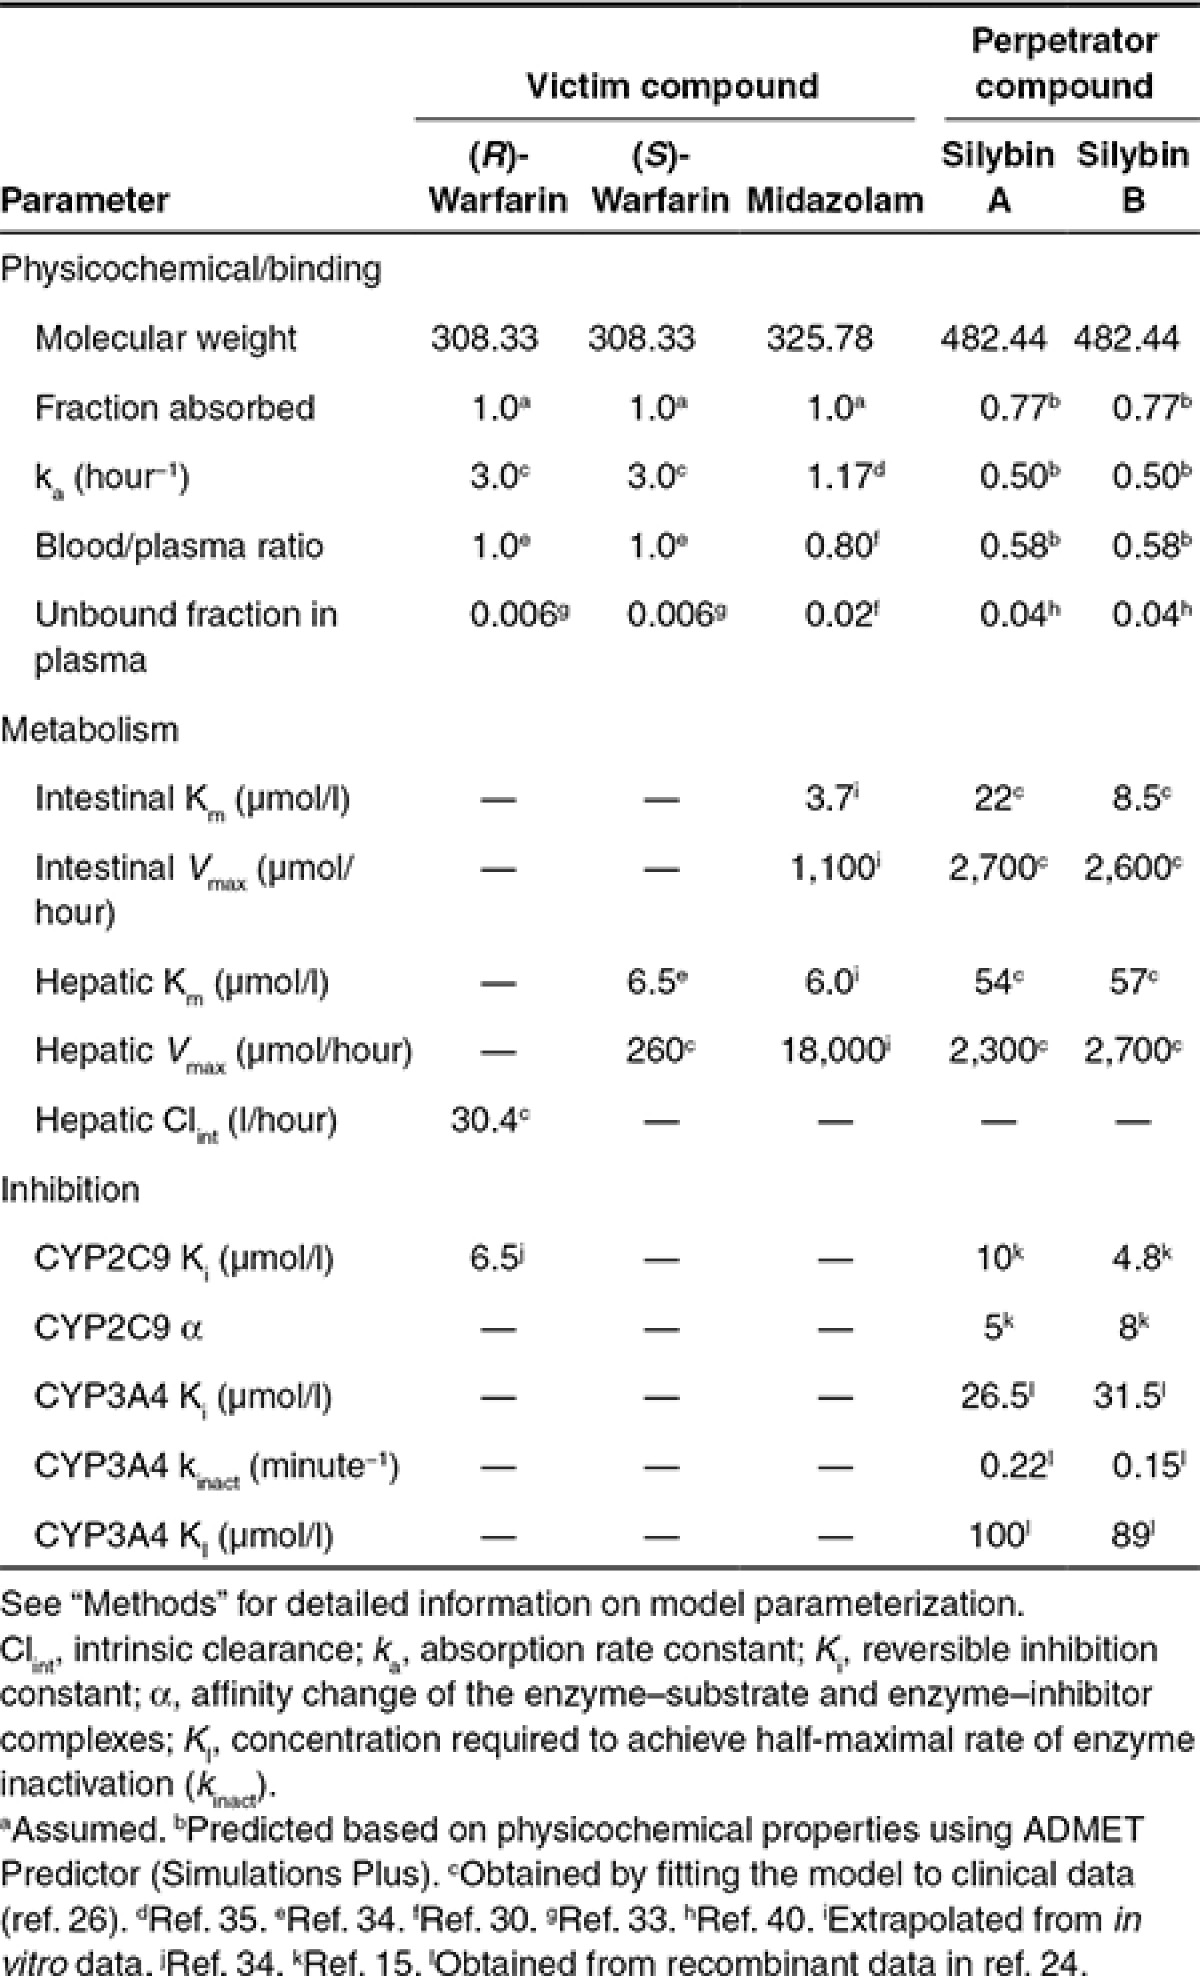
Modeling and simulation of the silibinin–midazolam interaction indicated that the low interaction potential is due, in part, to the lower inhibition potency of the silibinin constituents toward CYP3A compared to CYP2C9 (Table 3). Ten-fold increases in inhibition potency of silybin A and silybin B toward CYP3A activity increased midazolam exposure by roughly 25% (Supplementary Figure S1 and Supplementary Materials and Methods). These observations indicated that at the predicted exposures, the constituents would need to be 10-fold more potent to demonstrate any clinically relevant interaction with CYP3A. The large predicted increase in midazolam exposure incorporating mechanism-based inhibition further supported the hypothesis that products with limited systemic exposure (first posited with fruit juices)25 need to be mechanism-based inhibitors of CYP enzymes to perpetrate clinically relevant interactions.
Table 3. Physiologically based pharmacokinetic model input parameters.
One limitation to the current work is that silybin A and silybin B clearance parameters were recovered by fitting the model to data obtained from hepatitis C patients administered a product (silymarin) that contained additional constituents not present in silibinin.26 In vitro determination of silibinin clearance parameters would provide a true bottom-up modeling approach and reduce complexities inherent to pharmacokinetic data from patients with hepatic disease. Alternatively, disease-related parameters could be used to develop a hepatitis C virtual population before fitting the PBPK model with the observed pharmacokinetic data, facilitating recovery of disease-independent silibinin clearance parameters.27,28,29
In summary, prospective evaluation of herb–drug interactions, consistent with that for drug–drug interactions, largely has been ignored due to substantial compositional variability inherent to herbal products, multiple inhibitory constituents, varying inhibition mechanisms, and relative lack of regulatory oversight. The PBPK interaction model developed in the current work incorporated in vitro inhibition kinetic parameters and systemic exposure estimates of individual constituents for the exemplar herbal product, silibinin. Simulations of the silibinin–warfarin and silibinin–midazolam interactions accurately predicted minimal clinical interaction liability. This work demonstrated the utility and predictive power of PBPK modeling and simulation, which could be extended to investigate scenarios (e.g., wide dosing ranges, tissue exposure assessment, and herbal product composition variation) and patient populations (e.g., pediatric, geriatric, and pregnant women) not amenable to clinical investigation. Refinement of the PBPK model by recovering disease-independent silibinin clearance parameters and incorporating alternate victim drugs, including losartan, will enhance confidence in model predictions and generalizability. This framework represents an initial step to establishing a systematic approach that can be applied to other combinations of herbal products and conventional drugs under various clinical scenarios to identify potential clinically significant herb–drug interactions, predict the extent of those interactions, and ultimately help guide pharmacotherapeutic decisions.
METHODS
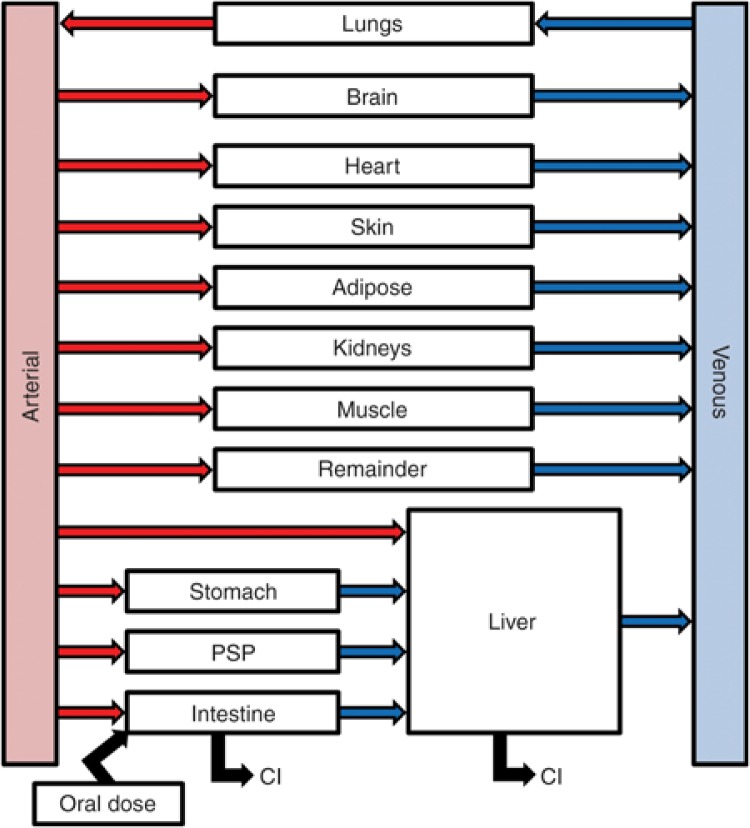
PBPK model development. The base model structure was adapted from the literature30 (Figure 4), incorporating physiologic parameters obtained from the International Commission on Radiological Protection.31 Warfarin partition coefficients (Kps)32 and binding parameters33 were obtained from the literature (Table 3); absorption rate constants (kas) and clearance parameters were obtained by fitting the PBPK model to previously reported plasma concentration–time profiles.20 The reversible inhibition constant (Ki) of (R)-warfarin toward CYP2C9 activity was obtained from the literature.34 Midazolam Kps and ka were obtained from the literature30,35; intestinal and hepatic clearance parameters were extrapolated from in vitro data16 as described36,37 (Table 3). Silybin A and silybin B Kps were predicted from physicochemical properties38 using GastroPlus (version 8.0; Simulations Plus, Lancaster, CA). Silibinin binding parameters were obtained from the literature39; clearance parameters were generated by fitting the PBPK model to plasma concentration–time data from hepatitis C patients receiving silymarin26 (Table 3). Silybin A and silybin B mechanism-based (KI, kinact) and reversible inhibition kinetic parameters were obtained from the literature.15,16 Mechanism-based inhibition of CYP2C9 was not considered based on a previous publication showing no IC50 shift using (S)-warfarin as the probe substrate.15
Figure 4.
Base physiologically based pharmacokinetic model structure. Model structure was modified from the literature.30 Organ weights and blood flows were obtained from the International Commission on Radiological Protection.31 Following oral administration, drug transfer from dosing compartment to intestine is driven by the oral absorption rate constant (ka). Drug clearance (Cl) is mediated by metabolic processes in the intestine and liver. The pancreas and spleen were combined into a hybrid “organ” designated as PSP.
PBPK interaction model simulations. PBPK models were developed for midazolam, (R)-warfarin, (S)-warfarin, silybin A, and silybin B using Berkeley Madonna (version 8.3; University of California at Berkeley, Berkeley, CA) with code compiled in MEGen40 (version 0.5; UK Health & Safety Laboratory, Buxton, UK) (Supplementary Materials and Methods). The PBPK model for perpetrator (silybin A and silybin B) and victim (warfarin or midazolam) compounds were linked through the reversible or mechanism-based inhibition of victim probe substrate. Initial simulations used doses of probe substrates and milk thistle products reported in previous studies. Simulations were considered accurate if the predicted primary pharmacokinetic outcomes (AUC and Cmax for (S)-warfarin and midazolam) were within 30% of observed outcomes. Following initial model evaluation, simulations were conducted with a higher dose of silibinin (1,650 mg/day) to determine whether a clinically important interaction is possible. Pharmacokinetic outcomes from the simulated profiles were recovered via noncompartmental analysis using Phoenix WinNonlin (version 6.3; Pharsight, Cary, NC).
Analysis of silibinin product. Siliphos capsules (n = 28) (Thorne Research, Dover, ID) were analyzed using a modification of previously described methods41,42 to ensure purity and content. Briefly, the contents of each capsule were weighed and extracted twice with 2 ml acetone. The extract was vortex mixed and centrifuged (13,000g for 2 minutes); the supernatant was transferred to a clean vial. Milk thistle constituents were quantified using an Acquity UPLC system with an HSS-T3 1.8 µm (2.1 × 100 mm) Acquity column and Empower 3 software (Waters, Milford, MA). Standards and Siliphos capsule extracts were analyzed using a gradient from 30:70 to 55:45 methanol:water (0.1% formic acid) over 5.0 minutes at a flow rate of 0.6 ml/minute at 50 °C; peaks were detected at 288 nm.
Proof-of-concept clinical study. Healthy volunteers (six men and six nonpregnant women) were enrolled in an open-label, fixed sequence crossover study conducted at the UNC CTRC. The study protocol was approved by the UNC Office of Human Research Ethics Biomedical Institutional Review Board and the CTRC Advisory Committee. Eligibility to participate was based on screening evaluation and inclusion/exclusion criteria (Supplementary Table S1). Written informed consent was obtained from each subject prior to enrollment.
The first (control) phase consisted of administration of 10 mg warfarin (Coumadin; Bristol Meyers Squibb, Princeton, NJ), 10 mg vitamin K (Mephyton; Aton Pharma, Lawrenceville, NJ), and 5 mg midazolam syrup (Ranbaxy; Jacksonville, FL). A negative pregnancy result was required before drug administration to women of childbearing potential. Vital signs (blood pressure, temperature, respiratory rate, pulse, and oxygen saturation) were obtained at baseline and every 15 minutes for the first 2 hours. All subjects underwent an international normalized ratio with prothrombin time. Blood (7 ml) was collected through an intravenous line before and from 0.25–12 hours following drug administration. Subjects continued to fast until after the 4-hour blood collection, when meals and snacks, devoid of fruit juices and caffeinated beverages, were provided. Subjects returned to the CTRC 24 and 48 hours post-drug administration for blood collection. Optimal study design simulations43 of previously reported clinical data20 demonstrated that a 0–48-hour collection was an accurate surrogate of total systemic exposure (AUC0–inf) for warfarin. Plasma was collected and stored at −80 °C pending analysis by high-performance liquid chromatography tandem mass spectrometry (HPLC/MS-MS).
Following at least a 14-day washout, subjects received 480 mg silibinin (based on labeled content) to self-administer three times daily for 7 days. Each subject received his/her silibinin in a blister pack and was asked to complete a pill diary documenting the time of administration. Subjects were contacted at least twice during the week of silibinin self-administration to monitor compliance and adverse events, which were graded using a validated Adverse Events Scale. Subjects returned to the CTRC on day 7 for concomitant administration of silibinin, warfarin, vitamin K, and midazolam. Plasma was collected and stored as described for the first phase.
Analysis of plasma for warfarin enantiomers, midazolam, silybin A, and silybin B. Concentrations of all analytes were quantified using a Sciex (Framingham, MA) API4000 Qtrap HPLC-MS/MS triple quadrupole mass spectrometer fitted with a Turbo ionspray interface operated in the positive ion mode. Plasma was treated with acetonitrile (6 volumes) containing the internal standard, warfarin-d5 (Toronto Research Chemicals; Toronto, Canada) or 1′-hydroxymidazolam-d4 (Cerilliant, Round Rock, TX), and centrifuged (3,000g). The supernatant was injected into the HPLC-MS/MS system. Warfarin enantiomers were separated on a Supelco Astec Chirobiotic V 15 cm × 2.1 mm 5 micron chiral column (Sigma Aldrich; St Louis, MO) and eluted with an isocratic mixture consisting of 75% 5 mmol/l ammonium acetate containing 0.01% (v/v) formic acid and 25% acetonitrile (flow rate, 0.4 ml/minute). Midazolam was eluted with a binary gradient mixture consisting of 10 mmol/l ammonium formate containing 1% (v/v) isopropyl alcohol and 0.1% (v/v) formic acid and methanol on a Varian Polaris C18-A 20 cm × 2.0 mm 5 micron column (Agilent, Santa Clara, CA) (flow rate, 0.65 ml/minute). Silybin A and silybin B were eluted with an isocratic mixture consisting of 44% water, 56% methanol, and 0.1% (v/v) formic acid on an Agilent Zorbax XDB C18 15 cm × 3.0 mm 3.5 micron column (Agilent) (flow rate, 0.7 ml/minute). Analyte concentrations were determined by interpolation from a linear standard curve with an assay dynamic range of 0.5–10,000 nmol/l (warfarin enantiomers) or 0.5–5,000 nmol/l (midazolam, silybin A, silybin B). Analytical methods were validated according to US Food and Drug Administration guidelines.44 Inter- and intraday variability for all analytes was less than 10%.
Pharmacokinetic analysis. Pharmacokinetic outcomes were recovered by noncompartmental analysis using Phoenix WinNonlin. Concentrations below the limit of quantification were excluded. The terminal elimination rate constant (λz) was estimated by linear regression of the terminal portion of the log-transformed concentration–time profile using at least three data points. The terminal half-life (t1/2) was calculated as ln2/λz. The maximum observed concentration (Cmax), time to reach Cmax (tmax), and last measured concentration (Clast) were obtained directly from the concentration–time profile. AUC from time zero to Clast (AUC0–last) was determined using the trapezoidal method with linear up/log down interpolation. The AUC from time zero to infinity (AUC0–inf) was calculated as the sum of AUC0–last and the ratio of Clast to λz.
Genotyping for common CYP2C9 variants. CYP2C9*2 and *3 polymorphisms were determined using a previously published polymerase chain reaction restriction fragment length polymorphism assay.45
Statistical analysis. All statistical analyses were conducted using SAS (version 9.2; SAS Institute, Cary, NC). The sample size for the proof-of-concept study (n = 12 evaluable subjects) was calculated based on 80% power to detect a 25% change in the primary endpoints with a type I error of 0.05; the primary endpoints were the treatment/control ratios of log-transformed AUC0–48 ((S)-warfarin) or AUC0–inf (midazolam) and Cmax ((S)-warfarin and midazolam), and the predefined no effect range was 0.75–1.33.5,6 Intraindividual variability in midazolam and warfarin AUC and Cmax were assumed to be ~20%.46,47,48 Secondary outcomes, t1/2 and tmax, were evaluated using a paired two-tailed Student's t-test on log-transformed data or Wilcoxon signed-rank test as appropriate, with 90% confidence intervals and ranges reported for t1/2 and tmax, respectively. A P value <0.05 was considered statistically significant.
Author Contributions
S.J.B., B.T.G., N.H.O., and M.F.P. wrote the manuscript. S.J.B., R.D., D.J.F., Y.V.S., and M.F.P. designed the research. S.J.B., B.T.G., R.D., D.J.F., T.N.G., and Y.V.S. performed the research. S.J.B., B.T.G., D.J.F., K.S.F., M.B.F., N.H.O., and M.F.P. analyzed the data. T.N.G., K.S.F., M.B.F., and N.H.O. contributed new reagents/analytical tools.
Conflict of Interest
The authors declared no conflict of interest.
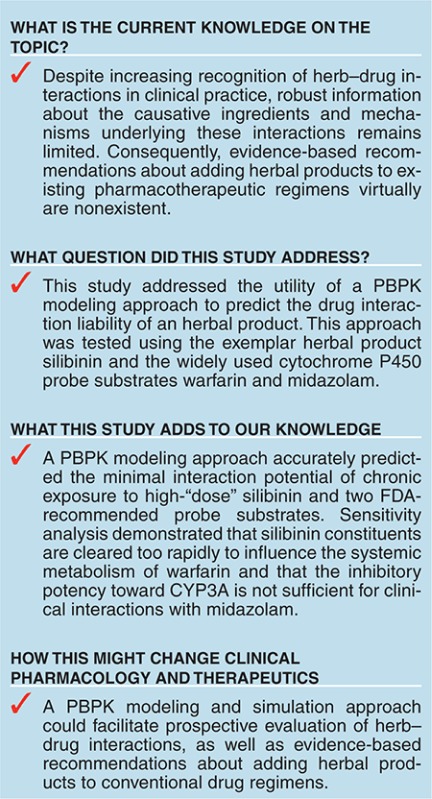
Study Highlights
Acknowledgments
The authors thank Dr. Vanessa González-Pérez and the CTRC staff for their assistance in the conduct of the clinical study; Garrett Ainslie for his assistance with the physiologically based pharmacokinetic modeling; Dr. Craig Lee and Kimberly Vendrov for their assistance with the CYP2C9 genotyping; and Drs. Dan Jonas, Karen Weck, and Kay Chao for providing the CYP2C9 positive controls. This work was supported by the National Institutes of Health through award number R01GM077482 from the National Institute of General Medical Sciences and award number UL1TR000083 from the National Center for Advancing Translational Sciences. The content is solely the responsibility of the authors and does not necessarily represent the official views of the National Institutes of Health. R.D. and D.J.F. were supported by a Clinical Pharmacokinetics/Pharmacodynamics fellowship sponsored by Quintiles and GlaxoSmithKline, respectively. Phoenix WinNonlin software was generously provided to the Division of Pharmacotherapy and Experimental Therapeutics, UNC Eshelman School of Pharmacy, by Certara as a member of the Pharsight Academic Center of Excellence Program. M.F.P. dedicates this article to Dr. David P Paine.
Supplementary Material
References
- Gurley B.J. Pharmacokinetic herb-drug interactions (part 1): origins, mechanisms, and the impact of botanical dietary supplements. Planta Med. 2012;78:1478–1489. doi: 10.1055/s-0031-1298273. [DOI] [PubMed] [Google Scholar]
- Hermann R., von Richter O. Clinical evidence of herbal drugs as perpetrators of pharmacokinetic drug interactions. Planta Med. 2012;78:1458–1477. doi: 10.1055/s-0032-1315117. [DOI] [PubMed] [Google Scholar]
- de Lima Toccafondo Vieira M., Huang S.M. Botanical-drug interactions: a scientific perspective. Planta Med. 2012;78:1400–1415. doi: 10.1055/s-0032-1315145. [DOI] [PubMed] [Google Scholar]
- Paine M.F., Oberlies N.H. Clinical relevance of the small intestine as an organ of drug elimination: drug-fruit juice interactions. Expert Opin. Drug Metab. Toxicol. 2007;3:67–80. doi: 10.1517/17425255.3.1.67. [DOI] [PubMed] [Google Scholar]
- European Medicines Agency Guideline on the Investigation of Drug Interactions 2012 ). http://www.ema.europa.eu/docs/en_GB/document_library/Scientific_guideline/2012/07/WC500129606.pdf Accessed 2 August 2012.
- Food and Drug Administration Draft Guidance: Drug Interaction Studies—Study Design, Data Analysis, Implications for Dosing, and Labeling Recommendations 2012 ). http://www.fda.gov/downloads/Drugs/GuidanceComplianceRegulatoryInformation/Guidances/ucm292362.pdf Accessed 2 August 2012.
- Fahmi O.A., et al. Comparison of different algorithms for predicting clinical drug-drug interactions, based on the use of CYP3A4 in vitro data: predictions of compounds as precipitants of interaction. Drug Metab. Dispos. 2009;37:1658–1666. doi: 10.1124/dmd.108.026252. [DOI] [PubMed] [Google Scholar]
- Huang S.M., Rowland M. The role of physiologically based pharmacokinetic modeling in regulatory review. Clin. Pharmacol. Ther. 2012;91:542–549. doi: 10.1038/clpt.2011.320. [DOI] [PubMed] [Google Scholar]
- Blumenthal M., Lindstrom A., Lynch M., Rea P. Market Report. Herb sales continue growth—up 3.3% in 2010. HerbalGram. 2011;90:64–67. [Google Scholar]
- Kroll D.J., Shaw H.S., Oberlies N.H. Milk thistle nomenclature: why it matters in cancer research and pharmacokinetic studies. Integr. Cancer Ther. 2007;6:110–119. doi: 10.1177/1534735407301825. [DOI] [PubMed] [Google Scholar]
- Graf T.N., Wani M.C., Agarwal R., Kroll D.J., Oberlies N.H. Gram-scale purification of flavonolignan diastereoisomers from Silybum marianum (Milk Thistle) extract in support of preclinical in vivo studies for prostate cancer chemoprevention. Planta Med. 2007;73:1495–1501. doi: 10.1055/s-2007-990239. [DOI] [PubMed] [Google Scholar]
- Monti D., et al. Enzymatic kinetic resolution of silybin diastereoisomers. J. Nat. Prod. 2010;73:613–619. doi: 10.1021/np900758d. [DOI] [PubMed] [Google Scholar]
- Zuber R., et al. Effect of silybin and its congeners on human liver microsomal cytochrome P450 activities. Phytother. Res. 2002;16:632–638. doi: 10.1002/ptr.1000. [DOI] [PubMed] [Google Scholar]
- Sridar C., Goosen T.C., Kent U.M., Williams J.A., Hollenberg P.F. Silybin inactivates cytochromes P450 3A4 and 2C9 and inhibits major hepatic glucuronosyltransferases. Drug Metab. Dispos. 2004;32:587–594. doi: 10.1124/dmd.32.6.587. [DOI] [PubMed] [Google Scholar]
- Brantley S.J., Oberlies N.H., Kroll D.J., Paine M.F. Two flavonolignans from milk thistle (Silybum marianum) inhibit CYP2C9-mediated warfarin metabolism at clinically achievable concentrations. J. Pharmacol. Exp. Ther. 2010;332:1081–1087. doi: 10.1124/jpet.109.161927. [DOI] [PMC free article] [PubMed] [Google Scholar]
- Brantley S.J., Graf T.N., Oberlies N.H., Paine M.F. A systematic approach to evaluate herb-drug interaction mechanisms: investigation of milk thistle extracts and eight isolated constituents as CYP3A inhibitors. Drug Metab. Dispos. 2013;41:1662–1670. doi: 10.1124/dmd.113.052563. [DOI] [PMC free article] [PubMed] [Google Scholar]
- Gurley B.J., et al. In vivo assessment of botanical supplementation on human cytochrome P450 phenotypes: Citrus aurantium, Echinacea purpurea, milk thistle, and saw palmetto. Clin. Pharmacol. Ther. 2004;76:428–440. doi: 10.1016/j.clpt.2004.07.007. [DOI] [PubMed] [Google Scholar]
- Gurley B., et al. Assessing the clinical significance of botanical supplementation on human cytochrome P450 3A activity: comparison of a milk thistle and black cohosh product to rifampin and clarithromycin. J. Clin. Pharmacol. 2006;46:201–213. doi: 10.1177/0091270005284854. [DOI] [PMC free article] [PubMed] [Google Scholar]
- Han Y., Guo D., Chen Y., Chen Y., Tan Z.R., Zhou H.H. Effect of silymarin on the pharmacokinetics of losartan and its active metabolite E-3174 in healthy Chinese volunteers. Eur. J. Clin. Pharmacol. 2009;65:585–591. doi: 10.1007/s00228-009-0624-9. [DOI] [PubMed] [Google Scholar]
- Ngo N., et al. The warfarin-cranberry juice interaction revisited: A systematic in vitro-in vivo evaluation. J. Exp. Pharmacol. 2010;2010:83–91. doi: 10.2147/JEP.S11719. [DOI] [PMC free article] [PubMed] [Google Scholar]
- Ngo N., et al. Identification of a cranberry juice product that inhibits enteric CYP3A-mediated first-pass metabolism in humans. Drug Metab. Dispos. 2009;37:514–522. doi: 10.1124/dmd.108.024968. [DOI] [PMC free article] [PubMed] [Google Scholar]
- Wen Z., Dumas T.E., Schrieber S.J., Hawke R.L., Fried M.W., Smith P.C. Pharmacokinetics and metabolic profile of free, conjugated, and total silymarin flavonolignans in human plasma after oral administration of milk thistle extract. Drug Metab. Dispos. 2008;36:65–72. doi: 10.1124/dmd.107.017566. [DOI] [PubMed] [Google Scholar]
- Doehmer J., Weiss G., McGregor G.P., Appel K. Assessment of a dry extract from milk thistle (Silybum marianum) for interference with human liver cytochrome-P450 activities. Toxicol. In Vitro. 2011;25:21–27. doi: 10.1016/j.tiv.2010.09.001. [DOI] [PubMed] [Google Scholar]
- Lo M.W., Goldberg M.R., McCrea J.B., Lu H., Furtek C.I., Bjornsson T.D. Pharmacokinetics of losartan, an angiotensin II receptor antagonist, and its active metabolite EXP3174 in humans. Clin. Pharmacol. Ther. 1995;58:641–649. doi: 10.1016/0009-9236(95)90020-9. [DOI] [PubMed] [Google Scholar]
- Hanley M.J., Masse G., Harmatz J.S., Court M.H., Greenblatt D.J. Pomegranate juice and pomegranate extract do not impair oral clearance of flurbiprofen in human volunteers: divergence from in vitro results. Clin. Pharmacol. Ther. 2012;92:651–657. doi: 10.1038/clpt.2012.170. [DOI] [PMC free article] [PubMed] [Google Scholar]
- Hawke R.L., et al. SyNCH Trial Group Silymarin ascending multiple oral dosing phase I study in noncirrhotic patients with chronic hepatitis C. J. Clin. Pharmacol. 2010;50:434–449. doi: 10.1177/0091270009347475. [DOI] [PMC free article] [PubMed] [Google Scholar]
- Lin X.Z., et al. Liver volume in patients with or without chronic liver diseases. Hepatogastroenterology. 1998;45:1069–1074. [PubMed] [Google Scholar]
- Nakai K., et al. Decreased expression of cytochromes P450 1A2, 2E1, and 3A4 and drug transporters Na+-taurocholate-cotransporting polypeptide, organic cation transporter 1, and organic anion-transporting peptide-C correlates with the progression of liver fibrosis in chronic hepatitis C patients. Drug Metab. Dispos. 2008;36:1786–1793. doi: 10.1124/dmd.107.020073. [DOI] [PubMed] [Google Scholar]
- Johnson T.N., Boussery K., Rowland-Yeo K., Tucker G.T., Rostami-Hodjegan A. A semi-mechanistic model to predict the effects of liver cirrhosis on drug clearance. Clin. Pharmacokinet. 2010;49:189–206. doi: 10.2165/11318160-000000000-00000. [DOI] [PubMed] [Google Scholar]
- Björkman S., Wada D.R., Berling B.M., Benoni G. Prediction of the disposition of midazolam in surgical patients by a physiologically based pharmacokinetic model. J. Pharm. Sci. 2001;90:1226–1241. doi: 10.1002/jps.1076. [DOI] [PubMed] [Google Scholar]
- Boecker B.B. Reference values for basic human anatomical and physiological characteristics for use in radiation protection. Radiat. Prot. Dosimetry. 2003;105:571–574. doi: 10.1093/oxfordjournals.rpd.a006305. [DOI] [PubMed] [Google Scholar]
- Luecke R.H., Wosilait W.D., Pearce B.A., Young J.F. A physiologically based pharmacokinetic computer model for human pregnancy. Teratology. 1994;49:90–103. doi: 10.1002/tera.1420490205. [DOI] [PubMed] [Google Scholar]
- Chan E., McLachlan A.J., Pegg M., MacKay A.D., Cole R.B., Rowland M. Disposition of warfarin enantiomers and metabolites in patients during multiple dosing with rac-warfarin. Br. J. Clin. Pharmacol. 1994;37:563–569. doi: 10.1111/j.1365-2125.1994.tb04305.x. [DOI] [PMC free article] [PubMed] [Google Scholar]
- Kunze K.L., Eddy A.C., Gibaldi M., Trager W.F. Metabolic enantiomeric interactions: the inhibition of human (S)-warfarin-7-hydroxylase by ®-warfarin. Chirality. 1991;3:24–29. doi: 10.1002/chir.530030106. [DOI] [PubMed] [Google Scholar]
- Langlois S., Kreeft J.H., Chouinard G., Ross-Chouinard A., East S., Ogilvie R.I. Midazolam: kinetics and effects on memory, sensorium, and haemodynamics. Br. J. Clin. Pharmacol. 1987;23:273–278. doi: 10.1111/j.1365-2125.1987.tb03045.x. [DOI] [PMC free article] [PubMed] [Google Scholar]
- Barter Z.E., et al. Scaling factors for the extrapolation of in vivo metabolic drug clearance from in vitro data: reaching a consensus on values of human microsomal protein and hepatocellularity per gram of liver. Curr. Drug Metab. 2007;8:33–45. doi: 10.2174/138920007779315053. [DOI] [PubMed] [Google Scholar]
- Obach R.S. Predicting clearance in humans from in vitro data. Curr. Top. Med. Chem. 2011;11:334–339. doi: 10.2174/156802611794480873. [DOI] [PubMed] [Google Scholar]
- Poulin P., Schoenlein K., Theil F.P. Prediction of adipose tissue: plasma partition coefficients for structurally unrelated drugs. J. Pharm. Sci. 2001;90:436–447. doi: 10.1002/1520-6017(200104)90:4<436::aid-jps1002>3.0.co;2-p. [DOI] [PubMed] [Google Scholar]
- Deng J.W., et al. Effect of silymarin supplement on the pharmacokinetics of rosuvastatin. Pharm. Res. 2008;25:1807–1814. doi: 10.1007/s11095-007-9492-0. [DOI] [PubMed] [Google Scholar]
- Loizou G., Hogg A. MEGen: A Physiologically Based Pharmacokinetic Model Generator. Front. Pharmacol. 2011;2:56. doi: 10.3389/fphar.2011.00056. [DOI] [PMC free article] [PubMed] [Google Scholar]
- Kim N.C., Graf T.N., Sparacino C.M., Wani M.C., Wall M.E. Complete isolation and characterization of silybins and isosilybins from milk thistle (Silybum marianum). Org. Biomol. Chem. 2003;1:1684–1689. doi: 10.1039/b300099k. [DOI] [PubMed] [Google Scholar]
- Davis-Searles P.R., et al. Milk thistle and prostate cancer: differential effects of pure flavonolignans from Silybum marianum on antiproliferative end points in human prostate carcinoma cells. Cancer Res. 2005;65:4448–4457. doi: 10.1158/0008-5472.CAN-04-4662. [DOI] [PubMed] [Google Scholar]
- Ma J.D., et al. Limited sampling strategy of S-warfarin concentrations, but not warfarin S/R ratios, accurately predicts S-warfarin AUC during baseline and inhibition in CYP2C9 extensive metabolizers. J. Clin. Pharmacol. 2004;44:570–576. doi: 10.1177/0091270004265366. [DOI] [PubMed] [Google Scholar]
- Food and Drug Administration Guidance for Industry: Bioanalytical Method Validation 2001. www.fda.gov/Drugs/Guidance Compliance Regulatory Information/Guidances/ucm064964.htm. Accessed 2 August 2012.
- Sullivan-Klose T.H., et al. The role of the CYP2C9-Leu359 allelic variant in the tolbutamide polymorphism. Pharmacogenetics. 1996;6:341–349. doi: 10.1097/00008571-199608000-00007. [DOI] [PubMed] [Google Scholar]
- Kashuba A.D., Bertino J.S., Jr, Rocci M.L., Jr, Kulawy R.W., Beck D.J., Nafziger A.N. Quantification of 3-month intraindividual variability and the influence of sex and menstrual cycle phase on CYP3A activity as measured by phenotyping with intravenous midazolam. Clin. Pharmacol. Ther. 1998;64:269–277. doi: 10.1016/S0009-9236(98)90175-8. [DOI] [PubMed] [Google Scholar]
- Kharasch E.D., Jubert C., Senn T., Bowdle T.A., Thummel K.E. Intraindividual variability in male hepatic CYP3A4 activity assessed by alfentanil and midazolam clearance. J. Clin. Pharmacol. 1999;39:664–669. doi: 10.1177/00912709922008290. [DOI] [PubMed] [Google Scholar]
- Yacobi A., et al. Who needs individual bioequivalence studies for narrow therapeutic index drugs? A case for warfarin. J. Clin. Pharmacol. 2000;40:826–835. doi: 10.1177/00912700022009558. [DOI] [PubMed] [Google Scholar]
Associated Data
This section collects any data citations, data availability statements, or supplementary materials included in this article.


