

Abstract
STUDY QUESTION
Are temporal trends and values of semen quality parameters in France identifiable in partners of totally infertile women?
SUMMARY ANSWER
Among a sample of 26 609 partners of totally infertile women undergoing an assisted reproductive technology (ART) procedures in the whole of France over a 17-year period, there was a continuous decrease in semen concentration of about 1.9% per year and a significant decrease in the percentage with morphologically normal forms but no global trend for motility.
WHAT IS KNOWN ALREADY
A global decrease in human sperm quality is still debated as geographical differences have been shown, and many criticisms have risen concerning studies with small and biased study populations or inappropriate statistical methodology. However, growing biological, toxicological, experimental and human exposure data support the endocrine disruptors' hypothesis assuming that fetal exposure to endocrine disruptors could impair reproductive outcomes.
STUDY DESIGN, SIZE, DURATION
This was a retrospective and descriptive study using data registered by Fivnat, the professional association in charge of statistics for ART in France during the 1989–2005 study period. Data were provided by 126 main ART centres over the whole metropolitan territory. The source population included 154 712 men, aged 18–70, who were partners of couples undergoing their first ART cycle and for whom semen quality indicators (concentration, total motility and percentage of morphologically normal forms), measured on fresh ejaculated semen, were available.
PARTICIPANTS/MATERIALS, SETTING, METHODS
The study population was 26 609 partners of women who had both tubes either absent or blocked. The temporal trends for each indicator of semen quality were modelled using a generalized additive model that allowed for nonlinear relationships between variables and were adjusted for season and age. In-depth sensitivity analyses included the reiteration of the analysis on data from a second spermiogram available for each man and on another subsample of men diagnosed as fertile. Variables such as centre, technique (standard in vitro fertilization or intra-cytoplasmic sperm injection) and an interaction factor between technique and time were also included in the model.
MAIN RESULTS AND THE ROLE OF CHANCE
There was a significant and continuous decrease in sperm concentration of 32.2% [26.3–36.3] during the study period. Projections indicate that concentration for a 35-year-old man went from an average of 73.6 million/ml [69.0–78.4] in 1989 to 49.9 million/ml [43.5–54.7] in 2005. A significant, but not quantifiable, decrease in the percentage of sperm with morphologically normal forms along the 17-year period was also observed. There was no global trend but a slight, significant increase in total motility between 1994 and 1998 was observed. The results were robust after sensitivity analysis.
LIMITATIONS, REASONS FOR CAUTION
Socioeconomic status could not be controlled for. Despite universal access to medical services in France, couples undergoing ART are expected to have a higher educational level on average compared with those of the general population. Therefore, the real values in the general population could be slightly lower than those presented and the decrease possibly stronger, as the population study is less likely to smoke or be overweight, two factors known to impair semen quality.
WIDER IMPLICATIONS OF THE FINDINGS
As the men were selected without a priori knowledge regarding their semen quality characteristics, the results are expected to be close to the values in the general French population. The very large sample size and the robustness of the results confer great statistical power and credibility to the results. To our knowledge, it is the first study concluding a severe and general decrease in sperm concentration and morphology at the scale of a whole country over a substantial period. This constitutes a serious public health warning. The link with the environment particularly needs to be determined.
STUDY FUNDING/COMPETING INTEREST(S)
No specific funding was sought for this study. The authors have no conflict of interest to declare.
The study has been authorized by the Commission Nationale de l'Informatique et des Libertés (CNIL), the national authority for the protection of personal data collected on individuals (authorization no DE-2010-063 dated 08/09/2010).
Keywords: epidemiology, sperm quality, environmental effects, male infertility
Introduction
The debate around temporal trends in sperm parameters has been a hot topic since the 1990s. Meta-analyses of the studies conducted since the 1950s report a decrease in sperm concentration in industrialized countries (Carlsen et al., 1992; Swan et al., 1997). Low environmental exposures to endocrine disruptors, especially during fetal growth, are suspected to explain such damage as well as effects on other reproductive outcomes such as testicular cancer and male urogenital malformations (cryptorchidism, hypospadias and possibly micropenis) (Skakkebaek et al., 2001; Gaspari et al., 2011).
However, a global decline of human sperm quality remains a matter of debate (Fisch, 2008; Bonde et al., 2011). Among all the factors that might explain such controversies, selection biases and poor data representativeness are the main methodological criticisms (Fisch, 2008). Indeed the studied samples were rarely randomly selected in the general population due to obvious technical difficulties. Moreover, semen quality studies in the general population are not a gold standard, as participation rates are under 30% (Bonde et al., 2011; Jorgensen et al., 2011). Most of the time, men are selected among semen donors or infertile couples undergoing assisted reproductive technology (ART). According to Fisch (2008), semen samples from couples attending infertility clinics, in which the female partner is later determined to be the source of the infertility, would be the sample whose characteristics in terms of sperm quality would be the closest to the general population since their inclusion for testing is unrelated to the semen provider's potential fertility. The inherent inter- and intra-subject variation in semen parameters and their wide and unpredictable geographic variations are a second source of potential error (Fisch, 2008). Among the known sources of intra-subject variations, age, abstinence time, scrotal temperature, season, smoking and drug use are common confounding factors.
According to these critical guidelines, we conducted a study on a population sample provided by the French ART database, Fivnat. This database recorded the ART attempts of couples from the whole French metropolitan territory (126 main ART centres across France contributing to the database) between 1989 and 2005. This sample therefore covered a rather long and continuous time period, and covered the geographical diversity of metropolitan France. More than 440 000 attempts were recorded. The results of two semen analyses for each man were provided, ensuring a control for intra-individual variation. Among these records, we selected results corresponding to the first assisted reproduction attempt of male partners of totally sterile women. This amounted to data for more than 26 000 men.
Based on this dataset, the purpose of our study was to bring the previous French semen quality trends from the 1990s up to date, while expanding the results to include a general population over the whole country.
Materials and Methods
Source population
The source population of the study included all male partners in couples involved in a standard in vitro fertilization (IVF) or intra-cytoplasmic sperm injection (ICSI) programme in metropolitan France, registered in the Fivnat database, between the 1 January 1989 and the 31 December 2005, and meeting the following criteria: spermiogram available; couple's ART first cycle (to prevent selection bias linked to previous failures); use of freshly ejaculated semen (to avoid quality alteration bias due to conservation techniques); and available information on the man's age and the ART technique (IVF or ICSI) and date of oocyte retrieval.
As men with azoospermia usually undergo ART with sperm from a donor, they were excluded from the study.
For each individual, two spermiograms were available, one carried out during a fertility check-up (the ‘check-up’ spermiogram) in a specialized laboratory, within 6 months prior to the IVF attempt, and a second one carried out at the ART centre the day of oocyte retrieval (the ‘attempt’ spermiogram). The exact date was available only for the ‘attempt’ spermiogram. For this reason, results from the ‘attempt’ spermiogram were studied for the main analysis and those from the ‘check-up’ spermiogram were used for the sensitivity analysis.
Study population
The study population was selected from the source population as male partners of women who had both tubes noted as absent or blocked and thus were definitely infertile.
Measurement methods
The data were extracted from the Fivnat database. Three main indicators of semen quality were registered in the database: sperm concentration (millions of sperm per millilitre), total motility (%) and morphology (percentage of morphologically normal forms).
For morphology, the majority of the French laboratories used David's classification method and still do (Blanchard et al., 2011). Very few laboratories use Kruger's classification for which outcomes in terms of morphologically normal forms are usually 15–20% lower than the previous (Auger, 2010).
Statistical analysis
In the study sample, we analysed the temporal trends between 1989 and 2005 of sperm concentration, total motility and morphology.
The three indicators were regressed on time, controlling for men's age. In order to consider possible non-linear relationships between the indicators and the explanatory variables, generalized additive models were used (Wood, 2006). A penalized spline function was used to model seasonality and long-term temporal trends. The age variable was introduced in the model as a b-spline to take into account a possible non-linear relation (De Boor, 1978).
For the residuals of the model to be normally distributed, a Box–Cox Transform (Box and Cox, 1964) was applied to sperm concentration. The two other indicators were binomially distributed. According to the central limit theorem, they could be considered Gaussian due to large sample size.
Models were validated with graphical tools: residuals' plot, comparison of predicted versus observed values and shape of the partial effect of each factor.
The trends for each indicator were computed in percentage of variation since 1 January 1989 and projected for an average age, a 35-year-old man. This unit has the advantage of being common to all three indicators, enabling direct comparison of the trends and their amplitude. The values in their respective units (million per millilitre for concentration and percentage for total motility and normal forms) were also provided for each indicator.
An increase or a decrease between 1 January 1989 and 31 December 2005 was significant when the 95% confidence interval did not include a variation of 0%.
All models were developed using the GAM procedure implemented in the mgcv package (Wood, 2006) of the R software (R Development Core Team, 2004).
Adjustment for the ART centre was only included in the sensitivity analysis to confirm that no particular centre impacted the global trends.
The analyses were reiterated on the ‘check-up’ spermiogram, which was most often produced outside of the ART centres, to further test the impact of laboratory practice diversity on the trends and the impact of intra-individual variability.
To ensure that an observed decrease in sperm quality was not due to the inclusion in the sample of infertile men made eligible for ART following the introduction of the ICSI technique, we adjusted for technique, and added an interaction between technique and time in the model. This enabled us to take into account and visualize the evolution in ART techniques and the evolution of IVF and ICSI prescription over time.
To test the robustness of our results, we did the same analyses on another subsample of the source population of men diagnosed as fertile at the time of the fertility check-up. This other study population is also not impacted by the possible bias of an infectious origin of tubal sterility, which may also affect the fertility of the male partner. This would not have been the case in a population of fertile men.
To rule out the impact of an overrepresentation of older men, analyses were also performed on a sample restricted to men under 50.
Finally, to confirm that the trend in morphology was not impacted by the use of the Kruger method, we did an analysis restricted to the centres that did not declare using this measurement method.
Results
In total, 154 712 first cycles of couples who used freshly ejaculated semen were registered in the Fivnat database between 1 January 1989 and 31 December 2005. Among them were 26 609 male partners of women whose both tubes were blocked or missing. They constituted the study population (Table I). The attempts were registered in 126 different ART centres localized over the whole of metropolitan France.
Table I.
Number of men in the source and study population, for each sperm parameter analysis and each ART technique, with age distribution
| Samples | Source populationa (N = 154 712) |
Study populationb (N = 26 609) |
||||
|---|---|---|---|---|---|---|
| Indicator | Concentration | Motility | Morphology | Concentration | Motility | Morphology |
| Complete attemptsc | 121 702 | 120 635 | 59 457 | 21 055 | 21 102 | 11 416 |
| IVF (%) | 73.9 | 74.3 | 77.4 | 94.6 | 94.7 | 95.5 |
| ICSI (%) | 26.1 | 25.7 | 22.6 | 5.4 | 5.3 | 4.5 |
| Age average; percentile 25; median; percentile 75 | 35.2; 31; 34; 38 | 35.2; 31; 34; 39 | ||||
aMen involved in couples undergoing their first ART cycle, registered in the Fivnat database, using freshly ejaculated semen.
bPartners of women with both tubes absent or blocked.
cAge, technique, date and infertility factor completed.
Variables of interest regarding the study population's socio-economic characteristics were poorly filled, with 79.7% and 97.2% missing values for professional activity and tobacco consumption, respectively.
Average age increased from 33.8 in 1989 to 37.0 in 2005 in the source population and from 34.2 to 35.9 in the study population (Supplementary Figure S2). In both the source and the study population, the percentage of men over 50 was 0.1% (Supplementary Figure S1).
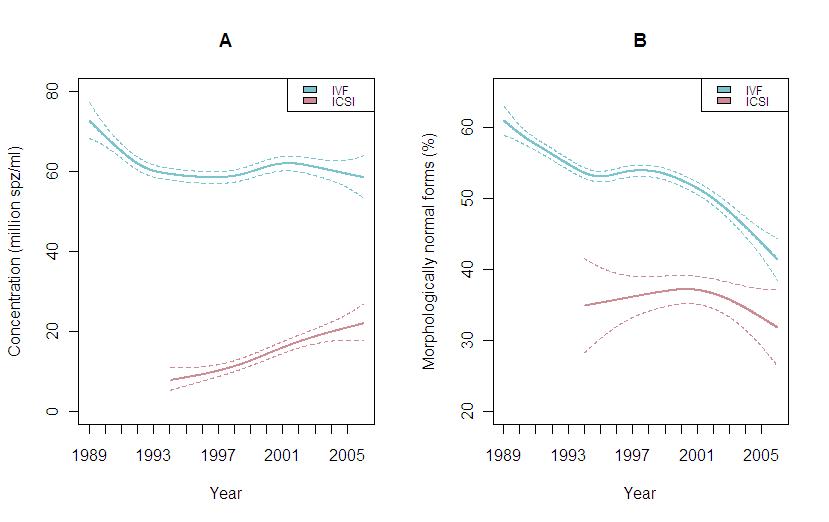
The proportions of IVF and ICSI in the source population and in the study sample have changed over time (Figure 1). From 1989 to 1994, IVF was the only technique available. From 1994, ICSI was increasingly used in the whole population participating in ART attempts, until the ratio of IVF/ICSI stabilized from 2000 onward. This change was much less pronounced in the study population, in which ICSI represented a total of 5.2% of the attempts with a peak at 18.9% in 2004 (Figure 1B).
Figure 1.
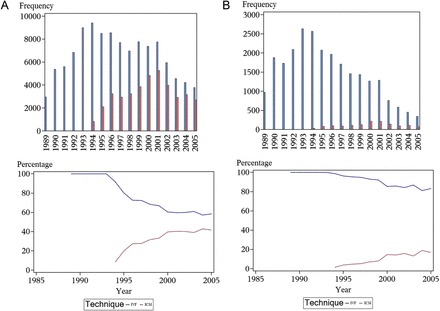
Evolution of the frequency and percentage of IVF and ICSI over the study period for (A) the source population and (B) the study population.
The percentage of attempts in which both partners were diagnosed as infertile was stable during the whole study period (not shown). This confirms that there was no major increase in infertile men in our study population over time.
The various semen parameters were weakly correlated (correlation coefficient < 0.50), which confirmed the relevance of analysing them separately.
Trends
Concentration
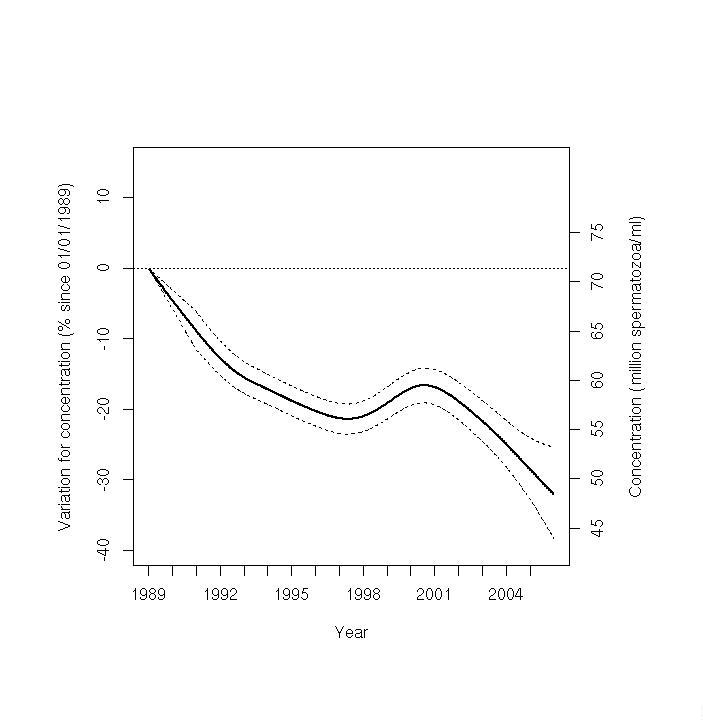
There was a significant 32.2% [26.3–36.3] decrease in sperm concentration over the whole 17-year study period. The projected concentration for a 35-year-old man went from 73.6 million/ml [69.0–78.4] in January 1989 to 49.9 million/ml [43.5–54.7] in December 2005 (Figure 2). The average decrease for concentration was 1.4 million/ml per year (1.9%).
Figure 2.
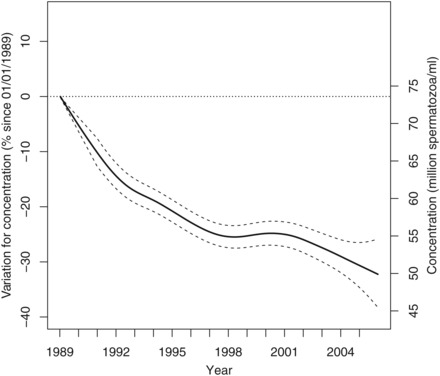
Variation in percent for concentration since 1 January 1989 for a 35-year-old man in metropolitan France with 95% confidence intervals (left axis). Projected values in million spermatozoa per millilitre (right axis).
Motility
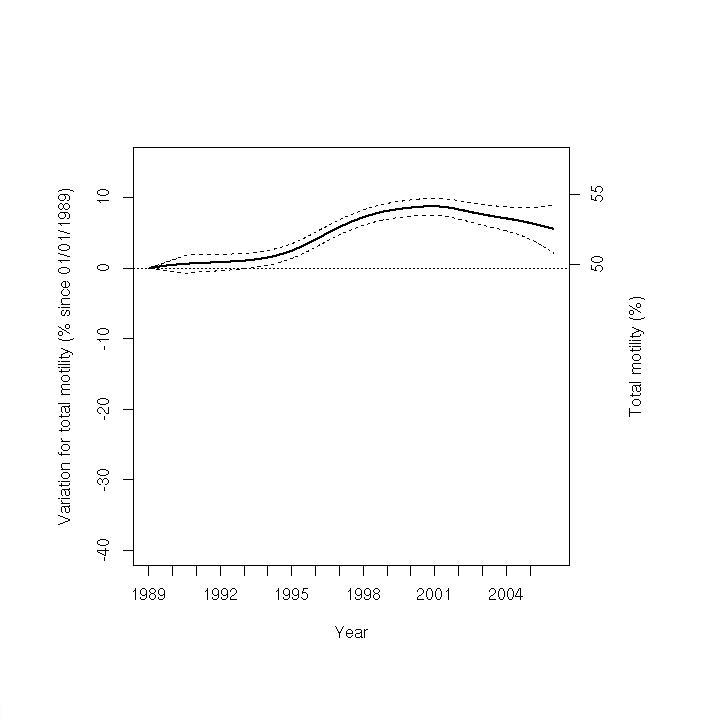
Following a period of stability between 1989 and 1994 (projected values of 49.5% motile spermatozoa [48.2–50.8] and 49.6% [49.2–50.1], respectively), the motility percentage increased to 52.4% [51.9–52.9] in 1998 (Figure 3). Then the motility percentage was stabilized until 2005 at 53.6% [52.0–55.2].
Figure 3.
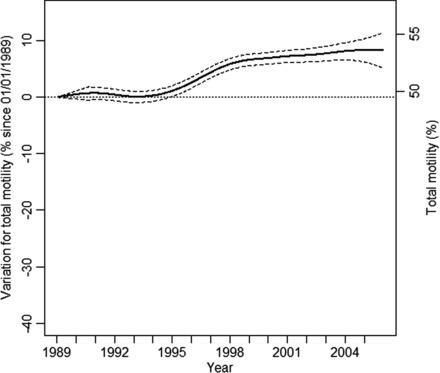
Variation in percent for total motility since 1 January 1989 for a 35-year-old man in metropolitan France with 95% confidence intervals (left axis). Projected values in percentage motile spermatozoa (right axis).
Morphology
There was a significant 33.4% [29.7–37.2] decrease in the mean percentage of sperm with normal forms over the period. The percentage decreased significantly from 60.9% [58.8–62.9] in 1989 to 52.8% [52.0–53.5] in 1995, i.e. an average decrease of 1.3% normal forms per year. Following a stable period of 3 years, another decrease in the percentage with normal forms was observed between 1998 and 2005 (52.8% [52.0–53.6] to 39.2% [36.3–42.1]), which is an average decrease of 1.7% normal forms per year (Figure 4).
Figure 4.
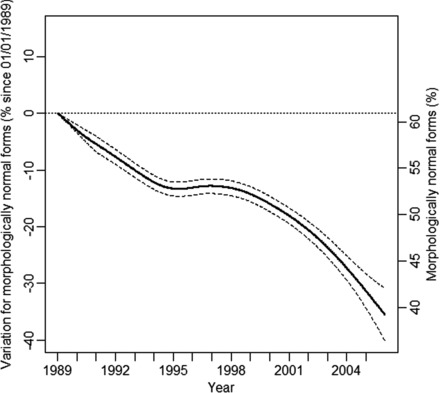
Variation in percent for morphologically normal forms since 1 January 1989 for a 35-year-old man in metropolitan France with 95% confidence intervals (left axis). Projected values in percentage morphologically normal forms (right axis).
Sensitivity analysis
Adjusting for technique and interaction between time and technique
Adjusted trends (Supplementary Figure S3) showed that the observed decreases in concentration and morphology were not due to an arrival of infertile men brought by ICSI. Indeed, the decreases are still observed despite the changes in practise, in particular the gradual widening of ICSI to more fertile men.
Check-up spermiogram
Results in trends and values obtained on the ‘check-up’ spermiogram (Supplement Figures S4–S6) were similar to those obtained on the ‘attempt’ spermiogram for the three indicators of sperm quality.
For concentration, there was a significant 32.1% [25.4–38.4] decrease from 71.4 [66.6–76.3] million/ml in 1989 to 48.8 [44.8–53.3] million/ml in 2005. There was no decrease in total motility, but a decrease in percent normal sperm from 58.4% [56.8–60.0] normally shaped spermatozoa in 1989 to 40.6% [38.8–42.5] in 2005.
Adjusting for centre
The trend shapes and values did not change when adjusting for a centre effect.
Men under 50
The trends were also identical when restricted to men under the age of 50.
Subsample of fertile men
Trends were similar for the subsample of fertile men (Supplementary Figures S7–S9). For concentration, there was a significant 29.8% [25.3–34.2] decrease from 81.2 [77.2–85.3] million/ml in 1989 to 56.9 [53.4–60.0] million/ml in 2005. There was no decrease in total motility, but a significant decrease in percent normal sperm from 64.4% [62.9–66.0] normally shaped spermatozoa in 1989 to 44.1% [42.2–46.0].
Morphology technique measurement
Morphology results were not changed by removal of data collected in the centres that used the Krüger classification at least once over the study period. We could not simply adjust for this variable since it had too many missing values (97.5%).
Discussion
In a large sample of over 26 000 men, aged 18–70, who were partners of totally infertile women undergoing their first ART treatment over the whole of France, our results show a significant and continuous decrease in average sperm concentration and a significant and almost continuous decrease in the percentage of morphologically normal forms between 1989 and 2005. For motility, there was no global trend, with a slight but significant increase between 1994 and 1998.
There are three main sources of bias when using men from couples undergoing ART for semen quality studies. They are less fertile and older on average than the general population, and it has been shown they are more likely to have a higher level of education, even in France, in the context of national coverage for infertility services (Moreau et al., 2010).
For infertile couples where the woman is later determined to be totally sterile, there is no reason for the partner to have different semen quality from the population average, which means that our study population of non-azoospermia partners of totally infertile women can be considered unbiased regarding fertility parameters.
As we included the age variable in the model, and because the trends remained identical when excluding men over 50, we argue that there was no bias due to the slight increase in age of the study population over the period or due to it being higher average than the general population.
Finally, we unfortunately could not adjust for socio-economic status due to a high percentage of missing values for variables such as professional activity and tobacco consumption. In France, more highly educated men are less likely to smoke tobacco and be overweight, which are two known factors of semen quality impairment (Sharpe, 2010). In addition, in the study period, the percentage of men who were overweight increased less and tobacco consumption decreased more among French higher educated men compared with men with less education (Sasco et al., 1994; de Saint Pol, 2009). Therefore, the real values for sperm parameters in the general population could be slightly lower than those that we present and the decreases could possibly be stronger.
Finally, the prevalence of azoospermia in the general population has rarely been studied but seems to be very scarce, around 0.4% (Itoh et al., 2001) which leads us to think that the exclusion of these men does not noticeably modify the profile of our sample. It would be interesting however to monitor azoospermia as a specific indicator of male fertility with appropriate data and methods.
Regarding the measurement methods for concentration and motility, experts have confirmed that the methods have not changed noticeably during the study period.
For morphology, there have been several changes in the definition of morphologically normal forms and a general improvement of observer accuracy. For this reason, no values in the general population were given for this indicator. First, the introduction of Kruger's classification in some centres may explain a small part of the observed decrease, even if the sensitivity analysis for this showed no impact. Most importantly, a general improvement of observer accuracy, particularly after 1999 when stricter criteria were introduced in the WHO manual (Menkveld et al., 2011), may also be partly responsible for the observed decrease in normal sperm morphology. Abnormal forms have been more strictly detected over time, which would result in a decrease in the percentage of normal forms over time (Prisant et al., 2011). This phenomenon has already been documented and confirmed by a reanalysis of old smears but was ruled out as being the sole origin of the observed decrease (Menkveld, 2010).
In our study, the observed decrease in morphology was highly significant. It is therefore likely that independent of the improvement in observer accuracy, there has been a real deterioration of sperm morphology in France.
Regarding the diversity of practices between laboratories, we could not check for quality control but there is no reason to think that they did not follow national and WHO recommendations. The sensitivity analysis confirmed that variations in practice did not impact the global trends as the values and trends were similar for the ‘check-up’ and the ‘attempt’ spermiograms, which are most often done in different laboratories, and they did not change when including the centre variable in the statistical model.
Among the three semen parameter indicators, the experts consider that sperm concentration is the most reliable.
Using non-linear models enabled us to control for seasonal variations (Levine, 1999; Kunzle et al., 2004) and to observe a non-linear relationship between semen parameters and time, which to our knowledge, had not been done in previous semen quality studies. On the other hand, we could not adjust for abstinence time, which according to Fisch (2008) is one of the main weaknesses of many studies, since concentration increases with abstinence time (Schwartz et al., 1979). However, all men received the same instructions (to abstain for 3–5 days) and there is no reason to suspect changes in compliance over time as a potential source of bias.
By using a Box–Cox Transformation for concentration, we allowed for a better normalization of our model's residuals than with log or square root transformations. Finally, by not selecting a sample of men with concentration greater than a minimum threshold (Zorn et al., 1999; Sripada et al., 2007; Mukhopadhyay et al., 2010), we were not subject to bias created by truncating the concentration probability density.
The sensitivity analysis also showed that observed trends were independent of intra-individual variability as the trends were identical for the two different spermiograms. It was also confirmed that infectious origin of tubal sterility was not a source of bias as the trends for the subsample of fertile men were unchanged.
Homogeneity of the sample over time is needed to study time trends. This difficulty is often overshadowed or not accounted for in studies involving infertile men. During the study period, men with a gradually lower sperm quality could perform ART in France due to several changes in AR techniques and AR technique prescriptions, particularly the emergence of ICSI in 1994. ICSI was aimed at men with very poor semen quality who could not be treated by standard IVF before, and it made new infertile men eligible to ART. A sensitivity analysis, with adjustment for technique and interaction of time and technique, confirmed that, by selecting only the partners of totally infertile women, the study population was not impacted by this evolution in technique.
Interpretation of the results
Average concentration
Three previous studies have shown a decline in sperm concentration in France: in semen donors from the Paris area from 1973 to 1992 (Auger et al., 1995), among 7714 fertile male partners of sterile women (de Mouzon et al., 1996); and recently in Tours from 1976 to 2009 among 1114 semen donors (Splingart et al., 2012). However, a study carried out in Toulouse showed no decrease between 1977 and 1992 among 302 semen donors (Bujan et al., 1996), and a further study confirmed discrepancies in time trends observed in samples of sperm donors across eight French towns (Auger and Jouannet, 1997).
The magnitude of the average annual 1.9% decrease observed in the present study is consistent with the 2.1% per year decrease observed among the semen donors in Paris in 1995 (Auger et al., 1995). Even though the two study populations were different, this could mean that the decline in semen concentration in France has not slowed down since the 1970s.
The global decrease in concentration observed in the present study is consistent with past meta-analyses of the international literature (Carlsen et al., 1992; Swan et al., 1997). More recent studies on concentration trends also show a decrease in previously unstudied countries such as Israel (Almagor et al., 2003), India (Adiga and Jayaraman, 2008), New Zealand (Shine et al., 2008) and Tunisia (Feki et al., 2009), with the exception of Sweden (Axelsson et al., 2011), where no significant trend was observed. Even in Finland, where sperm concentration was shown to remain unchanged across past study periods (Jorgensen et al., 2001, 2002), a more recent study showed a decline between 1998 and 2006 (Jorgensen et al., 2011). Thus, even though the existence of a global decrease is still debated (Wilcox, 2011), our results seem consistent with this hypothesis and the generally observed decrease in sperm concentration.
We argued that our study sample is close enough to the general population to generalize our results; the main source of uncontrolled bias is the socio-economic status which we argued makes our values for sperm concentration maybe a little higher than those in general population. Thus, the average sperm concentration in France in 2005 for a 35-year-old man is expected to be close to 49.9 million/ml [43.5–54.7]. This is consistent with some recent studies (Shine et al., 2008), but higher than that observed in Denmark among young military draftees (Bonde et al., 2011).
Although the decrease in concentration since the beginning of the study period is rather important, the average concentration in 2005 is much higher than the WHO reference value of 15 million/ml (Cooper et al., 2010a) and the 20 million/ml threshold that is expected to impair natural male fertility, but it is lower than the 55 million/ml threshold below which sperm concentration could influence the time to pregnancy (Slama et al., 2002).
Average motility
Contrary to the previous study in Paris (Auger et al., 1995) that showed a decrease in average total motility between 1973 and 1992, we did not observe any such decrease during the study period. On the contrary, we observed an increase between 1994 and 1998. More generally, the results of studies on total motility are contrasted. Many studies do not find any trend (Zorn et al., 1999; Seo et al., 2000; Lackner et al., 2005; Sripada et al., 2007; Fisch, 2008; Feki et al., 2009), some observe a decrease (Auger et al., 1995; Zorn et al., 1999; Almagor et al., 2003; Mukhopadhyay et al., 2010) and a few observe an increase (Andolz et al., 1999; Chen et al., 2003) in motility. These results, combined with the ones observed in the present study, suggest that there is no global trend in total sperm motility. However, total motility reflects two types of motility (progressive and non-progressive), and it is not excluded that progressive motility, not recorded in the Fivnat database, could show a decline. Further studies would be needed to test this hypothesis.
With the same arguments as those developed above for sperm concentrations, the average sperm total motility in France in 2005 for a 35-year-old man is expected to be close to 53.6% [52.0–55.2], which is not considered to impact fertility (Cooper et al., 2010b). It is close to that observed in 1999–2001 among similarly aged partners of pregnant women in four US cities (Swan et al., 2003), but is 10% lower than that observed in the 1973–1993 period in France among sperm donors (Auger et al., 1995) of the same age.
Average morphology
A decrease in the percentage of sperm with morphologically normal forms was also shown in the previous Paris study (Auger et al., 1995). This trend is coherent with other recent studies (Zheng et al., 1997; Andolz et al., 1999; Almagor et al., 2003; Chen et al., 2003; Feki et al., 2009; Jorgensen et al., 2011). However, a few studies have reported no trend (Zorn et al., 1999; Seo et al., 2000; Lackner et al., 2005; Sripada et al., 2007), and one (Berling and Wolner-Hanssen, 1997) has reported an increase in the percentage of sperm with normal forms.
While quantifying the alteration in sperm morphology remains difficult, morphology seems to be more and more considered as a specific indicator of male fertility (Menkveld, 2010; Slama et al., 2002) and might be considered as a valuable indicator of the impact of environmental factors at the level of the testis (Auger et al., 2001; Auger, 2010).
Links with possible factors
These observed trends in sperm parameters might be linked to the effects of environmental factors, including endocrine disruptors. They might also be linked to other known semen altering factors that would have changed over the study period, like an increase in body mass index (BMI), stress, nutrition or infections. The fact that we did not find a decrease in motility seems however less consistent with a major role of BMI or stress (Sharpe, 2010; Li et al., 2011). To support an environmental link, it could be interesting to complete the study with an age–period–cohort design.
These trends could also be the late stage expression of a longer process of decline (Joffe, 2010) more difficult to bring out. Additionally to direct effects of endocrine disruptors, trans-generational epigenetic effects at low doses during in utero gonadic development seem to be responsible for such effects in animals (Manikkam et al., 2012). This could account, together with differences in exposure over time, for the nonsynchronous decrease in semen quality in different countries or areas. Our results emphasize the need to sustain research efforts on this issue.
Conclusion
In conclusion, we observed, among a sample over 26 000 men of reproductive age from the whole of France, partners of totally infertile women, a continuous decrease in semen concentration between 1989 and 2005, of about 1.9% per year. We argue that this sample is close to the general population and is by far the most important sample of men studied in France until now; and, to our knowledge, it is one of the largest studied samples in the world. We also observed in this sample a decrease in the percentage of sperm with morphologically normal sperm. These results indicate a severe and generalized decrease in semen quality in France, possibly since the 1970s, which constitutes a serious public health warning.
Besides fertility outcomes, semen quality is a sentinel indicator of gamete deterioration and thus should be considered as a biomarker of the resulting development outcomes (Joffe, 2010). This issue could be a growing cause of concern for the next generation's health. Furthermore, semen quality was surprisingly correlated to life expectancy in a recent report (Jensen et al., 2009). All these aspects strengthen the need to implement gamete quality monitoring systems, for which infertility clinic data and the specific methods we employed might be considered valuable tools.
Supplementary data
Supplementary data are available at http://humrep.oxfordjournals.org/.
Authors’ roles
M.R. and J.L.M. contributed to the conception and the design of the study. M.R. conducted the statistical analysis and J.L.M. did the discussion of the results. Both drafted the manuscript. V.W. was associated with the design of the study and supervised the statistical analysis. J.D. and D.R. provided data, were associated with the design of the study and the discussion, and reviewed the manuscript for important intellectual content. All authors approved the final version submitted for publication.
Funding
No specific funding was sought for this study.
Conflict of interest
The authors declare no conflicts of interest.
Supplementary Material
Acknowledgements
The authors are grateful to all ART centres for contributing to the Fivnat database. They also thank their colleagues from the Institut de Veille Sanitaire who were very helpful: Fréderic De Bels, Alain Le Tertre, Yann Le Strat, Daniel Eilstein, Edwige Bertrand, Nathalie Velly, Agnès Lefranc and Georges Salines. Thanks also to Pr Catherine Poirot from Tenon Hospital and Paris University for her precious concealing on measurement methods.
References
- Adiga SK, Jayaraman V. Declining semen quality among south Indian infertile men: A retrospective study. J Hum Reprod Sci. 2008;1:15–18. doi: 10.4103/0974-1208.38972. KGUDaKP. [DOI] [PMC free article] [PubMed] [Google Scholar]
- Almagor M, Ivnitzki I, Yaffe H, Baras M. Changes in semen quality in Jerusalem between 1990 and 2000: a cross-sectional and longitudinal study. Arch Androl. 2003;2:139–144. doi: 10.1080/01485010390129296. [DOI] [PubMed] [Google Scholar]
- Andolz P, Bielsa MA, Vila J. Evolution of semen quality in North-eastern Spain: a study in 22 759 infertile men over a 36 year period. Hum Reprod. 1999;3:731–735. doi: 10.1093/humrep/14.3.731. [DOI] [PubMed] [Google Scholar]
- Auger J. Assessing human sperm morphology: top models, underdogs or biometrics? Asian J Androl. 2010;1:36–46. doi: 10.1038/aja.2009.8. [DOI] [PMC free article] [PubMed] [Google Scholar]
- Auger J, Jouannet P. Evidence for regional differences of semen quality among fertile French men. Federation Francaise des Centres d'Etude et de Conservation des Oeufs et du Sperme humains. Hum Reprod. 1997;4:740–745. doi: 10.1093/humrep/12.4.740. [DOI] [PubMed] [Google Scholar]
- Auger J, Kunstmann JM, Czyglik F, Jouannet P. Decline in semen quality among fertile men in Paris during the past 20 years. N Engl J Med. 1995;5:281–285. doi: 10.1056/NEJM199502023320501. [DOI] [PubMed] [Google Scholar]
- Auger J, Eustache F, Andersen AG, Irvine DS, Jorgensen N, Skakkebaek NE, Suominen J, Toppari J, Vierula M, Jouannet P. Sperm morphological defects related to environment, lifestyle and medical history of 1001 male partners of pregnant women from four European cities. Hum Reprod. 2001;12:2710–2717. doi: 10.1093/humrep/16.12.2710. [DOI] [PubMed] [Google Scholar]
- Axelsson J, Rylander L, Rignell-Hydbom A, Giwercman A. No secular trend over the last decade in sperm counts among Swedish men from the general population. Hum Reprod. 2011;5:1012–1016. doi: 10.1093/humrep/der045. [DOI] [PubMed] [Google Scholar]
- Berling S, Wolner-Hanssen P. No evidence of deteriorating semen quality among men in infertile relationships during the last decade: a study of males from Southern Sweden. Hum Reprod. 1997;5:1002–1005. doi: 10.1093/humrep/12.5.1002. [DOI] [PubMed] [Google Scholar]
- Blanchard M, Haguenoer K, Apert A, Poret H, Barthelemy C, Royere D, Guerif F. Sperm morphology assessment using David's classification: time to switch to strict criteria? Prospective comparative analysis in a selected IVF population. Int J Androl. 2011;2:145–152. doi: 10.1111/j.1365-2605.2010.01066.x. [DOI] [PubMed] [Google Scholar]
- Bonde JP, Ramlau-Hansen CH, Olsen J. Trends in sperm counts: the saga continues. Epidemiology. 2011;5:617–619. doi: 10.1097/EDE.0b013e318223442c. [DOI] [PubMed] [Google Scholar]
- Box GEP, Cox DR. An analysis of transformations (with discussion) J R Statist Soc. 1964;26:211–252. [Google Scholar]
- Bujan L, Mansat A, Pontonnier F, Mieusset R. Time series analysis of sperm concentration in fertile men in Toulouse, France between 1977 and 1992. BMJ. 1996;7029:471–472. doi: 10.1136/bmj.312.7029.471. [DOI] [PMC free article] [PubMed] [Google Scholar]
- Carlsen E, Giwercman A, Keiding N, Skakkebaek NE. Evidence for decreasing quality of semen during past 50 years. BMJ. 1992;6854:609–613. doi: 10.1136/bmj.305.6854.609. [DOI] [PMC free article] [PubMed] [Google Scholar]
- Chen Z, Isaacson KB, Toth TL, Godfrey-Bailey L, Schiff I, Hauser R. Temporal trends in human semen parameters in New England in the United States, 1989–2000. Arch Androl. 2003;5:369–374. doi: 10.1080/0145010390219700. [DOI] [PubMed] [Google Scholar]
- Cooper TG, Noonan E, von ES, Auger J, Baker HW, Behre HM, Haugen TB, Kruger T, Wang C, Mbizvo MT, et al. World Health Organization reference values for human semen characteristics. Hum Reprod Update. 2010a;3:231–245. doi: 10.1093/humupd/dmp048. [DOI] [PubMed] [Google Scholar]
- De Boor C. A Practical Guide to Splines. New York: Springer-Verlag; 1978. [Google Scholar]
- de Mouzon J, Thonneau P, Spira A, Multigner L. Declining sperm count. Semen quality has declined among men born in France since 1950. BMJ. 1996;7048:43–45. doi: 10.1136/bmj.313.7048.43. [DOI] [PMC free article] [PubMed] [Google Scholar]
- de Saint Pol T. Evolution of obesity by social status in France, 1981–2003. Econ Hum Biol. 2009;3:398–404. doi: 10.1016/j.ehb.2009.06.002. [DOI] [PubMed] [Google Scholar]
- Feki NC, Abid N, Rebai A, Sellami A, Ayed BB, Guermazi M, Bahloul A, Rebai T, Ammar LK. Semen quality decline among men in infertile relationships: experience over 12 years in the South of Tunisia. J Androl. 2009;5:541–547. doi: 10.2164/jandrol.108.005959. [DOI] [PubMed] [Google Scholar]
- Fisch H. Declining worldwide sperm counts: disproving a myth. Urol Clin North Am. 2008;2:137–146. doi: 10.1016/j.ucl.2008.01.001. , vii. [DOI] [PubMed] [Google Scholar]
- Gaspari L, Paris F, Jandel C, Kalfa N, Orsini M, Daures JP, Sultan C. Prenatal environmental risk factors for genital malformations in a population of 1442 French male newborns: a nested case-control study. Hum Reprod. 2011;11:3155–3162. doi: 10.1093/humrep/der283. [DOI] [PubMed] [Google Scholar]
- Itoh N, Kayama F, Tatsuki TJ, Tsukamoto T. Have sperm counts deteriorated over the past 20 years in healthy, young Japanese men? Results from the Sapporo area. J Androl. 2001;1:40–44. [PubMed] [Google Scholar]
- Jensen TK, Jacobsen R, Christensen K, Nielsen NC, Bostofte E. Good semen quality and life expectancy: a cohort study of 43 277 men. Am J Epidemiol. 2009;5:559–565. doi: 10.1093/aje/kwp168. [DOI] [PubMed] [Google Scholar]
- Joffe M. What has happened to human fertility? Hum Reprod. 2010;2:295–307. doi: 10.1093/humrep/dep390. [DOI] [PubMed] [Google Scholar]
- Jorgensen N, Andersen AG, Eustache F, Irvine DS, Suominen J, Petersen JH, Andersen AN, Auger J, Cawood EH, Horte A, et al. Regional differences in semen quality in Europe. Hum Reprod. 2001;5:1012–1019. doi: 10.1093/humrep/16.5.1012. [DOI] [PubMed] [Google Scholar]
- Jorgensen N, Carlsen E, Nermoen I, Punab M, Suominen J, Andersen AG, Andersson AM, Haugen TB, Horte A, Jensen TK, et al. East-West gradient in semen quality in the Nordic-Baltic area: a study of men from the general population in Denmark, Norway, Estonia and Finland. Hum Reprod. 2002;8:2199–2208. doi: 10.1093/humrep/17.8.2199. [DOI] [PubMed] [Google Scholar]
- Jorgensen N, Vierula M, Jacobsen R, Pukkala E, Perheentupa A, Virtanen HE, Skakkebaek NE, Toppari J. Recent adverse trends in semen quality and testis cancer incidence among Finnish men. Int J Androl. 2011;4(Pt 2):e37–e48. doi: 10.1111/j.1365-2605.2010.01133.x. [DOI] [PMC free article] [PubMed] [Google Scholar]
- Kunzle R, Mueller MD, Huber AW, Drescher H, Bersinger NA. Seasonality in human semen quality of smokers and non-smokers: effect of temperature. Asian J Androl. 2004;3:243–247. [PubMed] [Google Scholar]
- Lackner J, Schatzl G, Waldhor T, Resch K, Kratzik C, Marberger M. Constant decline in sperm concentration in infertile males in an urban population: experience over 18 years. Fertil Steril. 2005;6:1657–1661. doi: 10.1016/j.fertnstert.2005.05.049. [DOI] [PubMed] [Google Scholar]
- Levine RJ. Seasonal variation of semen quality and fertility. Scand J Work Environ Health. 1999;25(suppl 1):34–37. [PubMed] [Google Scholar]
- Li Y, Lin H, Li Y, Cao J. Association between socio-psycho-behavioral factors and male semen quality: systematic review and meta-analyses. Fertil Steril. 2011;1:116–123. doi: 10.1016/j.fertnstert.2010.06.031. [DOI] [PubMed] [Google Scholar]
- Manikkam M, Guerrero-Bosagna C, Tracey R, Haque MM, Skinner MK. Transgenerational actions of environmental compounds on reproductive disease and identification of epigenetic biomarkers of ancestral exposures. PLoS One. 2012;2:e31901. doi: 10.1371/journal.pone.0031901. [DOI] [PMC free article] [PubMed] [Google Scholar]
- Menkveld R. Clinical significance of the low normal sperm morphology value as proposed in the fifth edition of the WHO Laboratory Manual for the Examination and Processing of Human Semen. Asian J Androl. 2010;1:47–58. doi: 10.1038/aja.2009.14. [DOI] [PMC free article] [PubMed] [Google Scholar]
- Menkveld R, Holleboom CA, Rhemrev JP. Measurement and significance of sperm morphology. Asian J Androl. 2011;1:59–68. doi: 10.1038/aja.2010.67. [DOI] [PMC free article] [PubMed] [Google Scholar]
- Moreau C, Bouyer J, Ducot B, Spira A, Slama R. When do involuntarily infertile couples choose to seek medical help? Fertil Steril. 2010;3:737–744. doi: 10.1016/j.fertnstert.2008.10.011. [DOI] [PubMed] [Google Scholar]
- Mukhopadhyay D, Varghese AC, Pal M, Banerjee SK, Bhattacharyya AK, Sharma RK, Agarwal A. Semen quality and age-specific changes: a study between two decades on 3,729 male partners of couples with normal sperm count and attending an andrology laboratory for infertility-related problems in an Indian city. Fertil Steril. 2010;7:2247–2254. doi: 10.1016/j.fertnstert.2009.01.135. [DOI] [PubMed] [Google Scholar]
- Prisant N, Cohen-Bacrie P, Amar E, Belaisch-Allart J, Cohen-Bacrie M, Olivennes F, Aubriot FX, Belloc S. Teratozoospermia, myth or reality? A 10-years retrospective study on 101 404 consecutive sperm samples. Gynecol Obstet Fertil. 2011;3:136–140. doi: 10.1016/j.gyobfe.2010.11.005. [DOI] [PubMed] [Google Scholar]
- R Development Core Team. R: A language and environment for statistical computing R. Vienne, Austria: Foundation for Statistical Computing; 2004. [Google Scholar]
- Sasco AJ, Grizeau D, Pobel D, Chatard O, Danzon M. [Smoking and social class in France 1974–1991] Bull Cancer. 1994;5:355–359. [PubMed] [Google Scholar]
- Schwartz D, Laplanche A, Jouannet P, David G. Within-subject variability of human semen in regard to sperm count, volume, total number of spermatozoa and length of abstinence. J Reprod Fertil. 1979;2:391–395. doi: 10.1530/jrf.0.0570391. [DOI] [PubMed] [Google Scholar]
- Seo JT, Rha KH, Park YS, Lee MS. Semen quality over a 10-year period in 22,249 men in Korea. Int J Androl. 2000;4:194–198. doi: 10.1046/j.1365-2605.2000.00226.x. [DOI] [PubMed] [Google Scholar]
- Sharpe RM. Environmental/lifestyle effects on spermatogenesis. Philos Trans R Soc Lond B Biol Sci. 2010;1546:1697–1712. doi: 10.1098/rstb.2009.0206. [DOI] [PMC free article] [PubMed] [Google Scholar]
- Shine R, Peek J, Birdsall M. Declining sperm quality in New Zealand over 20 years. N Z Med J. 2008;1287:50–56. [PubMed] [Google Scholar]
- Skakkebaek NE, Rajpert-De ME, Main KM. Testicular dysgenesis syndrome: an increasingly common developmental disorder with environmental aspects. Hum Reprod. 2001;5:972–978. doi: 10.1093/humrep/16.5.972. [DOI] [PubMed] [Google Scholar]
- Slama R, Eustache F, Ducot B, Jensen TK, Jorgensen N, Horte A, Irvine S, Suominen J, Andersen AG, Auger J, et al. Time to pregnancy and semen parameters: a cross-sectional study among fertile couples from four European cities. Hum Reprod. 2002;2:503–515. doi: 10.1093/humrep/17.2.503. [DOI] [PubMed] [Google Scholar]
- Splingart C, Frapsauce C, Veau S, Barthelemy C, Royere D, Guerif F. Semen variation in a population of fertile donors: evaluation in a French centre over a 34-year period. Int J Androl. 2012;3:467–474. doi: 10.1111/j.1365-2605.2011.01229.x. [DOI] [PubMed] [Google Scholar]
- Sripada S, Fonseca S, Lee A, Harrild K, Giannaris D, Mathers E, Bhattacharya S. Trends in semen parameters in the northeast of Scotland. J Androl. 2007;2:313–319. doi: 10.2164/jandrol.106.000729. [DOI] [PubMed] [Google Scholar]
- Swan SH, Elkin EP, Fenster L. Have sperm densities declined? A reanalysis of global trend data. Environ Health Perspect. 1997;11:1228–1232. doi: 10.1289/ehp.971051228. [DOI] [PMC free article] [PubMed] [Google Scholar]
- Swan SH, Brazil C, Drobnis EZ, Liu F, Kruse RL, Hatch M, Redmon JB, Wang C, Overstreet JW. Geographic differences in semen quality of fertile U.S. males. Environ Health Perspect. 2003;4:414–420. doi: 10.1289/ehp.5927. [DOI] [PMC free article] [PubMed] [Google Scholar]
- Wilcox AJ. On sperm counts and data responsibility. Epidemiology. 2011;5:615–616. doi: 10.1097/EDE.0b013e318225036d. [DOI] [PubMed] [Google Scholar]
- Wood SN. Generalized Additive Models: An Introduction with R. Boca Raton: Chapman&Hall/CRC; 2006. [Google Scholar]
- Zheng Y, Bonde JP, Ernst E, Mortensen JT, Egense J. Is semen quality related to the year of birth among Danish infertility clients? Int J Epidemiol. 1997;6:1289–1297. doi: 10.1093/ije/26.6.1289. [DOI] [PubMed] [Google Scholar]
- Zorn B, Virant-Klun I, Verdenik I, Meden-Vrtovec H. Semen quality changes among 2343 healthy Slovenian men included in an IVF-ET programme from 1983 to 1996. Int J Androl. 1999;3:178–183. doi: 10.1046/j.1365-2605.1999.00167.x. [DOI] [PubMed] [Google Scholar]
Associated Data
This section collects any data citations, data availability statements, or supplementary materials included in this article.