

Abstract
Asymptomatic infection is an important obstacle for controlling disease in countries where malaria is endemic. Because asymptomatic carriers do not seek treatment for their infections, they can have high levels of gametocytes and constitute a reservoir available for new infection. We employed a sample pooling/PCR-based molecular detection strategy for screening malaria infection in residents from areas of Myanmar where malaria is endemic. Blood samples (n = 1,552) were collected from residents in three areas of malaria endemicity (Kayin State, Bago, and Tanintharyi regions) of Myanmar. Two nested PCR and real-time PCR assays showed that asymptomatic infection was detected in about 1.0% to 9.4% of residents from the surveyed areas. The sensitivities of the two nested PCR and real-time PCR techniques were higher than that of microscopy examination (sensitivity, 100% versus 26.4%; kappa values, 0.2 to 0.5). Among the three regions, parasite-positive samples were highly detected in subjects from the Bago and Tanintharyi regions. Active surveillance of residents from regions of intense malaria transmission would reduce the risk of morbidity and mitigate transmission to the population in these areas of endemicity. Our data demonstrate that PCR-based molecular techniques are more efficient than microscopy for nationwide surveillance of malaria in countries where malaria is endemic.
INTRODUCTION
Myanmar is the largest country in mainland Southeast Asia and has three natural regions, the western hills, the central belt, and the Shan Plateau on the east, with a continuation of this highland in the southern region of Tanintharyi. The malaria burden in Myanmar is the heaviest among the Greater Mekong Subregion (GMS) nations. Over half of the malaria cases and about 75% of the malaria deaths in the GMS in 2007 occurred in Myanmar (1, 2). The annual malaria incidence in Myanmar decreased from 1998 to 2007. Despite this progress, investments in malaria control in Myanmar are moderate compared with those of other GMS countries. In 2008, malaria incidence rose again from 9.0% to 10.8% (3). In 2009, there were more than 591,000 reported malaria cases and 1,088 persons were reported to have died from this disease (4).
Asymptomatic infection, mainly by Plasmodium falciparum, is an important obstacle to controlling malaria. Because asymptomatic carriers do not seek treatment for the infection, they can have high levels of gametocytes and constitute a reservoir available for infection of newly hatched mosquitoes (5, 6). The systematic identification and treatment of asymptomatic carriers might reduce disease transmission by reducing the pool of parasites carried by these individuals. In countries where malaria is endemic, a significant proportion of P. falciparum infections are asymptomatic or subclinical. Asymptomatic carriage levels detected by microscopy and/or other methods have been reported to be as high as 39%, 8.4%, and 1.36 to 7.7% in African countries, India, and Thailand, respectively (6–12). However, surveillance data from Myanmar nationwide are not available to date. Therefore, active case detection is required to decrease the level of malaria endemicity, and molecular diagnostics may be a useful tool for implementation of surveillance in countries of endemicity, including Myanmar.
The most common method for malaria diagnosis is the microscopic examination of Giemsa-stained thick and thin blood films (13). However, it is well documented that microscopy has limitations in this regard. It is time-consuming, and misdiagnosis of the infecting species is common if the microscopist lacks experience and/or when the parasitemia is low, as often found in asymptomatic carriers (14). Alternative techniques for laboratory diagnosis of malaria have been developed for use in areas of malaria endemicity and areas of nonendemicity. Serological diagnostic methods and new rapid diagnostic tests (RDT) for antigen detection provide results in 2 to 15 min and offer useful alternatives to microscopy in situations where reliable microscopic diagnosis is not available. However, before malaria RDTs can be widely adopted, several issues remain to be addressed, including improving their accuracy, lowering their cost, and ensuring their adequate performance under adverse field conditions (15).
PCR-based molecular methods for malaria parasite detection are relatively simple and provide improved sensitivity compared to microscopy and RDTs, particularly in cases with low-level parasitemia. Numerous PCR assays for malaria diagnosis, including conventional and real-time PCR techniques, have been developed on mostly genus- or species-specific sequences of the Plasmodium 18S subunit rRNA gene (16–20). PCR-based assays have various advantages over microscopy and RDT, and they are highly specific and capable of high sensitivity (14, 17, 20).
Pooling samples prior to diagnostic testing can improve efficiency and diagnostic test performance for low-prevalence antibody and gene targets in a population. This technique has been successfully applied to blood donor screening for antibodies to HIV (21), hepatitis B virus (22), and hepatitis C virus (23) and to genetic diagnosis of virus infections using PCR (24, 25). Recently, this pooling strategy has also been employed to screen malaria parasite infections and compare microscopy and real-time PCR for large numbers of African samples (26), and it may very useful for large-scale surveillance study in countries where malaria is endemic.
In Myanmar, one of the countries of high malaria endemicity, conventional microscopic examination performed by highly qualified microscopists as the gold standard method may be unavailable in local health centers but may be required for the appearance of drug-resistant malaria, for active case detection for the control of low-parasitemia reservoirs, and to decrease malaria prevalence through nationwide RDT kit distribution financially supported by the World Health Organization, nongovernment or nonprofit organizations, and communities. However, no information is available regarding comparisons of parasite detection techniques used in Myanmar, including not only conventional microscopy but also molecular detection methods, nested PCR, and real-time PCR. This information may be required for both quality control and exploration of the impact of submicroscopic parasite densities on nationwide surveillance outcomes.
We employed high-throughput sample pooling/PCR-based techniques, including real-time PCR and two nested PCR assays, for screening malaria parasite infections in asymptomatic carriers who were residents of areas of Myanmar where malaria is endemic and compared these methods with conventional microscopy.
MATERIALS AND METHODS
Patient enrollment and sample collection.
Samples used in this study were obtained from residents in three regions of Myanmar where malaria is endemic: the Tanintharyi region (n = 880), Kayin State (n = 619), and the Bago region (n = 53) (Fig. 1). This study was approved by the ethics committee of the Department of Medical Research (Lower Myanmar), Myanmar, and the Institutional Review Board at Kangwon National University Hospital, South Korea. For each Myanmar subject, a blood sample was collected and used to prepare both a thick smear and an application to Whatman filter paper (GE Healthcare Bio-Sciences, Westborough, MA). Blood smears were interpreted on site by a trained microscopist. For quality assurance, a random sample of 8% of blood smears was reviewed by a second trained microscopist, who was masked to the initial smear results. Filter papers with blood spots were placed in individual plastic bags with desiccant and stored at −20°C. These were then transported to South Korea. Forty to 50 μl of human blood was blotted as a single spot and dried on filter paper. The single blood spot from each filter paper was excised and then incubated overnight at 4°C in 1 ml of 0.5% saponin in phosphate-buffered saline (PBS). To avoid cross-contamination, the punch was cleaned in 70% ethanol and then used to punch a clean filter paper 3 times before cutting a new sample. During the process, measures were taken to prevent cross-contamination. Genomic DNA (gDNA) from plates of punches was extracted using a QIAamp DNA blood minikit (Qiagen, Germantown, MD) in accordance with the manufacturer's instructions. Genomic DNA was eluted into 40 μl of elution buffer and used immediately or stored at −20°C.
FIG 1.
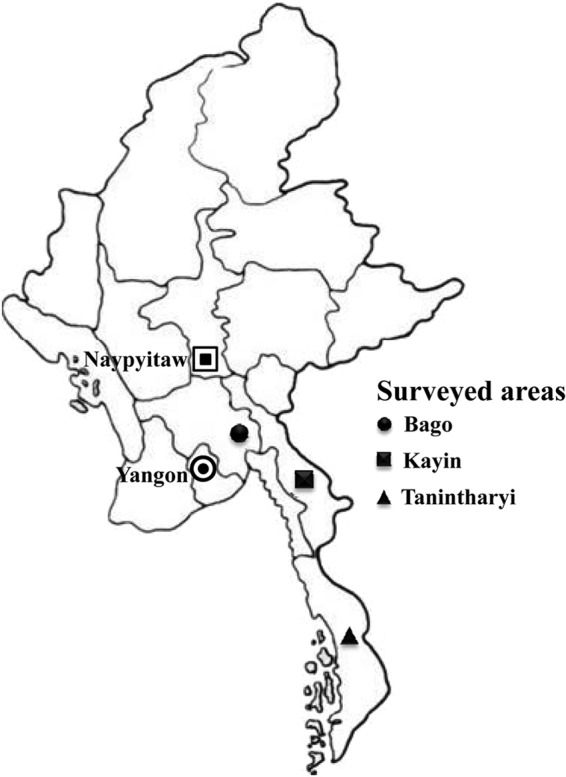
Map of three surveyed areas in Myanmar.
Design and validation of the genus/species assay with pooling gDNA samples.
The sample processing and schematic assay workflow were performed as previously described (26). Microscopy-positive samples were individually tested in duplicate using 2 μl of extracted gDNA. For microscopy-negative samples, 5 μl quantities of these samples were combined in pools of four original samples. Then, 4 μl of pooled gDNA was used for the genus/species assay.
Nested PCR-1.
The nested PCR-1 strategy was based upon primers described previously (27). The first amplification reaction used 4 μl of pooled gDNA or 2 μl of individual gDNA in a 20-μl reaction mixture (0.25 mM each deoxynucleoside triphosphate [dNTP], 10 mM Tris-HCl [pH 9.0], 30 mM KCl, 1.5 mM MgCl2, and 1.0 units of Taq polymerase [Bioneer, Seoul, South Korea] containing 0.02 μM primers [rPLU1_F and rPLU5_R]). The second amplification was accomplished by using 2 μl of the first product as a template under the same 20-μl reaction mixture conditions. The universal primers (rPLU3_F and rPLU4_R) were constructed. The reactions were as follows: step 1, 95°C for 5 min; step 2, denaturation at 95°C for 30 s; step 3, annealing at 55°C for 1 min; step 4, extension at 72°C for 2 min in the first PCR and 30 s in the second PCR. Steps 2 to 4 were repeated 30 times with the annealing temperature changed to 60°C and step 4 performed for 10 min. The amplified products were visualized in 2% agarose gels stained with ethidium bromide. Species-specific nested PCR primers were conducted as described in previous studies (16, 27), except those for Plasmodium ovale. PCR conditions were the same as those for genus-specific nested PCR, with species-specific primers for P. falciparum (rFAL1_F and rFAL2_R), Plasmodium vivax (rVIV1_F and rVIV1_R), Plasmodium malariae (rMAL1_F and rMAL2_R), and P. ovale (rOVA3_R and rOVA4_R).
Nested PCR-2.
For nested PCR-2, the species-specific nucleotide sequences of the 18S rRNA genes of P. falciparum, P. vivax, P. malariae, and P. ovale were amplified as described previously (17). The first amplification reaction used 4 μl of pooled gDNA or 2 μl of individual gDNA in a 20-μl reaction mixture (0.25 mM each dNTP, 10 mM Tris-HCl [pH 9.0], 30 mM KCl, 1.5 mM MgCl2, and 1.0 units of Taq polymerase) containing 0.02 μM primers (P1_F and P2_R). The DNA amplification was conducted under the following conditions: 95°C for 5 min and then 35 cycles at 95°C for 30 s, 58°C for 1.5 min, and 72°C for 1 min, followed by a final extension at 72°C for 5 min. The first PCR product was diluted 20-fold in sterile water. One microliter of this solution was used in the second amplification. The reactions were performed at step 1, 95°C for 5 min; step 2, denaturation at 95°C for 30 s; step 3, annealing at 60°C for 1 min; and step 4, extension at 72°C for 30 s. Steps 2 to 4 were repeated 20 times, and step 4 was performed for 10 min with the P1_F forward primer in combination with each species-specific reverse primer (F2_R for P. falciparum, V1_R for P. vivax, M1_R for P. malariae, and O2_R for P. ovale). The amplified products were visualized in 2% agarose gels stained with ethidium bromide.
Real-time PCR.
Primer and probe sequences for the gene encoding the 18S Plasmodium rRNA genes were performed as described previously (26). Genus-specific primers (Spp_F and Spp_R) and probe (Pan-spp probe labeled with 5′-6-carboxyfluorescein [FAM] and 3′-ZEN as the reporter and the quencher, respectively) and species-specific primers and probes each specific to P. falciparum (Pf-1_F and Pf-2_R and Pf-probe dually labeled with 5′-FAM and 3′-ZEN), P. vivax (Pv-1_F and Pv-2_R and Pv-probe dually labeled with 5′-hexachloro-fluorescein [HEX] and 3′-ZEN), P. malariae (Pm-1_F and Pm-2_R and Pm-probe dually labeled with 5′-FAM and 3′-ZEN), P. ovale (Po-1_F and Po-2_R and Po-probe dually labeled with 5′-HEX and 3′-ZEN) and human glyceraldehyde-3-phosphate dehydrogenase (GAPDH) (GAPDH_F and GAPDH_R and GAPDH-probe dually labeled with 5′-FAM and 3′-ZEN) were constructed (Table 1). Real-time PCR was carried out with 25-μl reaction mixtures consisting of 2 μl of gDNA and 12.5 μl of 2× probe master mix (Mbiotech, Los Angeles, CA), with forward and reverse primers at 500 nM and double-quenched probe at 250 nM. All real-time PCRs were run using an Applied Biosystems 7300 system. The cycling conditions were 95°C for 10 min, 40 cycles of 95°C for 10 s, and 60°C for 65 s. All reactions were run in duplicate on reaction plates that included positive controls from patients infected with Plasmodium gDNA, healthy human gDNA, and negative controls. The sensitivities of the assays were determined by evaluating dilutions of Plasmodium-infected patients' gDNA. All real-time PCRs were run with the Applied Biosystems 7300 system (Applied Biosystems, Foster City, CA) and all amplification curves were evaluated with ABI 7300 system sequence detection software (version 1.3.1; Applied Biosystems).
TABLE 1.
Primers and probes for three PCR-based detection methods
| Primer | Primer and probe sequences (5′ to 3′)a | Target species or genus | Amplicon size (bp) | Reference |
|---|---|---|---|---|
| Nested PCR-1 | ||||
| rPLU1_F | TCA AAG ATT AAG CCA TGC AAG TGA | Plasmodium | ∼1,670 | 27 |
| rPLU5_R | CCT GTT GTT GCC TTA AAC TTC | |||
| rPLU3_F | TTT TTA TAA GGA TAA CTA CGG AAA AGC TGT | Plasmodium | 240 | 27 |
| rPLU4_R | TAC CCG TCA TAG CCA TGT TAG GCC AAT ACC | |||
| rFAL1_F | TTA AAC TGG TTT GGG AAA ACC AAA TAT ATT | P. falciparum | 206 | 27 |
| rFAL2_R | ACA CAA TGA ACT CAA TCA TGA CTA CCC GTC | |||
| rVIV1_F | CGC TTC TAG CTT AAT CCA CAT AAC TGA TAC | P. vivax | 121 | 27 |
| rVIV1_R | ACT TCC AAG CCG AAG CAA AGA AAG TCC TTA | |||
| rMAL1_F | ATA ACA TAG TTG TAC GTT AAG AAT AAC CGC | P. malariae | 145 | 27 |
| rMAL2_R | AAA ATT CCC ATG CAT AAA AAA TTA TAC AAA | |||
| rOVA3_F | CGG GGA AAT TTC TTA GAT TGC | P. ovale | 456 | 27 |
| rOVA4_R | GAG AAA CAG CAT GAA TTG CG | |||
| Nested PCR-2 | ||||
| P1_F | ACG ATC AGA TAC CGT CGT AAT CTT | Plasmodium | ∼110 | 17 |
| P2_R | GAA CCC AAA GAC TTT GAT TTC TCA T | |||
| F2_R | CAA TCT AAA AGT CAC CTC GAA AGA TG | P. falciparum | ∼110 | 17 |
| V1_R | CAA TCT AAG AAT AAA CTC CGA AGA GAA A | P. vivax | ∼110 | 17 |
| M1_R | GGA AGC TAT CTA AAA GAA ACA CTC ATA T | P. malariae | ∼110 | 17 |
| O2_R | ACT GAA GGA AGC AAT CTA AGA AAT TT | P. ovale | ∼110 | 17 |
| Real-time PCR | ||||
| Spp_F | GTT AAG GGA GTG AAG ACG ATC AGA TA | Plasmodium | ∼157 | 26 |
| Spp_R | AAC CCA AAG ACT TTG ATT TCT CAT AAG | |||
| Pan-spp probe | FAM-TCG TAA TCT TAA CCA TAA AC | |||
| Pf-1_F | ATT GCT TTT GAG AGG TTT TGT TAC TTT | P. falciparum | 95 | 26 |
| Pf-2_R | GCT GTA GTA TTC AAA CAC AAT GAA CTC AA | |||
| Pf-probe | FAM-CAT AAC AGA CGG GTA GTC AT | |||
| Pv-1_F | CGCTTCTAGCTTAATCCACATAACTG | P. vivax | 142 | 19 |
| Pv-2_R | AATTTACTCAAAGTAACAAGGACTTCCAAG | |||
| Pv-probe | HEX-CGCATTTTGCTATTATGT | |||
| Pm-1_F | AGT TAA GGG AGT GAA GAC GAT CAG A | P. malariae | 166 | 26 |
| Pm-2_R | CAA CCC AAA GAC TTT GAT TTC TCA TAA | |||
| Pm-probe | FAM-ATG AGT GTT TCT TTT AGA TAG C | |||
| Po-1_F | CCG ACT AGG TTT TGG ATG AAA GAT TTT T | P. ovale | ∼114 | 26 |
| Po-2_R | CAA CCC AAA GAC TTT GAT TTC TCA TAA | |||
| Po-probe | HEX-CGA AAG GAA TTT TCT TAT T | |||
| GAPDH_F | CCT CCC GCT TCG CTC TCT | Homo sapiens | 65 | 26 |
| GAPDH_R | GCT GGC GAC GCA AAA GA | |||
| GAPDH-probe | FAM-CCT CCT GTT CGA CAG TCA GCC GC | |||
FAM and HEX denote fluorescent dyes.
Nonconcordant results.
All samples with nonconcordant results were reevaluated using both microscopy and PCR assays. The individual reading the blood films or running the PCR was blinded to the initial test results.
DNA sequence analysis.
All nonconcordant samples obtained by nested PCR-2 were confirmed by commercial sequencing analysis (Genentech, Daejeon, South Korea). The sequencing results were assembled and analyzed with Lasergene software (DNASTAR, Madison, WI).
Statistical analysis.
Data were entered into Microsoft Excel 2007 (Microsoft, Redmond, WA) and were imported into PASW Statistics 18.0 (SPSS Inc., Chicago, IL) for analysis. Kappa coefficients were used to quantify agreement among diagnostic methods. Confidence intervals were computed based on the exact binomial distribution. The sensitivities and specificities of peripheral blood microscopy diagnoses were calculated using nested PCR-2 as the reference standard.
RESULTS
Comparison of microscopy, two kinds of nested PCR assays, and real-time PCR.
For the genus-specific assay, blood samples from P. falciparum-infected patients were used to establish the limits of detection (LOD). The LOD were determined to be 1 to 0.1 parasite/μl for nested PCR and real-time PCR assays (Fig. 2A and B). There was almost perfect agreement among the three PCR-based methods (kappa values, 0.8 to 1.0). Compared with these PCR-based methods, microscopy showed moderate agreement, with kappa values of 0.4 to 0.5.
FIG 2.

Sensitivities of Plasmodium genus- and species-specific nested PCR and real-time PCR assays performed with serial dilutions of Plasmodium genomic DNA extracted from field samples. (A and B) Amplification with a Plasmodium genus-specific nested PCR and real-time PCR assays. (C to F) Amplification plots showing the P. falciparum, P. vivax, P. malariae, and P. ovale nested PCR-1 assays. (G to J) Amplification plots showing the P. falciparum, P. vivax, P. malariae, and P. ovale nested PCR-2 assays. (C, D, G, and H) Lanes 1, 1,000 parasites/μl; lanes 2, 500 parasites/μl; lanes 3, 100 parasites/μl; lanes 4, 50 parasites/μl; lanes 5, 10 parasites/μl; lanes 6, 5 parasites/μl; lanes 7, 1 parasite/μl; lanes 8, 0.1 parasite/μl; and lanes 9, 0 parasites/μl. (E, F, I, and J) Lanes 1, 200 parasites/μl; lanes 2, 100 parasites/μl; lanes 3, 50 parasites/μl; lanes 4, 25 parasites/μl; lanes 5, 10 parasites/μl; lanes 6, 5 parasites/μl; lanes 7, 1 parasite/μl; lanes 8, 0.1 parasite/μl; and lanes 9, 0 parasites/μl. (K to N) Amplification plots showing the P. falciparum, P. vivax, P. malariae, and P. ovale real-time PCR assays.
For the species-specific assay, blood samples from patients infected with P. falciparum, P. vivax, P. malaria, or P. ovale were used to establish the LOD (Fig. 2C to N). The LOD of P. falciparum, P. vivax, P. malariae, and P. ovale were 50 to 10, 5 to 1, 100 to 50, and 10 to 5 parasites/μl, respectively, in nested PCR-1 (Fig. 2C to F) and 0.1 to 1, 0.1 to 1, 1 to 5, and 1 to 5 parasites/μl, respectively, in nested PCR-2 (Fig. 2G to J). For the real-time PCR assay, the LOD of P. falciparum, P. vivax, P. malariae, and P. ovale were 1 to 5, 1 to 5, 5 to 10, and 10 to 25 parasites/μl, respectively (Fig. 2K to N). We tested the specificities of the assays by ensuring they did not amplify human gDNA. For detection of P. vivax and P. falciparum, microscopy showed fair agreement (kappa values, 0.2 to 0.5) with PCR-based methods, while nested PCR-1 displayed substantial concordance with the other two PCR-based methods. It is noteworthy that nested PCR-2 and real-time PCR have almost perfect agreement. For detection of P. malariae and P. ovale, the results for concordance cannot be presented because of the low numbers of samples.
Amplification and efficiency of the sample pooling strategy.
The 1,537 samples negative by microscopy were amplified by the pan-species assay in 385 pools of four samples each, resulting in 770 reactions by nested PCR (two steps) and real-time PCR (duplication). Because 31 of these pools were identified as positive, a further 248 amplifications were necessary to identify the 39 positive individual samples by each nested PCR and real-time PCR. The efficiency of pooling, calculated as the number of tests performed per total number of individual samples evaluated, was 0.33. In other words, our sample pooling strategy reduced laborious work and saved PCR mixture costs by approximately two-thirds.
Microscopy, two nested PCRs, and real-time PCR.
The results of microscopy and nested and real-time PCR are given in Table 2. Among these four methods, microscopy showed the lowest detection rate, with only 1% of samples (15 positive samples out of a total of 1,552) found to have malaria parasites. Of the Plasmodium-positive slides, 33.3% (5 samples) were positive for P. falciparum and 66.7% (10 samples) were positive for P. vivax. The mean density of P. falciparum was 7,855 parasites/μl (standard error of the mean [SEM], 3,257), with a range from 1,138 to 18,965 parasites/μl. For P. vivax, the mean density was 583 parasites/μl (SEM, 360), with a range from 12 to 3,776 parasites/μl. Within those samples, one microscopy-positive sample (12 parasites/μl by microscopy) failed to be detected by the other three PCR-based methods, while another sample (23 parasites/μl by microscopy) was not amplified by the nested PCR-1 method. Moreover, no mixed infection was observed by microscopy.
TABLE 2.
Comparison of results for microscopy and three PCR-based methods with the nested PCR-2 as the criterion standard for detection of asymptomatic malaria cases among residents of areas of Myanmar where malaria is endemic
| Method and results | Nested PCR-2a (n) |
Sensitivity (%) (95% CI) | Specificity (%) (95% CI) | PPV (%)b | NPV (%)c | ||
|---|---|---|---|---|---|---|---|
| Positive | Negative | Total | |||||
| Nested PCR-2 | |||||||
| Positive | 53 | 0 | 53 | 100 (93.2–100) | 100 (93.2–100) | 100 | 100 |
| Negative | 0 | 1,499 | 1,499 | ||||
| Total | 53 | 1,499 | 1,552 | ||||
| Real-time PCR | |||||||
| Positive | 53 | 0 | 53 | 100 (93.2–100) | 100 (99.7–100) | 100 | 100 |
| Negative | 0 | 1,499 | 1,499 | ||||
| Total | 53 | 1,499 | 1,552 | ||||
| Nested PCR-1 | |||||||
| Positive | 39 | 0 | 39 | 73.6 (60.4–83.6) | 100 (99.7–100) | 100 | 99.1 |
| Negative | 14 | 1,499 | 1,513 | ||||
| Total | 53 | 1,499 | 1,552 | ||||
| Microscopy | |||||||
| Positive | 14 | 1 | 15 | 26.4 (16.4–39.6) | 99.9 (99.6–99.9) | 93.3 | 97.5 |
| Negative | 39 | 1,498 | 1,537 | ||||
| Total | 53 | 1,499 | 1,552 | ||||
Detection method as gold standard.
Positive predictive value (PPV) = true positives (TP)/(TP + false positives [FP]) × 100%.
Negative predictive value (NPV) = true negatives (TN)/(TN + false negatives [FN]) × 100%.
Results revealed that nested PCR-1 has higher sensitivity (73.6% sensitivity; 95% confidence interval [CI], 60.4% to 83.6%) than that of microscopy (26.4% sensitivity [95% CI, 16.4% to 39.6%]) (Table 2). Among the 1,552 samples, 39 (2.5%) were positive by nested PCR-1. Of those, 20 (51.3%) samples were diagnosed as positive for P. vivax, 13 as positive for P. falciparum, and one as positive for P. malariae. Moreover, five samples with mixed infection were detected: two P. vivax plus P. malariae, one P. vivax plus P. falciparum, one P. vivax plus P. ovale, and one P. falciparum plus P. malariae (Table 3). The positive predictive values (PPV) and negative predictive values (NPV) were 93.3% and 97.5%, respectively, for microscopy diagnosis and 100% and 99.1%, respectively, for nested PCR-1 (Table 2).
TABLE 3.
Detailed comparison of microscopy, two nested PCRs, and real-time PCR for malaria parasite detection and species identification
| Species identification (no. of samples) by microscopy | Species identificationa (no. of samples) by: |
|||
|---|---|---|---|---|
| Nested PCR-1 | Nested PCR-2 | Real-time PCR | ||
| P. falciparum | 5 | Pf (5), Pf+Pv (0) | Pf (3), Pf+Pv (2) | Pf (3), Pf+Pv (2) |
| P. vivax | 10 | Pv (7), Pv+Pf (0), Pv+Pm (1), Pv+Pf+Pm (0), negative (2) | Pv (3), Pv+Pf (5), Pv+Pm (0), Pv+Pf+Pm (1), negative (1) | Pv (5), Pv+Pf (3), Pv+Pm (0), Pv+Pf+Pm (1), negative (1) |
| Negative | 1,537 | Negative (1,511), Pf (8), Pf+Pv (1), Pf +Pm (1), Pf+Pv+Pm (0), Pv (13), Pv+Pm (1), Pv+Po (1), Pf +Pv+Po (0), Pm (1) | Negative (1,498), Pf (10), Pf+Pv (20), Pf +Pm (0), Pf+Pv+Pm (2), Pv (5), Pv+Pm (0), Pv+Po (0), Pf +Pv+Po (1), Pm (1) | Negative (1,498), Pf (12), Pf+Pv (17), Pf +Pm (1), Pf+Pv+Pm (1), Pv (7), Pv+Pm (0), Pv+Po (0), Pf +Pv+Po (0), Pm (1) |
| Positive (n [%]) | 15 (1%) | 39 (2.5%) | 53 (3.4%) | 53 (3.4%) |
| Total | 1,552 | 1,552 | 1,552 | 1,552 |
Pf, Plasmodium falciparum; Pv, Plasmodium vivax; Pm, Plasmodium malariae; Po, Plasmodium ovale.
According to the comparison of results, nested PCR-2 and real-time PCR displayed higher sensitivities (100% sensitivity [95% CI, 93.2% to 100%]) than nested PCR-1 (73.6% sensitivity [95% CI, 60.4% to 83.6%]) for malaria parasite detection (Table 2). Overall, 53 (3.4%) of a total of 1,552 samples were detected as positive by real-time PCR. Of the positive samples, 22 (41.5%) of 53 positive samples were mixed P. vivax plus P. falciparum infections, 15 (28.3%) were P. falciparum, 12 (22.6%) were P. vivax, two (3.8%) were P. vivax plus P. falciparum plus P. malariae, one (1.9%) was P. malariae, and one (1.9%) was P. falciparum plus P. malaria (Table 3).
Nested PCR-2 and real-time PCR yielded similar results, as shown in Table 2. Two mixed infections with P. falciparum plus P. vivax by nested PCR-2 were shown to be P. vivax infection as diagnosed by real-time PCR; one mixed P. falciparum plus P. vivax infection in nested PCR-2 was shown to be P. falciparum infection diagnosed by real-time PCR; one mixed P. vivax plus P. falciparum plus P. malariae infection in nested PCR-2 was shown to be P. falciparum plus P. malariae infection diagnosed by real-time PCR; one mixed P. vivax plus P. falciparum plus P. ovale infection in nested PCR-2 was shown to be P. vivax plus P. falciparum infection as diagnosed by real-time PCR. The remaining 1,498 samples negative by nested PCR-2 were also negative in real-time PCR (Table 3). The nested PCR-2 amplification products confirmed the presence of Plasmodium species identified by sequencing analysis.
Geographical locations of malaria-positive samples.
In this study, 1,552 samples were collected from residents in three areas of malaria endemicity, the Tanintharyi region (n = 880), Kayin State (n = 619), and the Bago region (n = 53). Of a total of 53 positive samples, 42 (79.2%) positive samples were collected from the Tanintharyi region, 6 from Kayin State, and 5 from the Bago region. The results of detection in the Bago region showed the highest parasite-positive rate (9.4%), followed by the Tanintharyi region and Kayin State, with positive rates of 4.8% and 1.0%, respectively (Table 4).
TABLE 4.
Number of positive cases found in surveyed regions of endemicity in Myanmar
| Region | Total no. of samples | No. (%) of positive samples |
|---|---|---|
| Tanintharyi Division | 880 | 42 (4.8) |
| Bago Division | 53 | 5 (9.4) |
| Kayin State | 619 | 6 (1.0) |
| Total | 1,552 | 53 (3.4) |
DISCUSSION
In Myanmar, malaria is an important public health problem. The incidence of malaria, especially in the Myanmar-Thailand border area, has increased the malaria burden, which may become a significant challenge for the National Malaria Control Program. We collected blood samples from residents to investigate the frequency of asymptomatic malaria infection in rural areas of Myanmar using four detection methods.
Because asymptomatic populations typically have low parasite burdens (28), a sensitive screening test is essential and pooling samples can potentially diminish the sensitivity of detection of the test target in a pool of samples (29). We developed and applied a PCR-based pooled detection of malaria parasites using genomic DNA. Our study demonstrates high sensitivity and specificity and, by pooling four samples, significant resource savings compared with direct testing of individual samples in nested PCR-2 and real-time PCR assay. Thus, adaptation of this pooling strategy should take into account the predicted epidemiology of malaria in a larger study population.
Microscopy has traditionally been considered the gold standard test for malaria diagnosis. Under optimum conditions, microscopy can detect 50 parasites per μl of blood (30), but such sensitivity is rarely achieved under routine laboratory conditions. In this study, only 26.4% of nested PCR-2- and real-time PCR-positive samples were detected by microscopy. Additionally, one microscopy-positive sample was negative by PCR-based arrays. This phenomenon has been observed in other studies (31–33) and may have several causes. Systematic errors in thick-smear preparation can lead to false positives, other blood elements, or environmental particulate contamination (34).
The PCR-based method was used as the reference standard because of its high sensitivity and specificity and its advantages over microscopy, particularly in cases with low-level parasitemia (20, 35). In this study, we evaluated three well-established PCR methods for detecting malaria infection in residents of regions of Myanmar where malaria is endemic. The three PCR-based methods showed similar sensitivity in genus-specific tests. However, it is interesting to observe that nested PCR-1 showed a lower sensitivity in detecting Plasmodium spp., especially P. falciparum and P. malariae compared with nested PCR-2 and real-time PCR. The limited detection by nested PCR-1 resulted in 14 samples being positive in a genus-specific assay, while negative in a species-specific assay. Our results suggest that nested PCR-2 and real-time PCR may be highly suitable for asymptomatic malaria detection in large numbers of clinical samples from areas of endemicity.
In this study, we confirmed that some residents in our study areas have a high prevalence of asymptomatic malaria infection. The most important parasitological factor of those asymptomatic infections is that some Plasmodium species can either persist (P. malariae) or relapse (P. vivax and P. ovale) over prolonged periods. However, the degree to which P. falciparum persists in people with some degree of immunity is presently unknown (27). Among the three regions, the Bago and Tanintharyi regions manifested high rates of malaria infection without symptoms, and several variables may be associated with the high malaria infection rates. In these regions, gold panning and plantations, mainly producing palm oil, may be primary influences that are associated with malaria infections. Another important group of migrants in the Tanintharyi region are fishermen, who often go to Thailand (36). Population movement in Myanmar has not yet been mapped sufficiently for exact planning of health services targeting these risks. Thus, it is important to establish effective regulation to control malaria transmission in those areas of Myanmar where the disease is endemic.
In this investigation, we confirmed that Myanmar residents in the Bago and Tanintharyi regions may have high prevalences of asymptomatic malaria infection. Standard microscopy performed poorly as a detection method in our study, most likely because our samples had very low parasite densities. Our research demonstrates that a combination of PCR-based strategies can be practical and effective surveillance tools for asymptomatic malaria in countries of endemicity.
ACKNOWLEDGMENTS
This research was supported by the “Strategic Framework for Artemisinin Resistance Containment in Myanmar (MARC) 2011–2015” (WHO/3DF).
We thank staff from the Parasitology Research Division, Department of Medical Research (Lower Myanmar) for sample collection in the field and Takafumi Tsuboi, Proteo-Science Center, Japan, and Tae-Hee Han, Department of Laboratory Medicine, Inje University Sanggye Paik Hospital, South Korea, for providing us with P. malariae and P. ovale samples as controls.
Footnotes
Published ahead of print 19 March 2014
REFERENCES
- 1.Cui L, Yan G, Sattabongkot J, Cao Y, Chen B, Chen X, Fan Q, Fang Q, Jongwutiwes S, Parker D, Sirichaisinthop J, Kyaw MP, Su XZ, Yang H, Yang Z, Wang B, Xu J, Zheng B, Zhong D, Zhou G. 2012. Malaria in the Greater Mekong Subregion: heterogeneity and complexity. Acta Trop. 121:227–239. 10.1016/j.actatropica.2011.02.016 [DOI] [PMC free article] [PubMed] [Google Scholar]
- 2.World Health Organization. 2008. Malaria in the Greater Mekong Subregion: regional and country profiles. World Health Organization, Geneva, Switzerland: http://www.searo.who.int/myanmar/documents/malariainthegreatermekongsubregion.pdf [Google Scholar]
- 3.World Health Organization. 2008. Strengthening malaria control for ethnic minorities in the Greater Mekong subregion. World Health Organization, Geneva, Switzerland [Google Scholar]
- 4.World Health Organization. 2011. Report of consultation on Myanmar artemisinin resistance containment (MARC). World Health Organization, Geneva, Switzerland: http://www.searo.who.int/myanmar/documents/ReportMARCmeetingApril2011.pdf [Google Scholar]
- 5.Laishram DD, Sutton PL, Nanda N, Sharma VL, Sobti RC, Carlton JM, Joshi H. 2012. The complexities of malaria disease manifestations with a focus on asymptomatic malaria. Malar. J. 11:29. 10.1186/1475-2875-11-29 [DOI] [PMC free article] [PubMed] [Google Scholar]
- 6.Dunyo S, Milligan P, Edwards T, Sutherland C, Targett G, Pinder M. 2006. Gametocytaemia after drug treatment of asymptomatic Plasmodium falciparum. PLoS Clin. Trials 1:e20. 10.1371/journal.pctr.0010020 [DOI] [PMC free article] [PubMed] [Google Scholar]
- 7.Mabunda S, Aponte JJ, Tiago A, Alonso P. 2009. A country-wide malaria survey in Mozambique. II. Malaria attributable proportion of fever and establishment of malaria case definition in children across different epidemiological settings. Malar. J. 8:74. 10.1186/1475-2875-8-74 [DOI] [PMC free article] [PubMed] [Google Scholar]
- 8.Vafa M, Troye-Blomberg M, Anchang J, Garcia A, Migot-Nabias F. 2008. Multiplicity of Plasmodium falciparum infection in asymptomatic children in Senegal: relation to transmission, age and erythrocyte variants. Malar. J. 7:17. 10.1186/1475-2875-7-17 [DOI] [PMC free article] [PubMed] [Google Scholar]
- 9.Baliraine FN, Afrane YA, Amenya DA, Bonizzoni M, Menge DM, Zhou G, Zhong D, Vardo-Zalik AM, Githeko AK, Yan G. 2009. High prevalence of asymptomatic Plasmodium falciparum infections in a highland area of western Kenya: a cohort study. J. Infect. Dis. 200:66–74. 10.1086/599317 [DOI] [PMC free article] [PubMed] [Google Scholar]
- 10.Coleman RE, Sattabongkot J, Promstaporm S, Maneechai N, Tippayachai B, Kengluecha A, Rachapaew N, Zollner G, Miller RS, Vaughan JA, Thimasarn K, Khuntirat B. 2006. Comparison of PCR and microscopy for the detection of asymptomatic malaria in a Plasmodium falciparum/vivax endemic area in Thailand. Malar. J. 5:121. 10.1186/1475-2875-5-121 [DOI] [PMC free article] [PubMed] [Google Scholar]
- 11.Kritsiriwuthinan K, Ngrenngarmlert W. 2011. Asymptomatic malaria infections among foreign migrant workers in Thailand. Asian Pac. J. Trop. Med. 4:560–563. 10.1016/S1995-7645(11)60146-6 [DOI] [PubMed] [Google Scholar]
- 12.Ganguly S, Saha P, Guha SK, Biswas A, Das S, Kundu PK, Maji AK. 2013. High prevalence of asymptomatic malaria in a tribal population in eastern India. J. Clin. Microbiol. 51:1439–1444. 10.1128/JCM.03437-12 [DOI] [PMC free article] [PubMed] [Google Scholar]
- 13.Warhurst DC, Williams JE. 1996. ACP Broadsheet no 148. July 1996. Laboratory diagnosis of malaria. J. Clin. Pathol. 49:533–538 [DOI] [PMC free article] [PubMed] [Google Scholar]
- 14.Kain KC, Harrington MA, Tennyson S, Keystone JS. 1998. Imported malaria: prospective analysis of problems in diagnosis and management. Clin. Infect. Dis. 27:142–149. 10.1086/514616 [DOI] [PubMed] [Google Scholar]
- 15.Moody A. 2002. Rapid diagnostic tests for malaria parasites. Clin. Microbiol. Rev. 15:66–78. 10.1128/CMR.15.1.66-78.2002 [DOI] [PMC free article] [PubMed] [Google Scholar]
- 16.Snounou G, Singh B. 2002. Nested PCR analysis of Plasmodium parasites. Methods Mol. Med. 72:189–203. 10.1385/1-59259-271-6:189 [DOI] [PubMed] [Google Scholar]
- 17.Kimura K, Kaneko O, Liu Q, Zhou M, Kawamoto F, Wataya Y, Otani S, Yamaguchi Y, Tanabe K. 1997. Identification of the four species of human malaria parasites by nested PCR that targets variant sequences in the small subunit rRNA gene. Parasitol. Int. 46:91–95. 10.1016/S1383-5769(97)00013-5 [DOI] [Google Scholar]
- 18.Shokoples SE, Ndao M, Kowalewska-Grochowska K, Yanow SK. 2009. Multiplexed real-time PCR assay for discrimination of Plasmodium species with improved sensitivity for mixed infections. J. Clin. Microbiol. 47:975–980. 10.1128/JCM.01858-08 [DOI] [PMC free article] [PubMed] [Google Scholar]
- 19.Veron V, Simon S, Carme B. 2009. Multiplex real-time PCR detection of P. falciparum, P. vivax and P. malariae in human blood samples. Exp. Parasitol. 121:346–351. 10.1016/j.exppara.2008.12.012 [DOI] [PubMed] [Google Scholar]
- 20.Snounou G, Viriyakosol S, Zhu XP, Jarra W, Pinheiro L, do Rosario VE, Thaithong S, Brown KN. 1993. High sensitivity of detection of human malaria parasites by the use of nested polymerase chain reaction. Mol. Biochem. Parasitol. 61:315–320. 10.1016/0166-6851(93)90077-B [DOI] [PubMed] [Google Scholar]
- 21.Emmanuel JC, Bassett MT, Smith HJ, Jacobs JA. 1988. Pooling of sera for human immunodeficiency virus (HIV) testing: an economical method for use in developing countries. J. Clin. Pathol. 41:582–585. 10.1136/jcp.41.5.582 [DOI] [PMC free article] [PubMed] [Google Scholar]
- 22.Cunningham R, Northwood JL, Kelly CD, Boxall EH, Andrews NJ. 1998. Routine antenatal screening for hepatitis B using pooled sera: validation and review of 10 years experience. J. Clin. Pathol. 51:392–395. 10.1136/jcp.51.5.392 [DOI] [PMC free article] [PubMed] [Google Scholar]
- 23.Garcia Z, Taylor L, Ruano A, Pavon L, Ayerdis E, Luftig RB, Visona KA. 1996. Evaluation of a pooling method for routine anti-HCV screening of blood donors to lower the cost burden on blood banks in countries under development. J. Med. Virol. 49:218–222. [DOI] [PubMed] [Google Scholar]
- 24.Pilcher CD, Fiscus SA, Nguyen TQ, Foust E, Wolf L, Williams D, Ashby R, O'Dowd JO, McPherson JT, Stalzer B, Hightow L, Miller WC, Eron JJ, Jr, Cohen MS, Leone PA. 2005. Detection of acute infections during HIV testing in North Carolina. N. Engl. J. Med. 352:1873–1883. 10.1056/NEJMoa042291 [DOI] [PubMed] [Google Scholar]
- 25.Van TT, Miller J, Warshauer DM, Reisdorf E, Jernigan D, Humes R, Shult PA. 2012. Pooling nasopharyngeal/throat swab specimens to increase testing capacity for influenza viruses by PCR. J. Clin. Microbiol. 50:891–896. 10.1128/JCM.05631-11 [DOI] [PMC free article] [PubMed] [Google Scholar]
- 26.Taylor SM, Juliano JJ, Trottman PA, Griffin JB, Landis SH, Kitsa P, Tshefu AK, Meshnick SR. 2010. High-throughput pooling and real-time PCR-based strategy for malaria detection. J. Clin. Microbiol. 48:512–519. 10.1128/JCM.01800-09 [DOI] [PMC free article] [PubMed] [Google Scholar]
- 27.Ndao M, Bandyayera E, Kokoskin E, Gyorkos TW, MacLean JD, Ward BJ. 2004. Comparison of blood smear, antigen detection, and nested-PCR methods for screening refugees from regions where malaria is endemic after a malaria outbreak in Quebec, Canada. J. Clin. Microbiol. 42:2694–2700. 10.1128/JCM.42.6.2694-2700.2004 [DOI] [PMC free article] [PubMed] [Google Scholar]
- 28.Dal-Bianco MP, Koster KB, Kombila UD, Kun JF, Grobusch MP, Ngoma GM, Matsiegui PB, Supan C, Salazar CL, Missinou MA, Issifou S, Lell B, Kremsner P. 2007. High prevalence of asymptomatic Plasmodium falciparum infection in Gabonese adults. Am. J. Trop. Med. Hyg. 77:939–942 [PubMed] [Google Scholar]
- 29.Westreich DJ, Hudgens MG, Fiscus SA, Pilcher CD. 2008. Optimizing screening for acute human immunodeficiency virus infection with pooled nucleic acid amplification tests. J. Clin. Microbiol. 46:1785–1792. 10.1128/JCM.00787-07 [DOI] [PMC free article] [PubMed] [Google Scholar]
- 30.Guerin PJ, Olliaro P, Nosten F, Druilhe P, Laxminarayan R, Binka F, Kilama WL, Ford N, White NJ. 2002. Malaria: current status of control, diagnosis, treatment, and a proposed agenda for research and development. Lancet Infect. Dis. 2:564–573. 10.1016/S1473-3099(02)00372-9 [DOI] [PubMed] [Google Scholar]
- 31.McKenzie FE, Sirichaisinthop J, Miller RS, Gasser RA, Jr, Wongsrichanalai C. 2003. Dependence of malaria detection and species diagnosis by microscopy on parasite density. Am. J. Trop. Med. Hyg. 69:372–376 [PMC free article] [PubMed] [Google Scholar]
- 32.Nankabirwa J, Zurovac D, Njogu JN, Rwakimari JB, Counihan H, Snow RW, Tibenderana JK. 2009. Malaria misdiagnosis in Uganda—implications for policy change. Malar. J. 8:66. 10.1186/1475-2875-8-66 [DOI] [PMC free article] [PubMed] [Google Scholar]
- 33.Stow NW, Torrens JK, Walker J. 1999. An assessment of the accuracy of clinical diagnosis, local microscopy and a rapid immunochromatographic card test in comparison with expert microscopy in the diagnosis of malaria in rural Kenya. Trans. R. Soc. Trop. Med. Hyg. 93:519–520. 10.1016/S0035-9203(99)90359-0 [DOI] [PubMed] [Google Scholar]
- 34.Wongsrichanalai C, Barcus MJ, Muth S, Sutamihardja A, Wernsdorfer WH. 2007. A review of malaria diagnostic tools: microscopy and rapid diagnostic test (RDT). Am. J. Trop. Med. Hyg. 77:119–127 [PubMed] [Google Scholar]
- 35.Humar A, Ohrt C, Harrington MA, Pillai D, Kain KC. 1997. Parasight F test compared with the polymerase chain reaction and microscopy for the diagnosis of Plasmodium falciparum malaria in travelers. Am. J. Trop. Med. Hyg. 56:44–48 [DOI] [PubMed] [Google Scholar]
- 36.World Health Organization. 2011. Strategic framework for artmisinin resistance containment in Myanmar 2011–2015. World Health Organization, Geneva, Switzerland: http://www.searo.who.int/myanmar/documents/MARCframeworkApril2011.pdf [Google Scholar]