Abstract
Background
The molecular mechanisms that control the aggressiveness of gastric cancer (GC) remain poorly defined. Here we show that synbindin contributes to the aggressiveness of GC by activating extracellular signal-regulated protein kinase (ERK) signaling on the Golgi apparatus.
Methods
Expression of synbindin was examined in normal gastric mucosa (n = 44), intestinal metaplastic gastric mucosa (n = 66), and GC tissues (n=52), and the biological effects of synbindin on tumor growth and ERK signaling were detected in cultured cells, nude mice, and human tissue samples. The interaction between synbindin and mitogen-activated protein kinase kinase (MEK1)/ERK was determined by immunofluorescence and fluorescence resonance energy transfer assays. The transactivation of synbindin by nuclear factor kappa-light-chain-enhancer of activated B cells (NF-κB) was detected using luciferase reporter assay and chromatin immunoprecipitation.
Results
High expression of synbindin was associated with larger tumor size (120.8 vs 44.8cm3; P = .01), advanced tumor node metastasis (TNM) stage (P = .003), and shorter patient survival (hazard ratio = 1.51; 95% confidence interval [CI] = 1.01 to 2.27; P = .046). Synbindin promotes cell proliferation and invasion by activating ERK2 on the Golgi apparatus, and synbindin is directly transactivated by NF-κB. Synbindin expression level was statistically significantly higher in human GCs with activated ERK2 than those with low ERK2 activity (intensity score of 11.5, 95% CI = 10.4 to 12.4 vs intensity score of 4.6, 95% CI 3.9 to 5.3; P < .001). Targeting synbindin in xenograft tumors decreased ERK2 phosphorylation and statistically significantly reduced tumor volume (451.2mm3, 95% CI = 328.3 to 574.1 vs 726.1mm3, 95% CI = 544.2 to 908.2; P = .01).
Conclusions
Synbindin contributes to malignant phenotypes of GC by activating ERK on the Golgi, and synbindin is a potential biomarker and therapeutic target for GC.
Gastric cancer (GC) is one of the most common malignancies worldwide; unfortunately, the majority of GC patients are diagnosed at an advanced stage and die within 24 months after operation because of recurrence and metastasis (1). A better understanding of GC biology and signaling pathways is expected to improve GC targeted therapy, and it is of clinical importance to identify genes that contribute to the aggressiveness of GC and present predictive value for prognosis.
The transport protein particle (TRAPP; also known as trafficking protein particle) is a multimeric guanine nucleotide-exchange factor that regulates multiple membrane trafficking pathways (2). Recent studies on the structure of the TRAPP complex have elucidated the exact mechanism for its function in endoplasmic reticulum–to-Golgi transportation (3,4), but the functions of the TRAPP complex may extend to other areas of biology (5). The trafficking protein particle complex subunit 2 (TRAPPC2) has been demonstrated to interact with a number of proteins, including transcription factors (6,7) and ion-channel proteins (8). TRAPPC9 was implicated in potentiating the nuclear factor kappa-light-chain-enhancer of activated B cells (NF-κB) signaling pathway, leading to an increase of NF-κB transactivation by interaction with IκB kinase (IKK) and NF-κB-inducing kinase (NIK) (9).
In this study we demonstrate that synbindin, a core subunit of the TRAPP complex, binds to mitogen-activated protein kinase kinase (MEK1)/extracellular signal-regulated protein kinase 2 (ERK2) and potentiates ERK2 activation in GCs. We found that synbindin is statistically significantly upregulated in precancerous and cancerous gastric tissues, and synbindin expression strongly associated with the aggressiveness of GC. We identified the ERK mitogen-activated protein kinase (MAPK) pathway as the major regulatory target of synbindin in gastric tissues and found that synbindin interacts with ERK2 by its C-terminal Longin domain. The effect of synbindin on ERK2 phosphorylation was examined both in vitro and in vivo, and the results revealed synbindin is a scaffold protein for spatial regulation of ERK signaling. By these approaches, we aim to elucidate the role of synbindin in the spatial regulation of ERK2 and evaluate the potential value of synbindin as a biomarker and therapeutic target for GC.
Methods
Cell Culture and Transfection
Human GC MGC803 and SGC7901 cells were maintained at 37°C in an atmosphere of 5% carbon dioxide in Roswell Park Memorial Institute 1640 medium (Invitrogen, Carlsbad, CA) supplemented with 10% fetal bovine serum, penicillin, and streptomycin (Invitrogen) in 25-mL culture flasks. For each transfection in 6-well plates, the complex was prepared using 1µg of plasmid or small interfering RNA (siRNA) and 4µL of FuGENE HD in 100 µL of Opti-MEM media (Invitrogen). The synbindin siRNAs used in cell transfection and in vivo experiments are listed as following: 1) 5′-GAUCUUGGUGUUUGCGUAATT-3′; 2) 5′-GCUAGGUCCAUAAAUGUUGTT-3′; 3) 5′-CCUUUG AUCUUGGUGUUUGTT-3′.
Immunofluorescence
For tissue immunofluorescence, specimens were from patients (primary gastric adenocarcinomas) who underwent surgery at the Shanghai Renji Hospital from July 2003 to January 2009. The protocol had the approval of the Ethics Committee of the Shanghai Jiao-Tong University School of Medicine, Renji Hospital, and the research was carried out according to the provisions of the Helsinki Declaration of 1975. Written informed consent was obtained from all participants involved in the study. Meanwhile, 40 specimens of normal gastric epithelium taken from patients without GC were used as the controls. Detailed staining protocol can be found in the Supplementary Methods (available online), and the scoring method for synbindin expression level can be found in the legend of Figure 1.
Figure 1.
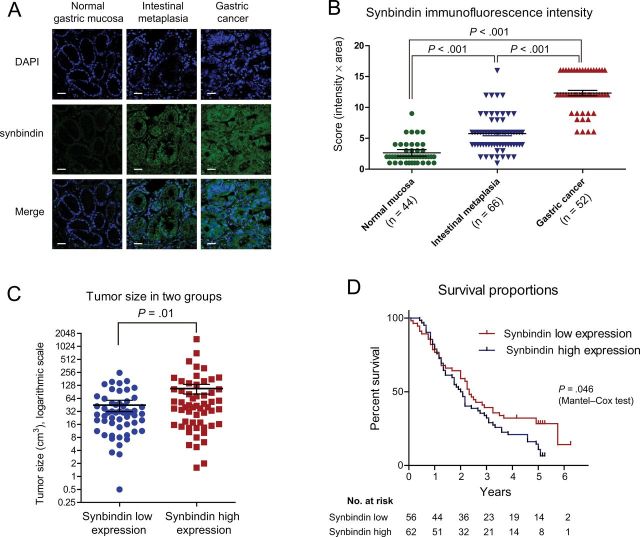
Relationship between synbindin expression and outcome of gastric cancers. A) Immunofluorescence of synbindin in normal gastric mucosa, intestinal metaplastic mucosa, or gastric cancer tissues. Paraffin-embedded tissue sections were stained using specific antibodies for synbindin in green. Cell nucleus was stained with 4’,6-diamidino-2-phenylindole (DAPI) in blue. Scale bars indicate 50 μm. Sybindin protein expression level was scored based on both staining intensity and positive frequency. B) Statistical analysis of synbindin expression in normal, precancerous, and cancerous gastric tissues. The staining intensity was scored as 1 (negative), 2 (weakly stained), 3 (moderately positive), and 4 (strongly positive). The fraction of positive cells was graded as 1 (less than 1/4), 2 (1/4 to 1/2), 3 (1/2 to 3/4), and 4 (3/4 to all). The overall score was calculated by multiplying the intensity score and the fraction score, producing a total range of 1 to 16. The bars represent mean scores with 95% confidence interval (CI). The differences between each two groups were statistically significant (P < .001, two-sided Mann–Whitney test). C) Statistical analysis on the size of gastric cancers in synbindin low expression and high expression groups. The average tumor size in two groups was compared using two-sided Mann–Whitney test (P = .01). The bars represent mean value with 95% confidence interval. D) The Mantel–Cox test indicated statistically significantly shorter survival of patients in the synbindin high expression group than the low expression group (hazard ratio = 1.51; 95% CI = 1.01 to 2.27; P = .046). The number of patients at risk in each group is given below the graphs.
Fluorescence Resonance Energy Transfer Assay
The fluorescence resonance energy transfer (FRET) assay was performed using a protocol reported previously (10,11). The antisynbindin monoclonal antibody and the anti-ERK polyclonal antibody were labeled with AlexaFluor488 (donor) and AlexaFluo546 dye (acceptor), respectively. The detailed experimental procedure is provided in the Supplementary Methods (available online).
In Vivo Experiments
Briefly, all mice were injected subcutaneously in the left armpit with 1.0×10⁷ MGC803 cells to establish the GC xenograft model. Ten days after subcutaneous inoculation, mice were injected with synbindin siRNA or control siRNA (10 µg siRNA in 30µL transfection complex per tumor) every other day for 13 days. The detailed protocol can be found in the Supplementary Methods (available online). All mouse studies were conducted in accordance with animal care procedures and recommendations approved by the Institutional Animal Care and Use Committee of Shanghai Jiao Tong University.
Statistical Analysis
The data from at least three independent experiments performed in triplicate are presented as means with 95% confident intervals (CIs). Comparisons between groups were performed using two-sided Student t test, Mann–Whitney test (for comparison of tumor volume), or Fisher exact test (for immunohistochemistry). The survival curves of patients with high and low expression of synbindin were compared using the log rank (Mantel–Cox) test, which is constructed by computing the observed and expected number of events at each observed event time and then adding these to obtain an overall summary across all time points (12). A P value of less than .05 was considered statistically significant, and all statistical tests were two-sided.
Results
Relationship Between Synbindin Expression and Aggressiveness of GCs
We first investigated synbindin expression levels in normal gastric mucosa (44 patients), intestinal metaplasia (66 patients), and adenocarcinoma (52 patients) by immunofluorescence histochemistry. The level of synbindin showed progressive increase from normal mucosa (mean intensity score = 2.6; 95% CI = 2.1 to 3.2) to precancerous intestinal metaplastic mucosa (mean intensity score =5.8; 95% CI = 5.1 to 6.5) to GCs (mean intensity score = 13.2; 95% CI = 12.5 to 13.8; P < .001 for all comparisons, two-sided Mann–Whitney test) (Figure 1, A and B). Further, we analyzed the expression level of synbindin in 117 GC cases with different clinical outcomes (see Supplementary Table 1, available online). As shown in Table 1 and Figure 1, C and D, higher expression level of synbindin were associated with larger tumor size (120.8 [95% confidence interval = 60.3 to 181.4] vs 44.8 [95% confidence interval = 31.5 to 57.9] cm3; P = .01, two-sided Mann-Whitney test), severe lymph node invasion (P = .02, Fisher exact test), increased distant metastasis (P = .01, Fisher exact test), advanced tumor node metastasis (TNM) grading (P = .003, Fisher exact test), and shorter overall survival (hazard ratio = 1.51; 95% CI = 1.01 to 2.27; P = .046, Mantel-Cox test). These results strongly suggest that synbindin expression is associated with poor prognosis of GCs.
Table 1.
Comparison of clinicopathological features between gastric cancer patients in the synbindin low expression group (intensity score of 1 or 2) and high expression group (intensity score of 3 or 4)*
| Compared items | Sunbindin low expression | Synbindin high expression | P |
|---|---|---|---|
| Number of patients | 56 | 61 | — |
| Tumor volume, cm3 | 44.8 (95% CI = 31.5 to 57.9) | 120.8 (95% CI = 60.3 to 181.4) | .01† |
| Affected 2/3 lymph nodes | 15 | 29 | .02‡ |
| Patients with distant metastasis | 6 | 18 | .01‡ |
| Patients in TNM stage IV | 5 | 20 | .003‡ |
* CI = confidence interval; TNM = Tumor node metastasis.
† Mann–Whitney test.
‡ Fisher exact test
Effects of Synbindin on the Proliferation and Invasion of GC Cells
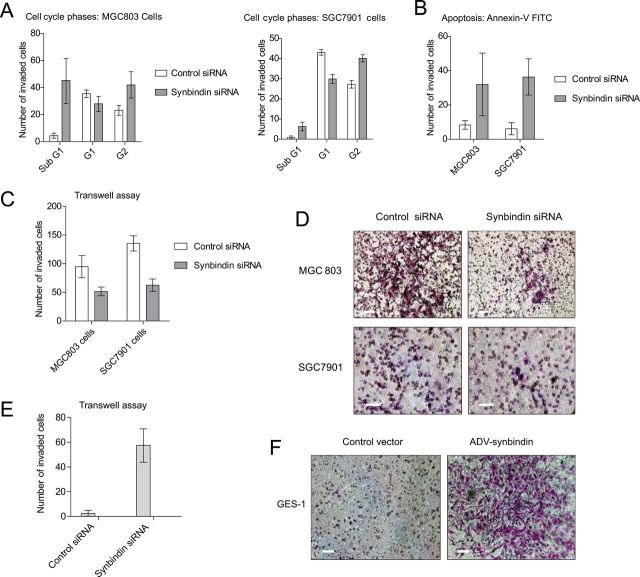
To test the effect of synbindin on cancer cell proliferation and invasion, specific siRNAs were employed to knock down synbindin expression in human GC MGC-803 and SGC-7901 cells (Supplementary Figure 1A, available online). In this context, flow cytometry revealed G2/M cell cycle arrest and increased cell apoptosis in both cell strains (Figure 2, A and B). Knockdown of synbindin decreased the invasion ability of GC cells (Figure 2, C and D), whereas ectopic expression of synbindin increased the invasiveness of gastric epithelial immortalized GES-1 cells (Figure 2, E and F). These results suggested that synbindin facilitates the proliferation and invasion of GC cells and explained the association of synbindin with the aggressiveness of GCs.
Figure 2.
Effects of synbindin on the proliferation and invasion of gastric cancer cells. A) Flow cytometry assay of MGC803 and SGC7901 cells treated by synbindin small interfering RNA (siRNA). The knockdown of synbindin induced increase of cells in subG1 and G2 phases as compared with control siRNA. The bars indicate mean values with 95% confidence interval. B) Apoptosis of MGC803 and SGC7901 cells induced by knockdown of synbindin. Flow cytometric assay based on phycoerythrin (PE)–conjugated annexin V staining showed increased apoptosis of MG803 and SGC7901 cells treated by synbindin siRNA. The bars indicate mean values with 95% confidence interval. C) Knockdown of synbindin suppressed migration of gastric cancer cells. The MGC803 and SGC7901 cells were transfected by synbindin siRNAs, and Transwell assay was applied to quantify cell migration ability. D) Representative Transwell cell staining images of MGC803 and SGC7901 cells. Scale bars indicate 50 μm. E) The human gastric epithelial immortalized GES-1 cells were infected with adenovirus that carried synbindin, and cell migration was detected by Transwell assay. The bar plot indicates mean values with 95% confidence interval. F) Representative Transwell cell staining images of GES-1 cells. Scale bars indicate 50 μm.
Microarray Study on Synbindin-Regulated Pathways
To probe the pathways under the regulation of synbindin, we performed gene expression profiling study on the MGC-803 GC cells overexpressing synbindin. A whole-genome gene expression microarray was used to identify differentially expressed genes in response to synbindin activation. Although most genes remained unaffected, a relatively smaller number of genes were found upregulated by synbindin (criteria: fold change >1.5; P < .05, two-sided t test; raw data accessible by GEO number GSE42736). Notably, many synbindin-regulated genes (with high fold-change values) were linked to the ERK MAPK pathway (gene symbols are shown in Figure 3, A–C, and the functional relevance to ERK pathway is described in Supplementary Table 2, available online). In addition, synbindin also seemed to affect the expression of some other genes, including centrosome-associated protein 350 (regulation of Golgi structure) (13), syndecan-2 (development of neuronal cells) (14,15), VAMP1 (transports synaptic vesicles), and NAV1 (mediates axon guidance). However, the alteration of these genes was less pronounced, with lower fold-change values (Supplementary Table 2, available online). By combined analysis on published microarray datasets (GSE13911 and GSE15460), we found upregulation of ERK MAPK–related genes in GC (Supplementary Table 2, available online). Thus, the ERK MAPK pathway seems to be the major regulatory target of synbindin in GC.
Figure 3.
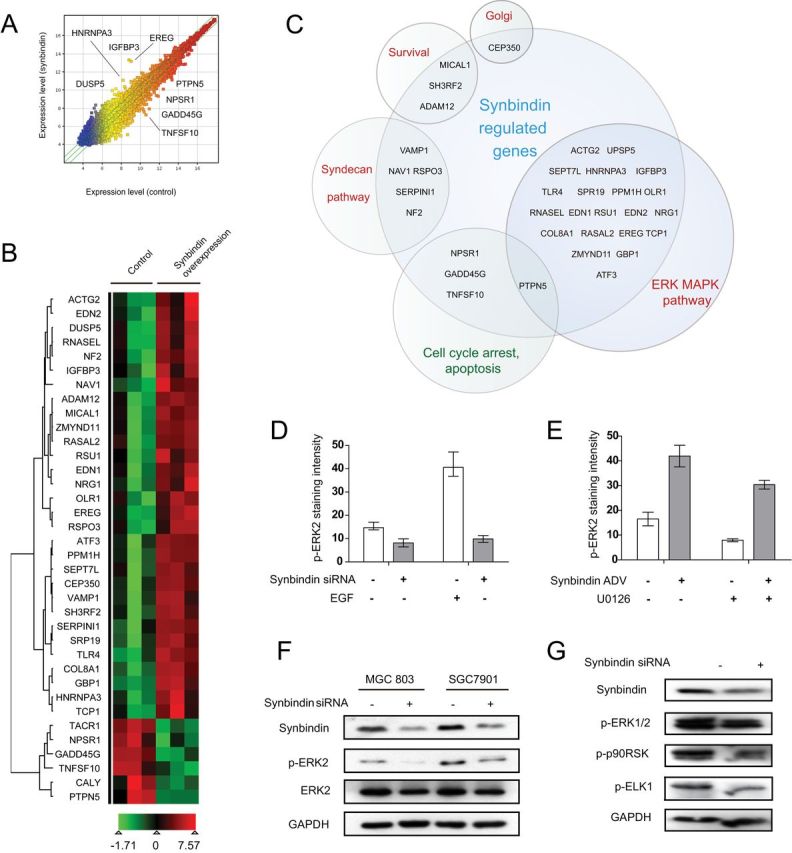
Microarray study on synbindin-regulated signaling pathways. A) Synbindin-regulated genes as detected by microarray (raw data accessible from GEO database GSE42736). Most genes were expressed at similar levels in synbindin overexpressing (y-axis) and control cells (x-axis), but a relatively smaller number of genes were up- or downregulated by synbindin. The genes labeled on the plot are related to ERK MAPK pathway or cell cycle arrest and apoptosis. B) Hierearchical clustering of synbindin-regulated genes according to their expression patterns. Red and green colors indicate upregulation and downregulation, respectively. C) The synbindin-regulated genes fall into several categories. Each circle indicates a relevant pathway, and the ERK MAPK pathway included the most genes that were affected by synbindin. Activated pathways are labeled in red, and suppressed pathways are marked in green. D) The SGC7901 cells were treated by small interfering RNA (siRNA) specific for synbindin in the presence and absence of epithelial growth factor (EGF). A specific antibody for phosphorylated ERK2 (p-ERK2) was used to detect the level of p-ERK2 by immunofluorescence. The bars indicate mean values with 95% confidence interval, and representative immunofluorescence images are shown in Supplementary Figure 1 (available online). E) Synbindin promotes ERK2 phosphorylation. Adenovirus mediated the overexpression of synbindin in SGC7901 cells in the presence or absence of MEK inhibitor U0126. The level of p-ERK2 was determined by immunofuorescence. The bars indicate mean values with 95% confidence interval, and representative immunofluorescence images are shown in Supplementary Figure 2 (available online). F) Western blot indicating that knockdown of synbindin reduced the level of p-ERK2. MGC803 and SGC7901 cells were transfected with siRNAs specific for synbindin, and the levels of synbindin, p-ERK2, and total ERK2 were detected by Western blot. GAPDH was included as loading control. G) MGC803 cells were treated with siRNA specific for synbindin, and the levels of p-ERK, phosphorylated p90RSK (p-p90RSK), and phosphorylated ELK1 (p-ELK1) were detected by Western blot.
Effects of Synbindin on ERK2 Phosphorylation
Consistent with the microarray study, knockdown of synbindin in SGC-7901, MGC-803, and Hela decreased the level of phosphorylated ERK2 (Figure 3D; Supplementary Figure 1, available online). When these cells were treated with endothelial growth factor (EGF), a substantial increase of phosphorylated ERK2 (p-ERK2) was observed due to the activation effect of EGF on Ras-Raf-Mek-ERK pathway. However, knockdown of synbindin suppressed ERK phosphorylation and blocked the effect of EGF (Figure 3D; Supplementary Figure 1, B–D, available online). In addition, adenovirus-mediated overexpression of synbindin in these cells increased the p-ERK2 level, and the effect was strong enough to antagonize the effect of U0126, a powerful inhibitor of ERK2 (Figure 3E; Supplementary Figure 2, available online). Consistently, Western blotting revealed a decrease of p-ERK2 when synbindin was knocked down by siRNA in MGC-803 and SGC-7901 cells (Figure 3F). Nonetheless, knockdown of ERK2 in MGC-803, SGC-7901, and Hela cells did not affect synbindin expression level, as suggested by immunofluorescence (Supplementary Figure 3, A–C). Knockdown of synbindin also decreased the levels of phosphorylated p90RSK and ELK1, which are downstream targets of ERK2 in the cytoplasm and nucleus (Figure 3G). Suppressing ERK2 phosphorylation by U0126 abolished the pro-proliferative effect of synbindin, suggesting that synbindin functions by regulating the ERK signaling pathway (Supplementary Figure 3D, available online).
The Subcellular Compartment Involved in the Effect of Synbindin
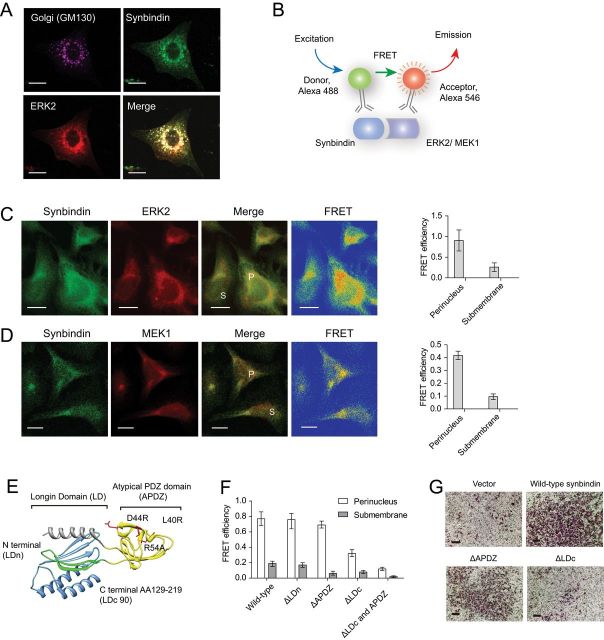
To further probe the mechanism underlying the effect of synbindin on ERK2, we studied the localization of both proteins in human GC MGC803 and SGC7901 cells. Intriguingly, the endogenously expressed synbindin and ERK2 showed extensive colocalization, especially in the Golgi apparatus (Figure 4A; Supplementary Figure 4A, available online). The interaction between synbindin and ERK2 was further detected by FRET assay (schematics in Figure 4B). FRET is a powerful method for detection of protein–protein interactions, enzyme activities, and small molecules in the intracellular milieu (16,17). We used AlexaFluor 488 to label synbindin as donor fluorophore and AlexaFluor 546 to mark ERK2 as receptor. In this approach, a direct interaction between synbindin and ERK2 proteins would bring the donor and receptor fluorophors close enough and lead to highly efficient FRET (Figure 4B). Synbindin and ERK2 showed strong FRET signal in the Golgi region, suggesting that synbindin indeed binds to ERK2 (Figure 4C). The FRET assay also indicated that synbindin interacts with MEK1 (Figure 4D), the mitogen-activated protein (MAP) kinase that phosphorylates ERK2 (18). Consistently, synbindin colocalized with MEK1 in cells, especially in the Golgi region (Supplementary Figure 4, B and C, available online). We also tested the colocalization between synbindin and PKCδ, another important ERK2 activator (19). As a result, synbindin showed no colocalization with PKCδ in MGC-803 and SGC-7901 cells (Supplementary Figure 4, B and C, available online). The ability of synbindin to interact with MAPKs seemed to be specific for ERK2 because the p38 MAPK showed no colocalization or FRET when coexpressed with synbindin (Supplementary Figure 5A, available online).
Figure 4.
Mapping the structural domain relevant to the effects of synbindin. A) Immunofluorescent staining of endogenous synbindin, ERK2, and GM130 in MGC-803 cells. The GM130 protein is specifically localized in the Golgi apparatus, and it strongly colocalized with synbindin and ERK2. Scale bars indicate 10 μm. B) Schematic representation for the setup of fluorescent resonance energy transfer (FRET) assay. A direct interaction of synbindin and ERK2 proteins would bring the donor and receptor fluorophors close enough and lead to highly efficient FRET. C) FRET between endogenous synbindin and ERK2. Scale bars indicate 10 μm. The efficiency of FRET is shown in the rainbow map, wherein the red and orange colors indicate strong FRET. The perinuclear region is marked by “P”, and the submembrane section is labeld with “S”. The bar plot on the right indicates mean FRET efficiency with 95% confidence interval. D) The FRET efficiency between endogenous synbindin and MEK1 is shown in the same format as with ERK2. E) Crystal structure of synbindin protein (pdb entry 2ZMV) labeled with mutant positions. The Longin domain is divided by the atypical PDZ domain (APDZ, in yellow) into N terminal (LDn, in green) and C terminal domains (LDc). The extreme C terminal region of Longin domain (LDc90, cloned into yeast two-hybrid vector) is shown in blue. F) FRET between ERK2 and different synbindin mutants. The bar plots indicate average FRET efficiency with 95% confidence interval. Although the truncation mutants ΔLD and ΔAPDZ did not affect the synbindin-ERK2 interaction, deletion of the LDc domain decreased FRET between synbindin and ERK2. G) Different mutants of synbindin were ectopically expressed in MGC803 cells, and Transwell assay was performed to determine their invasiveness. Deletion of the LDc but not the APDZ domain decreased the proinvasion effect of synbindin. Scale bars indicate 100 μm.
Mapping the Structral Domain Relevant to the Effects of Synbindin
Next, we set out to identify the region of synbindin that binds to ERK2. The human synbindin protein contains a split Longin domain (LD), assembled by LDn for the N-terminal fragment (residues 2–23) and the LDc for the C-terminal fragment (residues 103–212). A PDZ-like domain with only 75 amino acid residues is inserted between LDn and LDc in the primary sequence (Figure 4E). To determine the region of synbindin that binds to ERK2, we generated different truncation mutants of synbindin, namely ΔLDn, ΔAPDZ, and LDc90 (Figure 4E), as well as missense mutations outside the LDc domain L40R (interrupting hydrophobic groove), D44R (disrupting syndecan 2 binding) and R54A (affecting charged site). When the wild-type synbindin was coexpressed with ERK2 in the MGC-803 human GC cells, both proteins showed extensive colocalization in the cytoplasm and nucleus (Supplementary Figure 5, B and C, available online). Deletion of LDn and APDZ domains or substitution of residues outside the LDc domain did not affect the colocalization between synbindin and ERK2, thus suggesting the LDc domain may be required for their interaction (Supplementary Figure 5, B and C, available online). Consistently, deletion of synbindin LDn or APDZ domains did not affect the FRET efficiency between synbindin and ERK2, but removing the LDc domain abolished their interaction (Figure 4F). The physical interaction between ERK2 and synbindin LDc domain was further tested by yeast two-hybrid assay (Supplementary Figure 5D, available online), thus confirming the important role of LDc domain for the interaction with ERK2. Notably, the Transwell assay revealed that deletion of the LDc domain but not the APDZ domain could decrease the proinvasion effect of synbindin (Figure 4G).
In Vivo Effects of Synbindin on ERK2 Regulation
Because it is important to clarify the effect of synbindin on ERK2 in vivo, we further tested the association between synbindin expression level and ERK2 activation status in human GC tissues. As a transcription factor, ERK2 is activated when it is phosphorylated and translocated into the nucleus (20). By immunofluorescent costaining of synbindin and ERK2, we found that synbindin expression level was statistically significantly higher in tissues with p-ERK2 accumulated in the cell nucleus (mean intensity score = 11.5; 95% CI = 10.4 to 12.4) than those with cytoplasmic ERK2 (mean intensity score = 4.6; 95% CI = 3.9 to 5.3; P < .001, two-sided Mann–Whitney test) (Figure 5, A–D).
Figure 5.
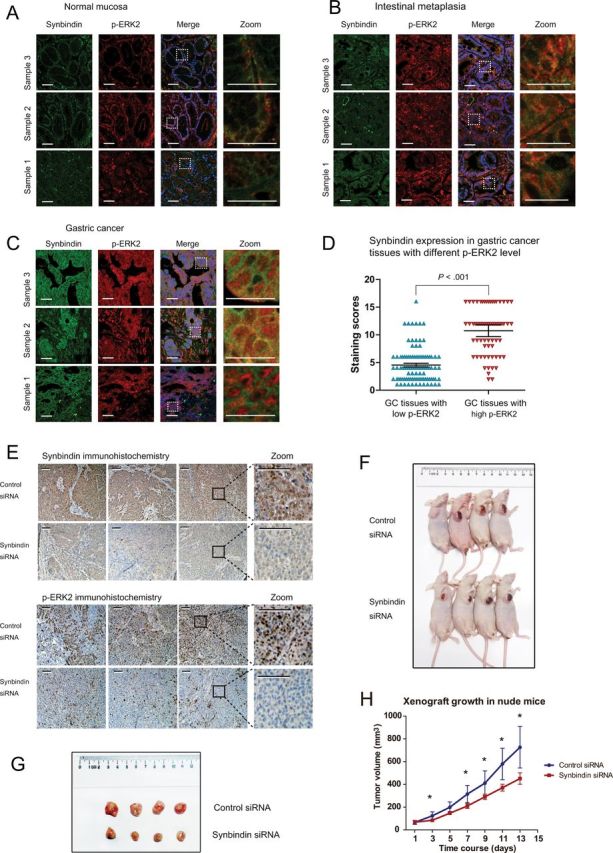
In vivo effects of synbindin on ERK2 regulation. Paraffin-embedded tissue sections from normal gastric mucosa (A), mucosa with intestinal metaplasia (B), or gastric cancer (C) were stained using specific antibodies for synbindin in green and for ERK2 in red. Cell nucleus was stained with 4’,6-diamidino-2-phenylindole (DAPI) in blue. The dashed lines indicate the region that is enlarged in the panels on the right. Scale bars indicate 50 μm. D) Statistical analysis of synbindin expression levels in human gastric cancers with different ERK2 activation status. The score for each case (blue or red marks), together with the mean value and 95% confidence interval (CI) for different groups are plotted (P < .001, two-sided Mann–Whitney test). The scoring method for evaluating synbindin expression level based on immunofluorescent staining intensity can be found in the Methods section. E) Mice were injected subcutaneously with human gastric cancer MGC-803 cells to establish xenograft model, and specific small interfering RNAs (siRNAs) for synbindin were introduced to tumor cells by in vivo jetPEI nanoparticles. Immunohistochemical staining suggested that knockdown of synbindin (upper panels) decreased p-REK2 level in xenografts (lower panels). Scale bars indicate 100 μm. F) Mice carrying xenograft tumors treated with synbindin siRNAs or control siRNAs at the last time point (13 days after first injection). G) Comparison of excised tumors. H) The growth curves of xenograft tumors in different groups. Data represent mean with 95% confidence interval, and exact values are shown in Supplementary Table 3 (available online). Knockdown of synbindin statistically significantly decreased tumor growth as compared with the control group (last time point: 451.2mm3, 95% CI = 328.3 to 574.1 vs 726.1mm3, 95% CI = 544.2 to 908.2; P = .01, two-sided Student t test).
We further confirmed the impact of synbindin on ERK2 activation in vivo by a mouse xenograft model. To this end, MGC-803 cells were implanted subcutaneously into athymic nude mice to allow tumor formation, and specific siRNAs for synbindin (or control siRNAs) were periodically delivered into tumor cells by an in vivo transfection vehicle. This approach allowed efficient suppression of synbindin in xenograft tissues (Figure 5E; Supplementary Figure 6, available online). Notably, knockdown of synbindin decreased the level of p-ERK2 in xenograft tumors, which confirmed the effect of synbindin on ERK2 activation (Figure 5E). Targeting synbindin also statistically significantly suppressed the growth of xenograft tumors (volume at last time point = 451.2mm3; 95% CI = 328 to 574) as compared with the control group (volume at last time point = 726.2mm3; 95% CI = 544.2 to 908.2; P = .01, two-sided student t test) (Figure 5, F–H; tumor size and 95% CI for each time point shown in Supplementary Table 3, available online).
Role of NF-κB on Synbindin Transactivation
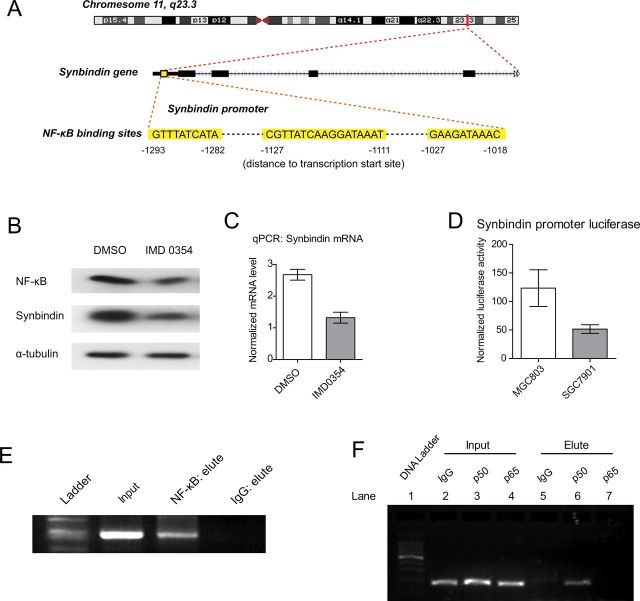
Numerous studies have found strong similarities between key features of inflammatory and tumor development, including stem cell activation, increased cell proliferation, and neoangiogenesis (21), and NF-κB is believed to link inflammation and immunity to cancer development and progression (22). To test the association between NF-κB and synbindin, we treated SGC-7901 cells with NF-κB inhibitor IMD0354 and examined for the expression level of synbindin. Interestingly, suppression of NF-κB function decreased synbindin protein and mRNA levels (Figure 6, A and B). We analyzed synbindin promoter sequence by the PROMO algorithm (23) and found putative NF-κB binding sites in the region −1293 to −1018 upstream of the transcription starting site (Figure 6C). Luciferase reporter carrying this promoter sequence was activated in MGC803 cells that expressed endogenous NF-κB, whereas suppression of NF-κB function by IMD0354 decreased the luciferase signal (Figure 6D). We also performed chromatin immunoprecipitation assay to test the binding of NF-κB to synbindin promoter in vivo. Consistently, the promoter region of synbindin was amplifiable from the DNA recovered from the immunoprecipitation complex using a specific antibody for NF-κB (Figure 6E). In addition, chromatin immunoprecipitation assay also suggested that synbindin promoter is bound to p50 but not to p65 (Figure 6F). These data suggest that synbindin is a direct transcription target of NF-κB and point to a potential link between synbindin expression and inflammatory-related GC.
Figure 6.
Relationship between NF-κB and synbindin transactivation. A) Location of the NF-κB binding sites on synbindin promoter. The synbindin gene promoter contains multiple binding sites for NF-κB (highlighted in yellow) in the region between −1300 and −1000 basepairs upstream of the transcription start site. This DNA sequence was inserted into the PGL3 luciferase reporter to test the transactivity of NF-κB to synbindin. B) SGC-7901 cells were treated by the NF-κB inhibitor IMD0354 or dimethyl sulfoxide (DMSO) as control, and the protein levels of NF-κB and synbindin were examined by Western blot. The α-tubulin protein was included as loading control. C) The mRNA level of synbindin in SGC-7901 cells treated by IMD0354 or DMSO was quantified by reverse-transcription quantitative polymerase chain reaction (qPCR). The 18S rRNA level was used for normalization. Bar plots indicate mean with 95% confidence itnerval. D) Luciferase reporter assay carrying synbindin promoter sequence was transfected in MGC803 cells that expressed endogenous NF-κB. The IMD0354 compound was used to inhibit NF-κB, and the luciferase activity was quantified as the ratio of firefly/renilla. Bar plots indicate mean with 95% confidence interval. E) Chromatin immunoprecipitation (ChIP) assay showing the binding of NF-κB to synbindin promoter in vivo. The promoter region of synbindin was amplified from the DNA recovered from the immunoprecipitation complex using a specific antibody for NF-κB. The input DNA and ChIP yield using nonspecific immunoglobulin G (IgG) are included as controls. F) ChIP assay using antibodies for p50 and p65 subunits of NF-κB. The promoter of synbindin was amplified from ChIP product of p50 (lane 6) but not of p65 (lane 7). The input amounts of DNA are shown in lanes 2–4. The ChIP assay using nonspecific IgG is included as negative control (lane 5).
Discussion
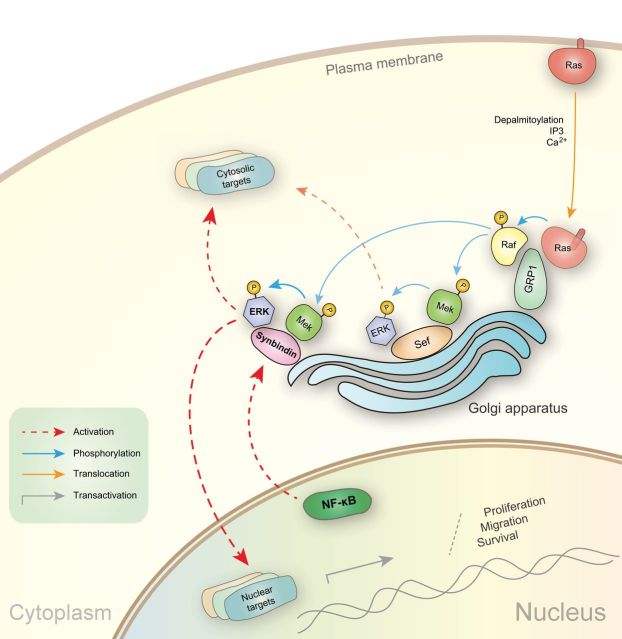
By investigating the role of synbindin in the context of GCs, our study revealed an important function of synbindin as a molecular scaffold that controls the Ras-Raf-MEK-ERK signal transduction cascade. Synbindin binds to MEK1 and ERK2 on the Golgi apparatus, causing enhanced phosphorylation of ERK2 by MEK1 both in vitro and in vivo. These findings provide strong support for the emerging role of the Golgi apparatus as a key compartment for spatial regulation of the Ras-Raf-Mek-ERK pathway (24). As illustrated in Figure 7, Ras has been found to associate with Golgi, which is regulated by depalmitoylation, IP3, and calcium (25). The GRP1 protein anchors both Ras and Raf on the Golgi apparatus, leading to the activation of Raf kinase. The Sef protein is another MAPK scaffold molecule on the Golgi, which binds to active MEK/ERK complexes and allows signaling to cytosolic targets such as RSK but not nuclear substrates such as Elk-1 (26). In this study, we found that synbindin binds to ERK2 through its conserved C-terminal Longin domain, which promotes the phosphorylation of ERK2 by MEK1 on the Golgi. This leads to the activation of ERK targets in both cell nucleus and cytosol, causing enhanced cell proliferation and migration. Notably, synbindin is a direct transcription target of NF-κB, which plays a pivotal role in the transformation from gastric inflammation to intestinal metaplasia and to GC (27,28). These findings extend our understanding of how the TRAPP complex is involved in essential cellular processes and add another important piece of information on the spatial regulation of ERK signaling.
Figure 7.
Schematic representation showing the proposed mechanism. The Golgi apparatus has been found as an important compartment for the Ras-Raf-Mek-ERK pathway. The association of Ras to Golgi has been shown to involve depalmitoylation, IP3, and calcium. The GRP1 protein anchors both Ras and Raf on the Golgi apparatus, which leads to the activation of Raf kinase. The Sef protein is another MAPK scaffold molecule on the Golgi, which binds to active MEK/ERK complexes and allows signaling to cytosolic targets such as RSK but not nuclear substrates such as Elk-1. We found that synbindin binds to ERK2 on the Golgi and promotes the phosphorylation of ERK2. This leads to the activation of ERK targets in both cell nucleus and cytosol. Synbindin also regulates cell cycle/apoptosis-related genes and affects cell proliferation, survival, and migration. The inflammatory inducer NF-κB directly transactivates synbindin, which explains the effect of NF-κB on cell transformation under inflammatory conditions.
Importantly, the expression level of synbindin associates with tumor size, lymph node invasion, distant metastasis, TNM staging, and overall survival of GC patients, and increased synbindin expression can be detected early in the precancerous stage. Given the abundance of synbindin protein in precancerous and cancerous tissues, it can be readily detected by immunohistochemical staining of endoscopic biopsy specimen. These features make synbindin a potential biomarker in GC for risk assessment, early detection, grading, and prognosis.
The fact that synbindin is a direct transcriptional target of NF-κB may suggest an alternative route for prevention or early intervention of GV. It has been established that chronic inflammation (in many cases caused by Helicobacter pylori infection) is closely associated with the occurrence of GC and NF-κB activation is a pivotal molecular step toward malignant transformation (29). Our study suggests that synbindin functions as an adaptor that bridges aberrant NF-κB signaling to ERK hyperactivation, thus targeting synbindin might provide an alternative opportunity for controlling or preventing the malignant transformation process.
Our study has limitations. Because our retrospective study was based on available tissue blocks, we did not have a large number of cases and optimal frequency of follow-up after primary treatment. Also, we have not been able to address the value of synbindin as a biomarker for post-treatment assessment, which may provide extra information for predicting the recurrence of GCs. In fact, monitoring the blood level of synbindin in patients with and without cancer recurrence would be a favorable evaluation strategy.
Finally, our findings highlight the potential value of synbindin as a therapeutic target for controlling deregulated Ras-Raf-MEK-ERK cascade in cancers. Although great efforts have been made to identify approaches for inhibiting ERK signaling pathway in cancers, many drugs tested in clinical trials have resulted in unsatisfactory response rates because of cell resistance (30). To obtain stable therapeutic effects, developing mechanistically distinct inhibitors of the same targets will be essential (31). The identification of synbindin as a new ERK MAPK scaffold protein may present a complementary strategy for controlling Ras-Raf-MEK-ERK signaling in cancers. In particular, methods aiming to disrupt the interaction between synbindin Longin C terminal domain and ERK2 may be plausible approaches.
Funding
This project was supported by grants from the National Basic Research Program of China 973 Program (2010CB5293); National Natural Science Foundation of Key Program (30830055); the National High Technology Research and Development Program of China 863 Program (2012AA02A504); the Program for Innovative Research Team of Shanghai Municipal Education Commission, National Natural Science Foundation of China (30971330, 31371420, 81320108024, 81000861, 81322036, and 81272383); Shanghai Science and Technology Commission “Pujiang Project” No.13PJ1405900; and Shanghai Natural Science Foundation (12ZR1417900).
Supplementary Material
Notes
X. Kong was responsible for design of the experiment, acquisition of the data, and writing of the paper. J. Qian, L. Chen, Y. Weng, Y. Wang, J. Wang, H. Chen, S. Zhao, Y. Chen, and W.-P. Zou were responsible for acquisition of the data. J, Xu was responsible for the study concept, design and acquisition of the data, and writing of the paper. J.-Y. Fang was responsible for the study concept, design, and funding and acted as supervisor.
The sponsors of this study had no role in the collection of the data, the analysis and interpretation of the data, the decision to submit the manuscript for publication, or the writing of the manuscript.
References
- 1. Ueda T, Volinia S, Okumura H, et al. Relation between microRNA expression and progression and prognosis of gastric cancer: a microRNA expression analysis. Lancet Oncol. 2010;11(2):136–146 [DOI] [PMC free article] [PubMed] [Google Scholar]
- 2. Barrowman J, Bhandari D, Reinisch K, et al. TRAPP complexes in membrane traffic: convergence through a common Rab. Nat Rev Mol Cell Biol. 2010;11(11):759–763 [DOI] [PubMed] [Google Scholar]
- 3. Cai Y, Chin HF, Lazarova D, et al. The structural basis for activation of the Rab Ypt1p by the TRAPP membrane-tethering complexes. Cell. 2008;133(7):1202–1213 [DOI] [PMC free article] [PubMed] [Google Scholar]
- 4. Kim YG, Raunser S, Munger C, et al. The architecture of the multisubunit TRAPP I complex suggests a model for vesicle tethering. Cell. 2006;127(4):817–830 [DOI] [PubMed] [Google Scholar]
- 5. Yu S, Liang Y. A trapper keeper for TRAPP, its structures and functions. Cell Mol Life Sci. 2012; 10.1007/s00018-012-1024-3 [DOI] [PMC free article] [PubMed] [Google Scholar]
- 6. Liu X, Wang Y, Zhu H, et al. Interaction of Sedlin with PAM14. J Cell Biochem. 2010;109(6):1129–1133 [DOI] [PubMed] [Google Scholar]
- 7. Jeyabalan J, Nesbit MA, Galvanovskis J, et al. SEDLIN forms homodimers: characterisation of SEDLIN mutations and their interactions with transcription factors MBP1, PITX1 and SF1. PLoS One. 2010;5(5):e10646. [DOI] [PMC free article] [PubMed] [Google Scholar]
- 8. Fan L, Yu W, Zhu X. Interaction of sedlin with chloride intracellular channel proteins. FEBS Lett. 2003;540(1–3):77–80 [DOI] [PubMed] [Google Scholar]
- 9. Hu WH, Pendergast JS, Mo XM, et al. NIBP, a novel NIK and IKK(beta)-binding protein that enhances NF-(kappa)B activation. J Biol Chem. 2005;280(32):29233–29241 [DOI] [PMC free article] [PubMed] [Google Scholar]
- 10. Gaborit N, Larbouret C, Vallaghe J, et al. Time-resolved fluorescence resonance energy transfer (TR-FRET) to analyze the disruption of EGFR/HER2 dimers: a new method to evaluate the efficiency of targeted therapy using monoclonal antibodies. J Biol Chem. 2011;286(13):11337–11345 [DOI] [PMC free article] [PubMed] [Google Scholar]
- 11. Sun Y, Day RN, Periasamy A. Investigating protein-protein interactions in living cells using fluorescence lifetime imaging microscopy. Nat Protoc. 2011;6(9):1324–1340 [DOI] [PMC free article] [PubMed] [Google Scholar]
- 12. Mantel N. Evaluation of survival data and two new rank order statistics arising in its consideration. Cancer Chemother Rep. 1966;50(3):163–170 [PubMed] [Google Scholar]
- 13. Hoppeler-Lebel A, Celati C, Bellett G, et al. Centrosomal CAP350 protein stabilises microtubules associated with the Golgi complex. J Cell Sci. 2007;120(Pt 18):3299–3308 [DOI] [PubMed] [Google Scholar]
- 14. Ethell IM, Hagihara K, Miura Y, et al. Synbindin, a novel syndecan-2-binding protein in neuronal dendritic spines. J Cell Biol. 2000;151(1):53–68 [DOI] [PMC free article] [PubMed] [Google Scholar]
- 15. Fan S, Feng Y, Wei Z, et al. Solution structure of synbindin atypical PDZ domain and interaction with syndecan-2. Protein Pept Lett. 2009;16(2):189–195 [DOI] [PubMed] [Google Scholar]
- 16. Kaganman I. FRETting for a more detailed interactome. Nat Methods. 2007;4(2):112–113 [DOI] [PubMed] [Google Scholar]
- 17. Maurel D, Comps-Agrar L, Brock C, et al. Cell-surface protein-protein interaction analysis with time-resolved FRET and snap-tag technologies: application to GPCR oligomerization. Nat Methods. 2008;5(6):561–567 [DOI] [PMC free article] [PubMed] [Google Scholar]
- 18. Guegan JP, Fremin C, Baffet G. The MAPK MEK1/2-ERK1/2 pathway and its implication in hepatocyte cell cycle control. Int J Hepatol. 2012;2012:328372. [DOI] [PMC free article] [PubMed] [Google Scholar]
- 19. Chen YJ, Tsai RK, Wu WC, et al. Enhanced PKCdelta and ERK signaling mediate cell migration of retinal pigment epithelial cells synergistically induced by HGF and EGF. PLoS One. 2012;7(9):e44937. [DOI] [PMC free article] [PubMed] [Google Scholar]
- 20. Khokhlatchev AV, Canagarajah B, Wilsbacher J, et al. Phosphorylation of the MAP kinase ERK2 promotes its homodimerization and nuclear translocation. Cell. 1998;93(4):605–615 [DOI] [PubMed] [Google Scholar]
- 21. Kuraishy A, Karin M, Grivennikov SI. Tumor promotion via injury- and death-induced inflammation. Immunity. 2011;35(4):467–477 [DOI] [PMC free article] [PubMed] [Google Scholar]
- 22. Karin M, Greten FR. NF-kappaB: linking inflammation and immunity to cancer development and progression. Nat Rev Immunol. 2005;5(10):749–759 [DOI] [PubMed] [Google Scholar]
- 23. Messeguer X, Escudero R, Farre D, et al. PROMO: detection of known transcription regulatory elements using species-tailored searches. Bioinformatics. 2002;18(2):333–334 [DOI] [PubMed] [Google Scholar]
- 24. Bivona TG, Perez De Castro I, Ahearn IM, et al. Phospholipase Cgamma activates Ras on the Golgi apparatus by means of RasGRP1. Nature. 2003;424(6949):694–698 [DOI] [PubMed] [Google Scholar]
- 25. Quatela SE, Philips MR. Ras signaling on the Golgi. Curr Opin Cell Biol. 2006;18(2):162–167 [DOI] [PubMed] [Google Scholar]
- 26. Philips MR. Sef: a MEK/ERK catcher on the Golgi. Mol Cell. 2004;15(2):168–169 [DOI] [PubMed] [Google Scholar]
- 27. Li Q, Yu YY, Zhu ZG, et al. Effect of NF-kappaB constitutive activation on proliferation and apoptosis of gastric cancer cell lines. Eur Surg Res. 2005;37(2):105–110 [DOI] [PubMed] [Google Scholar]
- 28. Rau TT, Rogler A, Frischauf M, et al. Methylation-dependent activation of CDX1 through NF-kappaB: a link from inflammation to intestinal metaplasia in the human stomach. Am J Pathol. 2012;181(2):487–498 [DOI] [PMC free article] [PubMed] [Google Scholar]
- 29. Merchant JL. Inflammation, atrophy, gastric cancer: connecting the molecular dots. Gastroenterology. 2005;129(3):1079–1082 [DOI] [PubMed] [Google Scholar]
- 30. Roberts PJ, Der CJ. Targeting the Raf-MEK-ERK mitogen-activated protein kinase cascade for the treatment of cancer. Oncogene. 2007;26(22):3291–3310 [DOI] [PubMed] [Google Scholar]
- 31. Gysin S, Salt M, Young A, et al. Therapeutic strategies for targeting ras proteins. Genes Cancer. 2011;2(3):359–372 [DOI] [PMC free article] [PubMed] [Google Scholar]
Associated Data
This section collects any data citations, data availability statements, or supplementary materials included in this article.


