

Abstract
Purpose
Salivary gland scintigraphy (SGS) provides an objective means of diagnosing salivary gland dysfunction in Sjögren’s syndrome (SS) patients and in thyroid cancer patients after radioactive iodine (RAI) therapy. In the present study, SGS was performed in SS patients and in thyroid cancer patients post-RAI, and scintigraphic parameters were compared.
Methods
Twenty-eight SS patients (males:females = 1:27, age 53.3 ± 11.9 years), 28 controls (males:females = 3:25, age 54.1 ± 10.1 years), and 92 thyroid cancer patients (males:females = 28:64, age 46.2 ± 12.9) who had undergone a session of high-dose RAI therapy (mean dose, 5.2 ± 1.5 GBq) were included. SGS was performed using Tc-99m pertechnetate (925 MBq). Scintigraphic parameters (parotid uptake ratio PU, submandibular uptake ratio SU, percentage parotid excretion %PE, and percentage submandibular excretion %SE) were measured and compared for SS, thyroid cancer post-RAI, and control patients.
Results
PU, SU, %SE, and %PE were all significantly lower in SS than in post-RAI thyroid cancer or control patients (p < 0.05), whereas only %PE was significantly lower in post-RAI thyroid cancer patients than in controls (p < 0.05). SU and %SE were found to be correlated with the unstimulated whole salivary flow rate.
Conclusion
Scintigraphic parameters derived from SGS can play a crucial role in the detection of salivary gland dysfunction in SS patients and in post-RAI thyroid cancer patients.
Keywords: Salivary gland scintigraphy, Sjögren’s syndrome, Radioactive iodine therapy, Thyroid cancer, Tc-99m pertechnetate
Introduction
Salivary gland dysfunction is a common manifestation of Sjögren’s syndrome (SS) patients and thyroid cancer patients after radioactive iodine (RAI) therapy. SS is a chronic autoimmune disease characterized by lymphoid infiltration of lacrimal and salivary glands, which results in dryness of the eyes and mouth [1, 2]. On the other hand, the salivary gland dysfunction is one of the major complications of RAI therapy in well-differentiated thyroid cancer patients. It has been reported that about 30-50% of thyroid cancer patients who have undergone high-dose RAI therapy go through xerostomia in the long run [3, 4].
Salivary gland scintigraphy (SGS) using Tc-99m pertechnetate has been widely used to evaluate salivary gland dysfunction in SS patients [5–7] and in thyroid cancer patients post-RAI [4, 8]. However, no direct comparison of the SGS findings of SS patients and thyroid cancer patients post-RAI has been performed using the same SGS protocol. We thought that a deeper understating of salivary gland dysfunction differences between these two diseases might encourage the use of SGS in clinical practice. Thus, in the present study, we recruited SS patients, as defined by the American-European Consensus Group criteria [2] and thyroid cancer patients post-RAI, and compared their scintigraphic findings in the hope of identifying useful scintigraphic parameters for the diagnosis of salivary gland dysfunction.
Materials and Methods
SS Patients
One hundred and twenty-eight consecutive patients were referred from our Rheumatology Clinic to the Department of Nuclear Medicine for SGS due to suspected SS from May 2003 to February 2008. Sixteen patients who had already been diagnosed with SS in other hospitals prior to SGS and under medication for SS were excluded. Fifty-five patients that did not undergo full examinations required to fulfill the classification criteria of SS, such as autoantibody tests, lip biopsy, and Schirmer’s test, except the SGS [2], and a patient with clinically confirmed drug (anti-depressant)-induced xerostomia were also excluded. As a result, 28 patients were classified as having SS (27 women, one man; mean age, 53.3 ± 11.9 years) using the classification criteria for SS [2]; eight of these SS patients were diagnosed as having secondary SS (four with rheumatoid arthritis and four with systemic lupus erythematosus). All the 28 patients had visited the Rheumatology Clinic for the first time in their lives. Twenty-eight remaining patients, having been diagnosed as non-SS patients (25 women, three men; mean age, 54.1 ± 10.1 year), served as control patients. Of the 28 control patients, two had polyneuropathy, and one inflammatory arthritis. Age, and gender of the SS and control patients were not significantly different (p > 0.05).
Post-Radioactive Iodine Therapy Thyroid Cancer Patients
Ninety-six consecutive thyroid cancer patients that underwent high-dose RAI therapy after total/near total thyroidectomy from January 2008 to December 2008 were included in the study. Four patients who had had a previous RAI therapy history were excluded in order to rule out chronic xerostomic patients. The remaining 92 thyroid cancer patients (papillary thyroid cancer = 85, follicular thyroid cancer = 6, unspecified thyroid cancer = 1) were included in the study (64 women, 28 men; mean age, 46.2 ± 12.9 years; range 23-79 years). All the patients experienced only one session of high-dose RAI treatment (mean dose 5.2 ± 1.5 GBq, range 2.8–8.9 GBq) 4 weeks before the SGS.
Salivary Gland Scintigraphy
Patients maintained a none-per-oral state for at least 6 h before SGS. Images were acquired using a single-head gamma camera (ARGUS, ADAC laboratories, Milpitas, CA) equipped with a low-energy high-resolution parallel-hole collimator. A 20% energy window was used with a photopeak at 140 KeV. The matrix size was 128 × 128. Ten minutes after administering 925 MBq Tc-99m pertechnetate intravenously, anterior, right lateral, and left lateral static images were acquired. The time-setting method was used for count acquisition. For this, the elapsed times of 800,000 count acquisitions of an anterior 10-min image were applied to subsequent image acquisitions. At 20 min after administering Tc-99m pertechnetate, anterior, right lateral, and left lateral images were re-taken. At 30 min, 2 g lemon-flavored vitamin C powder (LEMONA, Kyungnam Pharm. Co.) was administered orally for 5 min; patients were asked to retain the vitamin C powder in their mouths and not to swallow. Post-stimulation images were then obtained in anterior, right lateral, and left lateral views. After post-stimulation image acquisition, patients were given 100 ml water to wash out the vitamin-C powder and accumulated saliva, and post-washout images were acquired using the same views.
Visual Assessments of Salivary Gland Scintigraphy Images
Two experienced nuclear medicine physicians (15 or 4 years of experience, respectively) interpreted SGS images. Tc-99m pertechnetate uptake was evaluated in 10- and 20-min images, whereas excretion was assessed using post-stimulation and post-washout images. A ‘normal’ finding was defined as prominent Tc-99m pertechnetate uptake and prompt excretion after stimulation by both parotid and submandibular glands (Fig. 1). An ‘intermediate’ finding was defined as decreased uptake and/or decreased excretion by submandibular or parotid glands after stimulation (Fig. 2) [9–11], and an ‘abnormal’ finding was defined as decreased uptake and no excretion after stimulation by both parotid and submandibular glands (Fig. 3).
Fig. 1.
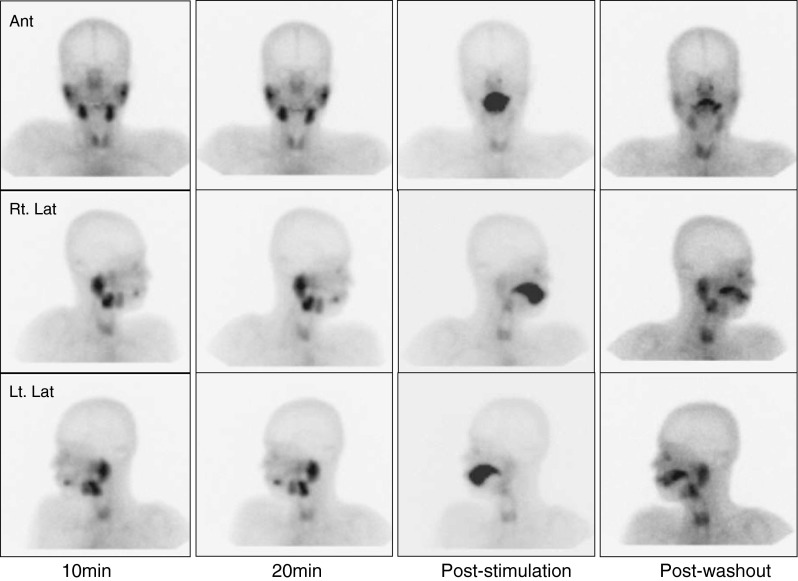
A normal salivary gland scintigraphic finding
Fig. 2.

An intermediate salivary gland scintigraphic finding
Fig. 3.
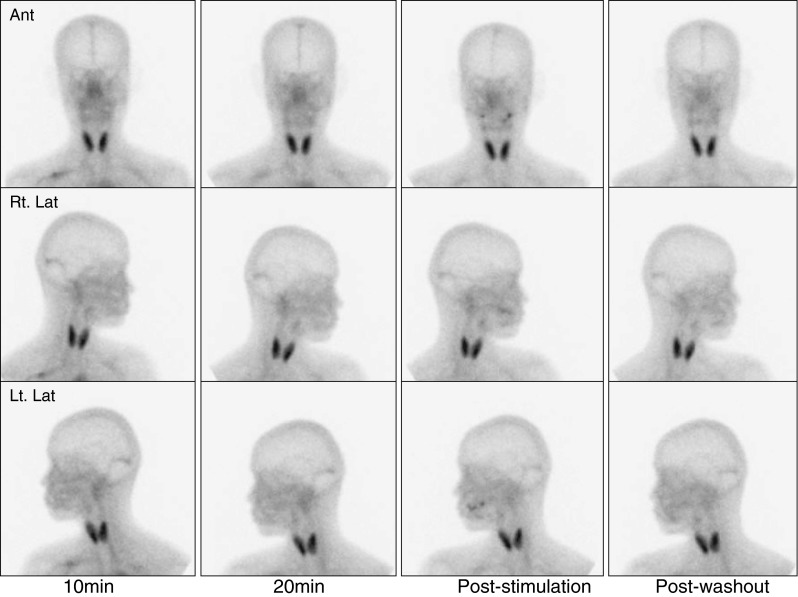
An abnormal salivary gland scintigraphic finding
Scintigraphic Parameters
Region of interests (ROIs) around salivary glands were drawn manually on anterior images (Fig. 4). ROIs contained at least 100 pixels for parotid and 80 pixels for submandibular glands. Square ROIs placed over the frontal skull were used for background correction (9 × 9 = 81 pixels). The arithmetic means of right and left salivary gland parametric values were used in the analysis. The uptake ratios and percentage excretions of salivary glands were defined as follows:
 |
(PU = parotid uptake ratio, SU = submandibular uptake ratio, %PE = percentage parotid excretion, %SE = percentage submandibular excretion, P20 = counts/pixel of parotid glands in 20-min images, SM20 = counts/pixel of submandibular glands in 20-min images, BG20 = counts/pixel of background in 20-min images, Pwo = counts/pixel of parotid glands in post-washout images, SMwo = counts/pixel of submandibular glands in post-washout images, and BGwo = counts/pixel of background in post-washout images).
Fig. 4.

ROIs on an anterior salivary gland scintigraphic image (P parotid gland, SM submandibular gland, BG background)
Measurements of Unstimulated and Stimulated Whole Salivary Flow Rates
Salivary flow rates, the objective and quantitative gauge of xerostomia, were measured and compared with the scintigraphic parameters. Patients abstained from smoking, eating, and drinking for at least 2 h prior to salivary flow rate measurements. To measure unstimulated whole salivary flow rates, patients were allowed to rest seated for 5 min. After discarding first saliva, whole saliva was collected for 20 min into a pre-weighed disposable cup. Weights of collected saliva were then determined; its density was assumed to be 1 g/ml. The abnormal criterion for unstimulated whole salivary flow was set at ≤0.1 ml/min. To measure stimulated salivary flow rates, patients were again allowed to rest for 5 min. Ten seconds after chewing paraffin wax, initially pooled saliva was discarded and then saliva was collected for 5 min. The abnormal criterion for stimulated whole salivary flow was set at ≤0.7 ml/min [12]. The whole salivary flow rates were measured in 51 patients (26 SS patients and 25 controls).
Statistical Analysis
Statistical analysis was performed using SPSS software (version 15.0.0). All numerical values are expressed as means ± standard deviations. One-way ANOVA was used to compare the parametric values of SS, post-RAI, and control patients. Pairwise comparisons were performed using Dunnett’s post-hoc analysis. Chi-square test was used for non-parametric data comparisons. Correlations between salivary flow rates and scintigraphic parameters were examined using Pearson’s correlation coefficient test. P values of <0.05 were considered significant.
Results
Correlations between Scintigraphic Parameters and Whole Salivary Flow (WSF)
The four scintigraphic parameters were examined with respect to correlations with unstimulated and stimulated WSF values (Table 1). SU (R = 0.4155, p < 0.01) and %SE (R = 0.3463, p < 0.05) were found to be positively correlated with unstimulated WSF, whereas PU and %PE showed no significant correlation. On the other hand, PU (R = 0.5439, p < 0.01), SU R = 0.5145, p < 0.01), %PE (R = 0.4744, p < 0.01), and %SE (R = 0.3909, p < 0.01) were found to be significantly and positively correlated with stimulated WSF (Table 1).
Table 1.
Correlations between scintigraphic parameters and whole salivary flow rate (WSF)
| Group | PU | SU | %PE | %SE |
|---|---|---|---|---|
| Unstimulated WSF | 0.1990 | 0.4155** | 0.2471 | 0.3463* |
| Stimulated WSF | 0.5439** | 0.5145** | 0.4744** | 0.3909** |
The numbers shown are correlation coefficients
PU parotid uptake ratio, SU submandibular uptake ratio, %PE percent parotid excretion, %SE percent submandibular excretion
* p < 0.05, ** p < 0.01
Salivary Gland Scintigraphy Parameters
All scintigraphic parameters were significantly lower in SS patients than in thyroid cancer post-RAI or controls (Figs. 5, 6, 7 and 8). Only %PE was significantly lower in post-RAI patients than in controls (Fig. 7). In brief, PU was significantly lower in SS (4.04 ± 1.96) than in post-RAI (4.92 ± 1.36, p = 0.016) or control (5.49 ± 1.63, p = 0.001) patients (Fig. 5). Similarly, SU was significantly lower in SS (4.14 ± 1.09) than in post-RAI (5.79 ± 1.44, p < 0.001) or control (6.13 ± 1.89, p < 0.001) patients (Fig. 6). In addition, %PE was significantly lower in SS (25.2 ± 23.7) than in post-RAI (39.0 ± 14.9, p < 0.001) or control (47.3 ± 12.1, p < 0.001) patients, and was also significantly lower in post-RAI patients than in control patients (p = 0.039) (Fig. 7). Finally, %SE was significantly lower in SS (15.3 ± 10.1) than in post-RAI (26.8 ± 12.5, p < 0.001) or control (31.9 ± 14.4, p < 0.001) patients (Fig. 8).
Fig. 5.

Parotid uptake ratio (PU). PU was significantly lower in SS patients (4.04 ± 1.96) than in thyroid cancer patients post-RAI (4.92 ± 1.36) or controls (5.49 ± 1.63) (p < 0.05)*
Fig. 6.

Submandibular uptake ratio (SU). SU was significantly lower in SS patients (4.14 ± 1.09) than in post-RAI (5.79 ± 1.44) or control patients (6.13 ± 1.89) (p < 0.001)*
Fig. 7.

Percentage parotid excretion (%PE). %PE was significantly lower in SS patients (25.2 ± 23.7) than in post-RAI (39.0 ± 14.9) or control patients (47.3 ± 12.1) (p < 0.001)*, and was also significantly lower in post-RAI patients than in control patients (p < 0.05)**
Fig. 8.

Percentage submandibular excretion (%SE). %SE was significantly lower in SS patients (15.3 ± 10.1) than in post-RAI (26.8 ± 12.5) or control patients (31.9 ± 14.4) (p < 0.001)*
Visual Assessments of Salivary Gland Scintigraphy Images
In the visual assessments of SGS images, SS patients had eight normal, eight intermediate, and 12 abnormal findings; post-RAI patients had 70 normal, 22 intermediate, and no abnormal finding; and control patients had 18 normal, nine intermediate, and one abnormal finding. Accordingly, 42.9% (12/28) of SS patients had an abnormal finding, but no post-RAI patient and only one (3.6% = 1/28) control patient had an abnormal finding. A normal finding was obtained more frequently in thyroid cancer patients post-RAI (76.1% = 70/92) and in control patients (64.3% = 18/28), and about 30% of SS patients (28.6% = 8/28) had a normal finding. An intermediate finding was obtained in 28.6% (8/28) of SS patients, in 23.9% (22/92) of thyroid cancer patients post-RAI, and in 32.1% (9/28) of controls.
Discussion
In the present study, significant differences were found between the scintigraphic parameters of SS patients and thyroid cancer patients after RAI therapy. SS patients showed lower values for all four SGS parameters than thyroid cancer patients or controls (Figs. 5, 6, 7 and 8). Thyroid cancer patients post-RAI had significantly lower %PE levels than the controls (Fig. 7). As the thyroid cancer patients underwent SGS immediately after their first RAI administration, early manifestations of salivary gland dysfunction could be appreciated in the SGS.
Submandibular glands were more specifically affected in SS patients, whereas parotid glands were primarily involved in thyroid cancer patients. Both parotid and submandibular glands are affected by SS, but the submandibular glands appear to be more specifically related to the disease process of SS than the parotid glands. In terms of correlations between scintigraphic parameters and unstimulated whole salivary flow rates (an objective criterion in the current SS classification system), no relation was found for parotid scintigraphic parameters (PU and %PE), whereas correlations were found for submandibular scintigraphic parameters (SU and %SE) (Table 1). The unstimulated whole salivary flow rate is more closely related to xerostomia than the stimulated salivary flow rate because patients usually feel the dry mouth in resting state rather than in a kind of stimulated state. In the literature, altered SGS findings during the early stage of SS mainly concern submandibular glands [6, 9–12]. For example, severe xerostomia has been reported to be related to abnormal time-activity-curve (TAC) patterns of both parotid and submandibular glands, whereas less severe xerostomia has been reported to be associated with only abnormal submandibular TAC patterns [6, 12]. Furthermore, progressions of lip biopsy [9] and contrast sialography [10] findings from low to high grade have been reported to coincide with SGS deviations of abnormal submandibular glands first, and then abnormal parotid and submandibular glands. The reason why a submandibular abnormality was a more specific finding in the SGS images of SS patients was not addressed during the present study. However, the submandibular glands are major contributors to basal saliva (they contribute more than 70%) [13], and thus, such a minor alteration in the submandibular glands caused by the disease process might be serious enough to have patients feel xerostomia. On the other hand, the parotid glands appear to be primarily affected by RAI therapy [8]. In the present study, thyroid cancer patients underwent SGS at 4 weeks after RAI administration; SGS findings at this early stage have not been reported previously. In fact, altered SGS findings have usually been described at least 6 months after RAI therapy [8, 14]. Therefore, the reduced parotid gland excretory function (%PE) observed in the present study may be due to an immediate response of the parotid glands to radiation therapy [15, 16]. The reason why parotid glands are more susceptible to the RAI therapy may be related to the constitutions of salivary glands. The parotid glands consist entirely of serous cells that are sensitive to radiation [17]. However, the submandibular glands contain a small proportion of mucous cells, of which the mucous component may protect the submandibular glands from radiation [14].
In the present study, we adopted static SGS rather than the traditional sequential SGS [5–7, 18]. We believe that traditional sequential SGS [5] and subsequent TAC analysis [6, 7] have shortcomings with respect to the evaluations of minute salivary gland changes for the following reasons. First, TAC data are not easily interpreted, visual assessments often cause mild-degree SS patients to be missed [6, 19], and quantitative TAC parameters have not been validated in terms of the diagnosis of SS [13]. Second, the continuous acquisition of dynamic images for more than 30 min is not easily endured by patients, and patient motion must be carefully monitored and corrected [19]. Third, spontaneous discharge of saliva from salivary glands often makes it difficult to evaluate gland function by TAC [12, 13]. Finally, the smoothing procedure usually applied to TAC might obscure spontaneous discharges from salivary glands [9, 10, 20]. On the other hand, the scintigraphic parameters of static SGS are derived from two static images obtained before and after gustatory stimulation, and multiple spontaneous discharges of saliva are integrated into static images. Multiple static images are usually obtained easily, and patient motion is not as serious a problem as during the TAC analysis of sequential SGS. In this regard, the analysis of multiple static images may be more relevant to the evaluation of salivary gland dysfunction than sequential SGS [18]. However, further studies are essential because in the present study we did not perform sequential SGS simultaneously in patients that had undergone static SGS.
There are some limitations in the present study. First, the control patients were not completely healthy. They had visited the rheumatology clinic for salivary gland evaluation but turned out to be non-SS. However, other unknown disease involving the salivary glands may have been affecting the dry mouth symptom of the control patients. This might be the reason why the visual assessment revealed intermediate or abnormal pattern of SGS in 35.7% (=10/28) of the control patients. If we could have recruited healthy control patients, the SGS findings of SS and post-RAI patients would have been more detrimental compared with those of control patients. Second, there were appreciable overlaps of the scintigraphic parameters between disease groups and control. Further study with more enrolled patients may address this problem.
In conclusion, the scintigraphic parameters of salivary glands were found to differ between SS patients and thyroid cancer patients after RAI therapy. All four scintigraphic parameters examined, that is, PU, SU, %PE, and %SE, were lower in SS patients, and in particular, submandibular gland scintigraphic parameters (SU and %SE) were found to be correlated with the unstimulated whole salivary flow rate, one of the diagnostic criteria of SS. On the other hand, only the parotid gland excretory functional parameter (%PE) was reduced in post-RAI patients. The present study shows that SGS provides an excellent means for the evaluation of xerostomia in both Sjögren’s syndrome patients and radioiodine treated thyroid cancer patients. The usefulness of the static scintigraphic parameters needs to be evaluated through further studies particularly in thyroid cancer patients post RAI therapy.
Acknowledgements
This work was supported by grant no. 02-2008-003 from the SNUBH Research Fund.
References
- 1.Manthorpe R. Sjogren’s syndrome criteria. Ann Rheum Dis. 2002;61:482–4. doi: 10.1136/ard.61.6.482. [DOI] [PMC free article] [PubMed] [Google Scholar]
- 2.Vitali C, Bombardieri S, Jonsson R, Moutsopoulos HM, Alexander EL, Carsons SE, et al. Classification criteria for Sjogren’s syndrome: a revised version of the European criteria proposed by the American-European Consensus Group. Ann Rheum Dis. 2002;61:554–8. doi: 10.1136/ard.61.6.554. [DOI] [PMC free article] [PubMed] [Google Scholar]
- 3.Alexander C, Bader JB, Schaefer A, Finke C, Kirsch CM. Intermediate and long-term side effects of high-dose radioiodine therapy for thyroid carcinoma. J Nucl Med. 1998;39:1551–4. [PubMed] [Google Scholar]
- 4.Solans R, Bosch JA, Galofre P, Porta F, Rosello J, Selva-O’Callagan A, et al. Salivary and lacrimal gland dysfunction (sicca syndrome) after radioiodine therapy. J Nucl Med. 2001;42:738–43. [PubMed] [Google Scholar]
- 5.Schall GL, Anderson LG, Wolf RO, Herdt JR, Tarpley TM, Jr, Cummings NA, et al. Xerostomia in Sjogren’s syndrome. Evaluation by sequential salivary scintigraphy. JAMA. 1971;216:2109–16. doi: 10.1001/jama.216.13.2109. [DOI] [PubMed] [Google Scholar]
- 6.Sugihara T, Yoshimura Y. Scintigraphic evaluation of the salivary glands in patients with Sjogren’s syndrome. Int J Oral Maxillofac Surg. 1988;17:71–5. doi: 10.1016/S0901-5027(88)80151-6. [DOI] [PubMed] [Google Scholar]
- 7.Nishiyama S, Miyawaki S, Yoshinaga Y. A study to standardize quantitative evaluation of parotid gland scintigraphy in patients with Sjogren’s syndrome. J Rheumatol. 2006;33:2470–4. [PubMed] [Google Scholar]
- 8.Caglar M, Tuncel M, Alpar R. Scintigraphic evaluation of salivary gland dysfunction in patients with thyroid cancer after radioiodine treatment. Clin Nucl Med. 2002;27:767–71. doi: 10.1097/00003072-200211000-00003. [DOI] [PubMed] [Google Scholar]
- 9.Umehara I, Yamada I, Murata Y, Takahashi Y, Okada N, Shibuya H. Quantitative evaluation of salivary gland scintigraphy in Sjorgen’s syndrome. J Nucl Med. 1999;40:64–9. [PubMed] [Google Scholar]
- 10.Aung W, Yamada I, Umehara I, Ohbayashi N, Yoshino N, Shibuya H. Sjogren's syndrome: comparison of assessments with quantitative salivary gland scintigraphy and contrast sialography. J Nucl Med. 2000;41:257–62. [PubMed] [Google Scholar]
- 11.Adams BK, Al Attia HM, Parkar S. Salivary gland scintigraphy in Sjogren’s syndrome: are quantitative indices the answer? Nucl Med Commun. 2003;24:1011–6. doi: 10.1097/00006231-200309000-00010. [DOI] [PubMed] [Google Scholar]
- 12.Hakansson U, Jacobsson L, Lilja B, Manthorpe R, Henriksson V. Salivary gland scintigraphy in subjects with and without symptoms of dry mouth and/or eyes, and in patients with primary Sjogren’s syndrome. Scand J Rheumatol. 1994;23:326–33. doi: 10.3109/03009749409099282. [DOI] [PubMed] [Google Scholar]
- 13.Hermann GA, Vivino FB, Shnier D, Krumm RP, Mayrin V, Shore JB. Variability of quantitative scintigraphic salivary indices in normal subjects. J Nucl Med. 1998;39:1260–3. [PubMed] [Google Scholar]
- 14.Raza H, Khan AU, Hameed A, Khan A. Quantitative evaluation of salivary gland dysfunction after radioiodine therapy using salivary gland scintigraphy. Nucl Med Commun. 2006;27:495–9. doi: 10.1097/00006231-200606000-00004. [DOI] [PubMed] [Google Scholar]
- 15.Valdes Olmos RA, Keus RB, Takes RP, van Tinteren H, Baris G, Hilgers FJ, et al. Scintigraphic assessment of salivary function and excretion response in radiation-induced injury of the major salivary glands. Cancer. 1994;73:2886–93. doi: 10.1002/1097-0142(19940615)73:12<2886::AID-CNCR2820731203>3.0.CO;2-K. [DOI] [PubMed] [Google Scholar]
- 16.Liem IH, Olmos RA, Balm AJ, Keus RB, van Tinteren H, Takes RP, et al. Evidence for early and persistent impairment of salivary gland excretion after irradiation of head and neck tumours. Eur J Nucl Med. 1996;23:1485–90. doi: 10.1007/BF01254473. [DOI] [PubMed] [Google Scholar]
- 17.Stephens LC, Schultheiss TE, Price RE, Ang KK, Peters LJ. Radiation apoptosis of serous acinar cells of salivary and lacrimal glands. Cancer. 1991;67:1539–43. doi: 10.1002/1097-0142(19910315)67:6<1539::AID-CNCR2820670613>3.0.CO;2-Q. [DOI] [PubMed] [Google Scholar]
- 18.Anjos DA, Etchebehere EC, Santos AO, Lima MC, Ramos CD, Paula RB, et al. Normal values of [99mTc]pertechnetate uptake and excretion fraction by major salivary glands. Nucl Med Commun. 2006;27:395–403. doi: 10.1097/01.mnm.0000202864.52046.b1. [DOI] [PubMed] [Google Scholar]
- 19.Loutfi I, Nair MK, Ebrahim AK. Salivary gland scintigraphy: the use of semiquantitative analysis for uptake and clearance. J Nucl Med Technol. 2003;31:81–5. [PubMed] [Google Scholar]
- 20.Kim SJ, Choi HY, Kim IJ, Kim YK, Jun S, Nam HY, et al. Limited cytoprotective effects of amifostine in high-dose radioactive iodine 131-treated well-differentiated thyroid cancer patients: analysis of quantitative salivary scan. Thyroid. 2008;18:325–31. doi: 10.1089/thy.2007.0191. [DOI] [PubMed] [Google Scholar]