

Abstract
Island biogeographic studies traditionally treat single islands as units of analysis. This ignores the fact that most islands are spatially nested within archipelagos. Here, we took a fundamentally different approach and focused on entire archipelagos using species richness of vascular plants on 23 archipelagos worldwide and their 174 constituent islands. We assessed differential effects of biogeographic factors (area, isolation, age, elevation), current and past climate (temperature, precipitation, seasonality, climate change velocity) and intra-archipelagic spatial structure (archipelago area, number of islands, area range, connectivity, environmental volume, inter-island distance) on plant diversity. Species diversity of each archipelago (γ) was additively partitioned into α, β, nestedness and replacement β-components to investigate the relative importance of environmental and spatial drivers. Multiple regressions revealed strong effects of biogeography and climate on α and γ, whereas spatial factors, particularly number of islands, inter-island distance and area range, were key to explain β. Structural equation models additionally suggested that γ is predominantly determined by indirect abiotic effects via its components, particularly β. This highlights that β and the spatial arrangement of islands are essential to understand insular ecology and evolution. Our methodological framework can be applied more widely to other taxa and archipelago-like systems, allowing new insights into biodiversity origin and maintenance.
Keywords: α-diversity, archipelago, β-diversity, γ-diversity, spatial variables, species richness
1. Introduction
The origin and maintenance of island biodiversity is of key interest in ecology, biogeography and evolution [1–3]. Islands are ideal study systems because they are comparatively small, have distinct boundaries, and their biotas are usually less complex than those on adjacent continents. Many isolated islands and archipelagos exhibit striking examples of evolutionary diversification (e.g. [3,4]). Consequently, island research has made essential contributions to our understanding of key ecological and evolutionary processes, including immigration and extinction [1], speciation and adaptive radiation [3,5,6], founder effects and genetic drift [7], and taxon cycles [8].
Most previous studies have related biogeographic and climatic island characteristics to patterns of species richness and endemism [2,9,10]. The seminal equilibrium theory of island biogeography by MacArthur & Wilson [1] emphasized the role of area and geographical isolation as key factors for community assembly and species numbers on islands. More recently, the importance of time for insular biodiversity dynamics has been highlighted, especially for oceanic islands [2,3,10]. These dynamic models of species richness on islands emphasize that diversity not only depends on area and isolation, but also on the age and the geological ontogeny of islands and the associated changes in ecological conditions [11–13]. Finally, strong effects of other environmental determinants such as modern macroclimate, elevation and habitat heterogeneity have also been shown to influence insular biodiversity [9,14,15].
Common to most studies on determinants of island biodiversity is their focus on individual islands as the unit of analysis, disregarding their spatial organization within archipelagos. To date, species diversity within archipelagic settings has been studied only for a limited number of iconic archipelagos such as the Canaries, Azores, Hawaii, or Galapagos (e.g. [15–17]). This small number of well-studied archipelagos has so far precluded robust statistical analyses on the role of intra-archipelagic variables on island biodiversity [17]. Nevertheless, there is evidence that the spatial structure of islands within archipelagos plays a major role in shaping the evolutionary distinct biodiversity of islands and archipelagos, e.g. via speciation and adaptive radiations [3] or dispersal and taxon-cycle dynamics [8]. Moreover, the number of species on an island not only depends on the island's distance to the mainland but also on the availability of stepping stones and the amount of landmass in the surroundings [18]. Consequently, isolation and inter-island connectivity also need to be considered within archipelagos as proxies for the intra-archipelagic spatial structure.
Integrating the intra-archipelagic spatial arrangement of islands into an analysis not only requires the quantification of new sets of environmental factors [19], but also the consideration of an intra-archipelagic scale, which can be extended to diversity data. For instance, it is important to quantify the species diversity of individual islands (α) and the differences among islands (β) that result in the species diversity of the entire archipelago (γ). Furthermore, β can be partitioned into nestedness (βnst) and replacement (βrpl) components to quantify the nestedness and dissimilarity across sites [20,21]. For archipelagos, it has been shown that the relative proportions of α, βnst and βrpl can considerably vary across space [17]. However, it remains unclear to what extent abiotic factors related to archipelagic environment, geology or intra-archipelagic structure differentially affect these diversity components.
Biogeographic, climatic and spatial factors may play differential roles in influencing the components of archipelagic diversity. Insular and continental studies suggest that α is strongly affected by area and local scale environmental heterogeneity (e.g. [22]), whereas β is strongly driven by large-scale environmental heterogeneity (e.g. [23,24]) and spatial landscape structure [25,26]. Considering that γ-diversity results from both its α- and β-components, potential abiotic drivers may actually affect γ indirectly via α and β rather than directly [27]. Spatial intra-archipelagic structure may be important for γ-diversity because of its effects on the β-component, namely species turnover among individual islands. Hence, the intra-archipelagic spatial structure could have an indirect effect on γ-diversity via its β-component. However, it is reasonable to assume that biogeography (e.g. isolation and area) and climate (e.g. temperature) still affect archipelagic γ-diversity directly, as has been recently suggested for breeding birds at a continental scale [27].
Here, we provide a comprehensive global assessment of the determinants of α, β, βnst, βrpl and γ-diversity on oceanic archipelagos. We assembled a total of 15 abiotic variables and compiled species numbers of vascular plants for 23 archipelagos and their 174 constituent islands. In contrast to previous studies, we incorporate spatial variables in addition to classic biogeographic and climatic factors. We test to what extent variables describing the internal spatial structure of archipelagos (range in island area, environmental volume, number of islands, archipelago hull, connectivity and mean inter-island distance) affect α, β, βnst, βrpl, γ and the γ-independent ratios β/α and βrpl/βnst relative to biogeographic (island area, surrounding landmass proportion, age and elevation) and climatic (temperature, precipitation, temperature variation, precipitation variation and Late Quaternary climate change velocity of temperature) drivers. Specifically, we tested three hypotheses: H1, α is mainly related to biogeographic and climatic determinants; H2, β is mainly driven by intra-archipelagic spatial structure, with differential effects of island arrangement (e.g. inter-island distance, connectivity) on βnst and βrpl; and H3, γ is mainly driven by indirect effects, i.e. through biogeographic, climatic and intra-archipelagic drivers that act via the α- and β-components on γ-diversity.
2. Material and methods
(a). Diversity data
We assembled a global database including species numbers of vascular plants for 23 oceanic archipelagos and their 174 constituent islands (see the electronic supplementary material, appendix S1, for archipelagos and literature used; island-level data can be accessed at Dryad: http://doi.org/10.5061/dryad.3jv54). Within each archipelago, data were derived from literature sources applying standardized taxonomy. The archipelagos cover a wide range of climate zones, ocean basins and environmental characteristics (figure 1). We only considered islands larger than 1 km2. Islands that geologically belong to a larger island or to an atoll were merged with those and three islands with missing climate data were excluded (electronic supplementary material, appendix S1).
Figure 1.
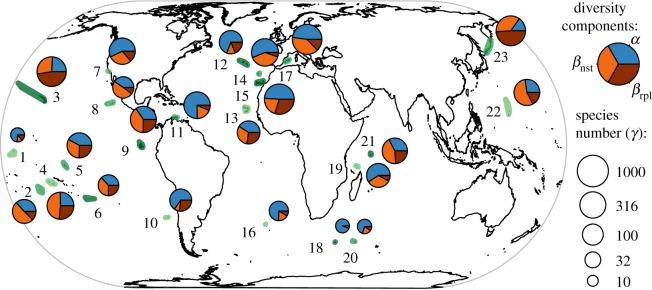
Archipelagic plant richness (γ) and α, nestedness (βnst) and replacement (βrpl) components. The vascular plant floras of the 23 archipelagos analysed are highlighted in green: 1, Phoenix Islands; 2, Cook Islands; 3, Hawai'i; 4, Society Islands; 5, Marquesas; 6, Pitcairn Islands; 7, Northern Californian Channel Islands; 8, Revillagigedo Islands; 9, Galapagos Islands; 10, Juan Fernandez Islands; 11, Dutch Caribbean; 12, Azores; 13, Cape Verde; 14, Madeira; 15, Canary Islands; 16, Tristan da Cunha; 17, Balearic Islands; 18, Prince Edward Islands; 19, Aldabra; 20, Crozet Islands; 21, Inner Seychelles; 22, Marianas; 23, Kuriles.
We additively partitioned [17,21] the diversity of an entire archipelago (γ) into α- and β-components (hereafter βA owing to its additive nature, following [28]). Total number of species per archipelago was defined as γ and the mean number of species per island for each archipelago as α. We calculated βA (‘absolute species turnover’, sensu [28]) as γ−α. We further partitioned βA into replacement (βrpl) and nestedness (βnst) components [17,20,21]. The βnst-component is given by (∑Smax−Si)/N, where Smax is the number of species of the most species-rich island (‘β-diversity due to area’ or βarea, sensu [21]), Si the number of species of the island i within the archipelago and N the number of islands in the archipelago. Consequently, βnst is the mean deviance of Si from Smax and equals Smax − α. We retained the term ‘nestedness’ [17], although βnst was not calculated based on species identities and thus deviates from other concepts of nested assemblages [20]. The βrpl-component is then simply βA−βnst, representing the part of βA that cannot be explained by sole differences in species richness among islands. All diversity components are species numbers, and thus can be also referred to species richness. The measured diversity components were strongly correlated (Pearson's r ≥ 0.77; electronic supplementary material, appendix S2), as expected owing to the additive partitioning [29,30]. Consequently, we additionally calculated ratios for βA/α (‘Whittaker's species turnover’ or βMt−1, sensu [28]) and βrpl/βnst. These ratios are independent of species richness: doubling species numbers does not double the ratios [28]. The ratios can therefore vary independently from γ, but can still be correlated with it, and indicate the importance of β relative to α and of βrpl relative to βnst. We further calculated a regional-to-local diversity ratio γ/α (also known as ‘Whittaker's β-diversity’ or ‘multiplicative beta’ [28]), but this measure was highly correlated with βA (Pearson's r = 0.74) and with the βA/α ratio (Pearson's r = 0.96) and was thus excluded from the analyses.
(b). Abiotic data
For each archipelago, we assembled a total of 15 abiotic predictor variables representing three categories: four classic island biogeographic (BioGeo), five present and past climatic (Clim), and six intra-archipelagic spatial (IntraArch) variables.
The four island biogeographic variables were island area (in square kilometres), surrounding landmass proportion (unitless), age of the oldest island (in million years), and maximum elevation (in metres). Island area was calculated as the planar land area. As a measure of island isolation, we used surrounding landmass proportion, which is an inverse proxy for isolation from a hypothetical source pool and a strong predictor of the number of plant species on islands worldwide as it accounts also for coastline shape and neighbouring islands. We calculated the proportion of landmass in buffer distances of 100, 1000 and 10 000 km around the perimeter of each archipelago (ArcGIS v. 9.3.1., ESRI, Redlands, CA, USA). Proportions were summed up and the sum was log10-transformed after adding 0.5 as a constant [18]. For archipelago age, we collected the age of the oldest island per archipelago (in million years) from the literature (electronic supplementary material, appendix S1). Island age gives an estimate of time for colonization and speciation [12]. Finally, elevation was quantified as the maximum elevation within an archipelago and obtained from [19]. This measure is commonly used to represent habitat heterogeneity within single islands (e.g. [9]).
The five climatic variables were annual mean temperature (in °C), annual precipitation (in millimetre per year), annual range in temperature (in °C, as a measure for temperature seasonality), the coefficient of variation of precipitation (unitless, as a measure for precipitation seasonality) and climate change velocity of temperature (in metres per year) since the last glacial maximum (21 000 years BP). Current climate is a well-known determinant of plant richness at macro-scales on both islands and mainlands [9,31]. Instead, Late Quaternary climate change velocity reflects climate displacement rate as an important determinant of endemic species and can be interpreted as the required speed to keep track with climate change since the last glacial maximum while accounting for topography [32]. Mean values for all climatic variables were calculated for each archipelago based on values for individual islands taken from [19].
The six intra-archipelagic variables were range in island area (in square kilometres), environmental volume (unitless), number of islands (count), archipelago hull (in square kilometres), connectivity (unitless) and mean inter-island distance (in kilometres). Island area range was calculated as the difference between minimum and maximum area size of islands within each archipelago. We calculated an environmental volume as an integrative measure of intra-archipelagic environmental heterogeneity. We quantified these volumes as the three-dimensional convex hull occupied by the islands of each archipelago in the ordination space of a principal component analysis (PCA, axes 1–3, 72.4% of total variation) which included 17 883 islands worldwide and 10 bioclimatic and physical variables (see [19] and the electronic supplementary material, figure S1 for details). In contrast to maximum elevation as a measure of archipelagic environmental heterogeneity, this metric considers multiple factors contributing to heterogeneity among individual islands of an archipelago. To quantify the area of the entire archipelago, we calculated minimum convex hulls (in ArcGIS v. 10) enclosing all islands of each archipelago and derived their areas at an equal area map projection. This represented the entire area occupied by an archipelago, including both land and ocean areas. We further calculated inter-island connectivity by integrating area sizes, inter-island distances and spatial arrangement (introduced as ‘integrated index of connectivity’ by Pascual-Hortal & Saura [33]). Mean inter-island distance was calculated by averaging all pairwise shortest distances between island coastlines using an azimuthally equidistant map projection centred separately for each island (ArcGIS v. 9.3.1.). All calculations were based on high-resolution island polygons (gadm.org/version1).
The values of biogeographic, climatic and intra-archipelagic variables are provided in the electronic supplementary material, appendix S1. These tables also include additional variables used for initial single-predictor analyses, which were later excluded from multi-predictor analyses to avoid overfitting and multicollinearity (see the electronic supplementary material, appendix S2 for correlation matrices). To improve residual normality, we log10-transformed all diversity components and abiotic factors, except for archipelago age, annual mean temperature and annual precipitation.
(c). Statistical analyses
We applied multiple linear regressions and multi-model inference based on the Akaike Information Criterion corrected for small sample sizes (AICc, [34]) to assess the relative importance of each predictor variable across all possible variable combinations. To investigate whether relationships between abiotic variables and γ-diversity are direct or indirect, we used structural equation models (SEM) that allow evaluating hypothesized causal effects in datasets with multiple, hierarchically structured dependent variables [35].
As response variables in multiple regressions, we used the diversity components (γ, α, βA, βrpl, βnst) and their ratios (βA/α and βrpl/βnst). We calculated models for all possible combinations of the 15 predictor variables and used AICc to identify minimum adequate models for each response variable. Variable importance was assessed by weighting standardized regression coefficients by AICc-weights and adding them up for all models in which a variable was included [34]. Predictor variables were standardized (zero mean, unit variance) to obtain quantitatively comparable regression coefficients. To test for spatial autocorrelation in the residuals of minimum adequate models, we calculated global Moran's I-values and compared non-spatial regression models with simultaneous autoregressive (SAR) models of the error-type I [36]. The optimal number of neighbours (tested for k = 1–15 neighbours) for building neighbourhood matrices were identified based on Moran's I-values and their significance levels [36]. Moran's I-values for all model residuals were not significant (p < 0.05). We therefore present only results from non-spatial regression models below.
To prevent overfitting and problems arising from multicollinearity among predictor variables (see the electronic supplementary material, tables S6 and S7), we reduced the number of predictors in SEMs by performing separate PCAs for the three groups of variables (BioGeo, Clim and IntraArch). From each PCA, we considered all axes that cumulatively contained greater than or equal to 75% of the variation. This resulted in two axes for the biogeographic PCA (BioGeo 1–2), three axes for the climatic PCA (Clim 1–3) and two axes for the intra-archipelagic PCA (IntraArch 1–2). We initially constructed full SEMs with all possible paths from the PCA axes to γ-diversity and to the components of γ-diversity and from the components to γ-diversity. We performed four SEMs to test the indirect influences of biogeographic, climatic and intra-archipelagic variables on γ-diversity via: (i) α and βA, (ii) βrpl and βnst, (iii) the ratio βA/α, and (iv) the ratio βrpl/βnst. From the full SEMs, we subsequently excluded non-significant paths with the highest p-values in a stepwise procedure until all remaining paths were statistically significant (p < 0.05). At each step, we evaluated residual correlations, modification indices and model fits of the SEMs and used χ2-tests, the root mean square error (RMSE) of approximation and the comparative fit index as measures of model fit [35]. All final SEMs had satisfactory fits as indicated by p-values of χ2-tests > 0.05, lower 90% confidence intervals of the RMSE of approximation less than 0.05 and the comparative fit index more than 0.90 (electronic supplementary material, table S3). We tested for spatial autocorrelation in SEMs by calculating Moran's I-values for the residuals of multiple non-spatial ordinary least square regression models similar to those in the final SEMs. In only two out of 10 cases, Moran's I-values (less than or equal to 0.2) were statistically significant indicating spatial autocorrelation. For these models, we fitted SAR models of the error-type I [36] with similar neighbourhood structures as above. Model coefficients of spatial models only minimally diverged from the coefficients of ordinary least-squares regression models (electronic supplementary material, table S3) and we thus report only non-spatial SEMs below. Overall, spatial autocorrelation, and thus potential pseudo-replication in space, did not seem to play an important role in our dataset, probably because archipelagos are far from each other and their floras most probably originated from independent biogeographic dynamics.
All statistical analyses were performed in R statistical programming language (v. 2.15.3, http://www.R-project.org). SEMs were calculated using library ‘lavaan’, Moran's I and SAR models were calculated using library ‘spdep’, and three-dimensional convex hulls for environmental volume were calculated using library ‘geometry’.
3. Results
Both the absolute and relative contributions of the different diversity components varied greatly among the 23 archipelago floras (figure 1). γ-richness ranged between 27 and 1379 (mean = 489 ± 418 s.d.) species (figure 1). The relative contributions of the α- and βA-components to γ also varied considerably, with α contributing up to 94% on the Prince Edward Islands but only 15% on the Kuriles (figure 1). The βrpl-component had the highest contribution on the Juan Fernandez Islands (77% of βA). Perfectly nested species assemblages were found on the Prince Edward Islands (βnst 100% of βA; figure 1).
Biogeographic variables (surrounding landmass proportion and age) as well as climatic (annual mean temperature, temperature seasonality and Late Quaternary climate change velocity) were the most important determinants of γ-richness and the only significant determinants of α (table 1; for partial residual plots see the electronic supplementary material, figure S2). All these variables, except for Late Quaternary climate change velocity, had positive effects on α and γ. Additionally, the number of islands also positively influenced γ (table 1; electronic supplementary material, figure S2). Biogeographic, climatic and intra-archipelagic variables also affected the β-components, showing mostly positive relationships (βA, βnst and βrpl; table 1). Intra-archipelagic variables and total land area best explained the variation in βA/α and βrpl/βnst ratios (table 1; electronic supplementary material, figure S2). An increase in total area, number of islands, mean inter-island distance, and a decrease in archipelago hull and connectivity significantly increased the βA/α ratio (table 1). For the βrpl/βnst ratio, the range of island area rather than the number of islands was retained as significant determinant, decreasing the contribution of βrpl (table 1).
Table 1.
Minimum adequate models from ordinary least-squares regressions for 23 oceanic archipelagos worldwide. (Diversity components and their ratios were response variables and environmental variables were predictors. Predictors were grouped into biogeographic (BioGeo), climatic (Clim) and intra-archipelagic (IntraArch) variables. Model selection was based on values of the Akaike Information Criterion corrected for small sampling sizes (AICc) across models with all possible factor combinations. Std. coeff., standardized coefficient; s.d., standardized deviation; Statistical significance in probability tests are indicated by asterisks. #0.1 > p > 0.05, *0.05 > p > 0.01, **0.01 > p > 0.001, ***p < 0.001.)
| response (r2) | predictor | category | std. coeff. ± s.d. | t-value | p-value |
|---|---|---|---|---|---|
| γ (0.88) | intercept | 2.48 ± 0.04 | 57.32 | *** | |
| surrounding landmass proportion | BioGeo | 0.21 ± 0.06 | 3.42 | ** | |
| age | BioGeo | 0.14 ± 0.05 | 2.70 | * | |
| annual mean temperature | Clim | 0.18 ± 0.06 | 3.10 | ** | |
| annual temperature range | Clim | 0.18 ± 0.07 | 2.52 | * | |
| climate change velocity | Clim | −0.21 ± 0.05 | −3.98 | *** | |
| number of islands | IntraArch | 0.15 ± 0.05 | 2.74 | * | |
| α (0.86) | intercept | 2.15 ± 0.04 | 57.43 | *** | |
| surrounding landmass proportion | BioGeo | 0.26 ± 0.05 | 5.23 | *** | |
| age | BioGeo | 0.11 ± 0.04 | 2.60 | * | |
| annual mean temperature | Clim | 0.16 ± 0.05 | 3.27 | ** | |
| annual temperature range | Clim | 0.11 ± 0.06 | 1.88 | # | |
| climate change velocity | Clim | −0.20 ± 0.04 | −4.54 | *** | |
| βA (0.82) | intercept | 2.15 ± 0.07 | 32.05 | *** | |
| age | BioGeo | 0.19 ± 0.08 | 2.58 | * | |
| maximum elevation | BioGeo | 0.21 ± 0.09 | 2.42 | * | |
| annual mean temperature | Clim | 0.44 ± 0.09 | 4.87 | *** | |
| annual temperature range | Clim | 0.38 ± 0.09 | 4.53 | *** | |
| number of islands | IntraArch | 0.21 ± 0.08 | 2.52 | * | |
| βnst (0.75) | intercept | 1.93 ± 0.08 | 25.62 | *** | |
| age | BioGeo | 0.17 ± 0.08 | 2.15 | * | |
| annual mean temperature | Clim | 0.38 ± 0.10 | 4.02 | *** | |
| annual temperature range | Clim | 0.30 ± 0.10 | 2.95 | ** | |
| island area range | IntraArch | 0.33 ± 0.09 | 3.78 | *** | |
| βrpl (0.85) | intercept | 1.70 ± 0.06 | 27.13 | *** | |
| total land area | BioGeo | −0.37 ± 0.17 | −2.18 | * | |
| surrounding landmass proportion | BioGeo | 0.51 ± 0.11 | 4.72 | *** | |
| climate change velocity | Clim | −0.43 ± 0.12 | −3.71 | ** | |
| number of islands | IntraArch | 0.56 ± 0.12 | 4.59 | *** | |
| mean inter-island distance | IntraArch | 0.17 ± 0.08 | 2.11 | * | |
| βA/α (0.85) | intercept | 1.43 ± 0.17 | 12.35 | *** | |
| total land area | BioGeo | 3.45 ± 1.05 | 3.30 | ** | |
| number of islands | IntraArch | 1.40 ± 0.24 | 5.95 | *** | |
| archipelago hull | IntraArch | −4.39 ± 1.05 | −4.20 | *** | |
| connectivity | IntraArch | −3.10 ± 0.96 | −3.24 | ** | |
| mean inter-island distance | IntraArch | 1.11 ± 0.28 | 3.98 | *** | |
| βrpl/βnst (0.79) | intercept | 0.78 ± 0.08 | 9.56 | *** | |
| total land area | BioGeo | 4.42 ± 1.32 | 3.35 | ** | |
| island area range | IntraArch | −1.90 ± 0.36 | −5.23 | *** | |
| archipelago hull | IntraArch | −2.67 ± 0.94 | −2.85 | * | |
| connectivity | IntraArch | −2.31 ± 0.98 | −2.35 | * | |
| mean inter-island distance | IntraArch | 0.45 ± 0.21 | 2.13 | * |
Relative variable importance was given by AICc-weighted standardized regression coefficients of all possible regression models and revealed that the main determinants were generally consistent with the minimum adequate models, but with some noteworthy differences (compare figure 2 and table 1). First, climatic variables were the strongest determinants of α, βA and γ, but precipitation-related variables consistently played minor roles (figure 2). Second, intra-archipelagic variables were the strongest determinants of βrpl, βnst, βA/α and βrpl/βnst. Third, for βA and βrpl, the number of islands was the strongest intra-archipelagic determinant. Finally, the range of island areas and environmental volume also played an important role for βnst.
Figure 2.
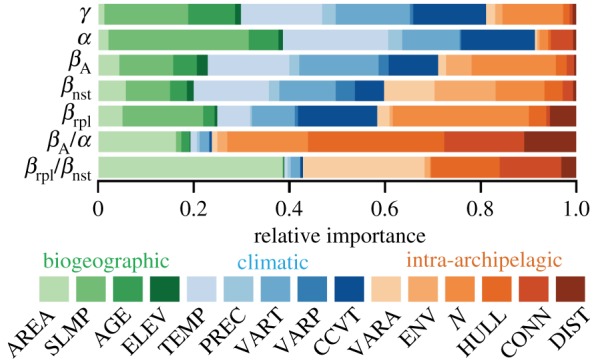
Relative importance of abiotic variables affecting vascular plant diversity components. Relative importance was obtained from AICc-weighted standardized coefficients of linear regression models including all possible factor combinations (N = 23 archipelagos). Note the different importance of biogeographic variables to α, γ and βrpl/βnst, and of intra-archipelagic variables to all β-components and ratios. Variables: AREA, island area; SLMP, surrounding landmass proportion; AGE, age of the oldest island; ELEV, maximum island elevation; TEMP, annual mean temperature; PREC, annual precipitation; VART, variation in annual temperature (range); VARP, coefficient of variation of precipitation; CCVT, climate change velocity of temperature; VARA, variation in island area (range); ENV, environmental volume; N, number of islands; HULL, archipelago hull; CONN, connectivity; DIST, mean inter-island distance.
SEMs revealed that both α- and β-components had strong direct effects on γ (compare path coefficients in figure 3a and relative contributions in figure 1). These effects were predominantly mediated via direct effects of biogeographic, climatic and intra-archipelagic variables on α and βA, respectively. By contrast, direct effects of biogeographic and climatic drivers on γ were considerably weaker than those on α and βA, whereas intra-archipelagic variables did not show any direct effects on γ (figure 3a). Both βrpl and βnst were explained by similarly strong direct effects of biogeographic, climatic and intra-archipelagic variables, whereas direct effects of these variables on γ were much weaker (figure 3b). The βA/α ratio was affected only by a strong negative effect of IntraArch 1 (figure 3c). No direct effect of intra-archipelagic variables on γ remained in this SEM, with γ being solely driven by biogeographic and climatic variables and by a positive direct effect of βA/α (figure 3c). For the βrpl/βnst ratio, only biogeographic and intra-archipelagic variables were important, whereas biogeographic and climatic variables directly influenced γ (figure 3d). The βrpl/βnst ratio did not show a statistically significant link to γ in this SEM (figure 3d). In general, the effects of BioGeo and IntraArch axes were positive (except for βrpl/βnst) and those of Clim axes negative (compare figure 3a–d with figure 3e).
Figure 3.

Direct and indirect effects of biogeographic, climatic, and intra-archipelagic spatial factors on γ-richness. Structural equation models are based on principal component analysis (PCA) axes for (a) α and βA influencing γ; (b) ratio βA/α influencing γ; (c) βA replacement (βrpl) and βA nestedness (βnst) influencing γ and (d) ratio βrpl/βnst influencing γ. (e) illustrates PCA axes and the individual contributions of single variables to PCA axes. PCA axes refer to biogeographic (BioGeo 1–2), climatic (Clim 1 and 3) and intra-archipelagic (IntraArch 1–2) variables, with the amount of variation explained by the axes given in parentheses (see legend of figure 2 for abbreviations). Blue indicates positive and red negative relationships. Explained variance (r2) is given on top of the response variables. Standardized coefficients are given for each path. p-values: *0.05 > p > 0.01, **0.01 > p > 0.001 and ***p < 0.001. Arrow width is proportional to the effect size given by the coefficient. Note that to assess the relationship between response and abiotic variables, it is necessary to consider the signals of SEM paths and PCA axis loadings.
4. Discussion
Our study presents, to our knowledge, the most comprehensive analysis to date of plant diversity on archipelagos worldwide. Using archipelagos rather than islands as focal spatial units allowed us to analyse novel spatial (i.e. intra-archipelagic) variables along with classic biogeographic and climatic determinants of species diversity. This analysis revealed a strong effect of the internal spatial structure of archipelagos (e.g. mean inter-island distance and area range) on β-components and showed that intra-archipelagic variables mostly have indirect effects on γ via βA. By contrast, classical biogeographic and climatic variables predominantly affected γ-diversity via effects on α. We synthesize these findings in a general framework for testing the effects of biogeographic, climatic and intra-archipelagic drivers on multiple components of species diversity (figure 4). This conceptual framework provides relevant and testable predictions for other taxa and other archipelago-like systems.
Figure 4.
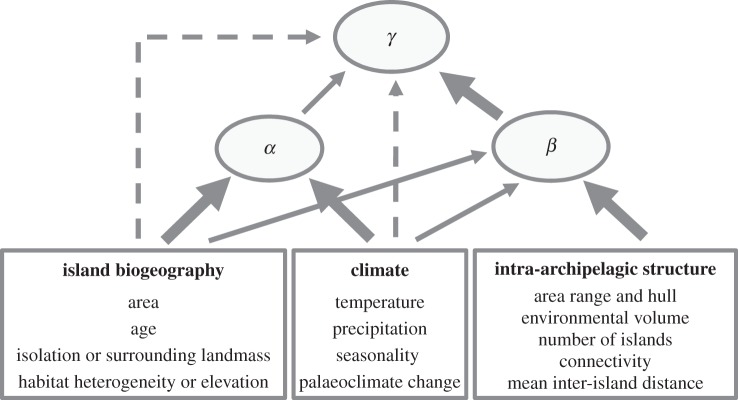
Generalized results and framework for addressing determinants of multiple components of species diversity in archipelago-like systems. The relationship strength between variables is indicated with dashed (weak effects), thin (intermediate effects) and thick arrows (strong effects). The framework is derived from vascular plant richness on oceanic archipelagos, but could be tested more widely in other archipelago-like systems (e.g. alpine communities, coral reefs, freshwater lakes, isolated seamounts, or isolated deserts).
(a). Effects on the α-component (H1)
α was mostly influenced by biogeographic variables and by past and present-day climate (table 1; figures 2 and 3a), suggesting that intra-archipelagic spatial structure generally plays a minor role for α-diversity within archipelagos (figure 4). This supported H1 and can be expected because the additive α-component is very similar to the number of species per island of most previous studies. For example, the importance of contemporary climate is in agreement with other island and mainland studies [9,31]. The positive effect of temperature follows the global pattern of increasing species diversity towards the equator [37,38] and might reflect the larger species pools of potential colonizers for tropical islands as well as positive effects on island carrying capacity. However, the unexpected positive effect of temperature seasonality might be caused by an overrepresentation of species-rich archipelagos in the subtropics of the Northern hemisphere and by the underrepresentation of species-rich tropical archipelagos in our dataset (owing to insufficient data). Besides current climate, we also found negative effects of Late Quaternary climate change velocity on α (figure 2). This driver has not yet been considered widely in island biogeography, but revealed a detectable influence of climate change since the last glacial maximum on current island diversity (in contrast to results for island palms, compare [39]).
Among the biogeographic determinants, α was positively correlated with island age and surrounding landmass proportion. The latter is in agreement with classic island biogeographic theory which predicts higher species richness on less isolated islands [1]. However, the relationship between archipelago age and richness has not yet been investigated in island biogeography. So far, island biogeographic models have focused on the age of single islands [12] rather than on the archipelago age, which might entail complex temporal and spatial dynamics.
(b). Effects on β-components (H2)
Confirming H2, the βA-component was largely determined by the intra-archipelagic spatial structure of islands (table 1; figures 2 and 3a), suggesting that this group of variables is the key driver of β-diversity in archipelago-like systems (figure 4). This became particularly evident for the βA/α ratio, which expresses the relative importance of βA over α independently from γ (figure 3c). Increasing environmental heterogeneity (via environmental volume and island area range) and dispersal limitation (via higher mean inter-island distance and lower connectivity) positively affected species turnover, similar to observations from mainland systems [27,40,41].
Both βnst and βrpl as well as the βrpl/βnst ratio were also most strongly affected by intra-archipelagic variables, but the role of each specific intra-archipelagic variable varied between the components, supporting H2 (table 1; figures 2 and 3b,d). Nestedness was mainly determined by the range in island areas and factors that were also associated with α (temperature, temperature seasonality and age). These effects could be explained by a larger area range, with the smallest islands being able to sustain only subsets of species of larger islands [42]. Moreover, the smallest islands might only be able to have a nested subset of species of larger islands because they are too small for in situ speciation [6]. By contrast, βrpl was more strongly driven by the number of islands and the mean inter-island distance. Increasing number of islands and inter-island distance might facilitate species replacement by making new habitat available while limiting intra-archipelago dispersal and gene flow [43,44] and by promoting speciation [17].
β-components were further considerably affected by present and past climate, surrounding landmass, elevation, age and total land area (table 1; figures 2 and 3). These effects support the notion that higher heterogeneity (via elevation and land area), temperature, isolation and age are closely associated with rates of speciation and species turnover [12,17,45]. In fact, increasing isolation between islands within an archipelago hampers gene flow between populations and thus promotes opportunities for speciation and diversification [46]. However, effects of palaeoclimatic changes on β-components have rarely been addressed before, and this deserves further attention in biogeography.
(c). Effects on γ-diversity (H3)
γ-diversity was predominantly driven by the direct effects of α, βA, βrpl and βnst, supporting the hypothesized indirect effects of abiotic factors on γ (H3). Importantly, βA had much stronger effects (std. path coefficient = 0.62) on γ than α (std. path coefficient = 0.39, figure 3a). In fact, the relative importance of βA over α (βA/α) retained a positive direct effect on γ (figure 3c). Hence, the intra-archipelagic variables which strongly affected βA suggest a strong indirect effect of spatial variables on γ (figure 4).
The strong direct effects of diversity components on γ were expected owing to the additive diversity partitioning approach (cf. [30]). Yet, indirect effects were especially pronounced for intra-archipelagic spatial variables, which had no direct effect on γ when considering βA/α and βrpl/βnst ratios. Direct effects of abiotic factors on γ were observed for both biogeographic and climatic variables, albeit with weak effects (table 1; figure 3c,d). The significant direct effects of age and surrounding landmass may reflect an interplay between geological history, speciation processes (including adaptive radiations) and island-hopping [2,8,46,47]. Older archipelagos may have higher richness simply because they had more time for colonization and speciation. A negative effect of Late Quaternary climate change velocity on patterns of endemism has been reported for mainland faunas [32]. Here, we showed a global-scale imprint of palaeoclimatic change on α- and β-components, and thus an effect that acts indirectly on γ-richness of archipelagic systems. In contrast to common assertions that geological dynamics are the main factor for determining species richness of archipelagos [47], we suggest that palaeoclimatic fluctuations might be equally important.
The key role of β as a driver of γ, evident from the direct positive effect of the relative importance of βA compared with α (βA/α) on γ (figure 3c), has also been recently reported for mainland birds [27] and trees ([41], but see [48]). The effect of β can be at least partially attributed to the additive partitioning [30,41]. However, because βA/α can vary independently from γ, their positive relationship therefore suggests biological mechanisms beyond the additive relationship. For example, such a relationship could be caused by dispersal limitation, niche specialization or competitive exclusion [24,27]. Moreover, adaptive radiations, taxon-cycle dynamics and island-hopping [3,5,6] are also important for species turnover [17], and our results suggest that they indirectly affect archipelagic γ-diversity.
5. Conclusion
A promising approach to analyse diversity patterns in archipelago-like systems is to partition overall species diversity into different α- and β-components and to test potential hypotheses about underlying processes in a common framework (figure 4). Our results from oceanic archipelagos indicate that γ is predominantly determined by indirect effects of abiotic factors via its α- and β-components, with β being more important for archipelagic γ-diversity than α. To understand archipelagic species diversity, it is therefore key to consider β, its components and their possible drivers. We show that β and its components on oceanic archipelagos are mostly affected by intra-archipelagic spatial variables, whereas α is most strongly related to climate and island biogeographic drivers. Hence, the consideration of such spatial factors is essential for assessing diversity components on island-like systems. Our framework derived here from empirical results for vascular plant diversity on oceanic archipelagos (figure 4) can be tested more widely for other taxa (e.g. insects, vertebrates) or other archipelago-like systems (e.g. alpine habitats, isolated deserts, freshwater lakes, coral reefs, seamounts).
Acknowledgements
We thank J. Grace for advice on implementing SEMs, H. Tuomisto for feedback on the nomenclature of β-diversity indices and J. Krobbach for help with digitizing species lists and assembling archipelago ages. We are grateful to Marcel Cardillo, Thomas O. Crist and one anonymous reviewer for constructive comments that helped to improve the manuscript. P.W. and H.K. conceived the idea; all authors designed the research; J.S.C. and P.W. collected data; J.S.C., P.W. and W.D.K. analysed data; all authors interpreted and discussed results; J.S.C. led the writing with substantial contributions from all authors.
Data accessibility
Biotic and abiotic data at the archipelagic level as well as their sources are given in the electronic supplementary material, appendix S1. Island-level species numbers and environmental information used to calculate archipelago-level diversity components and environmental predictors are stored at datadryad.org (Dryad: http://doi.org/10.5061/dryad.3jv54).
Funding statement
J.S.C. acknowledges financial support from a German Research Foundation (DFG) grant (SA-21331). P.W. and H.K. acknowledge funding from the DFG Free Floater Program in the Excellence Initiative at the University of Göttingen and H.K. also from the Academy of Sciences and Literature Mainz (‘Biodiversity in Change’ program). W.D.K. acknowledges a University of Amsterdam (UvA) starting grant.
References
- 1.MacArthur RH, Wilson EO. 1963. An equilibrium theory of insular zoogeography. Evolution 17, 373–387. [Google Scholar]
- 2.Whittaker RJ, Fernández-Palacios JM. 2007. Island biogeography: ecology, evolution, and conservation, 2nd edn Oxford, UK: Oxford University Press. [Google Scholar]
- 3.Losos JB, Ricklefs RE. 2009. Adaptation and diversification on islands. Nature 457, 830–836. ( 10.1038/nature07893) [DOI] [PubMed] [Google Scholar]
- 4.Mayr E. 1963. Animal species and evolution. Cambridge, MA: Harvard University Press. [Google Scholar]
- 5.Gillespie RG, Roderick GK. 2002. Arthropods on islands: colonization, speciation, and conservation. Annu. Rev. Entomol. 47, 595–632. ( 10.1146/annurev.ento.47.091201.145244) [DOI] [PubMed] [Google Scholar]
- 6.Kisel Y, Barraclough TG. 2010. Speciation has a spatial scale that depends on levels of gene flow. Am. Nat. 175, 316–334. ( 10.1086/650369) [DOI] [PubMed] [Google Scholar]
- 7.Grant PR. 1998. Evolution on islands. Oxford, UK: Oxford University Press. [Google Scholar]
- 8.Ricklefs RE, Bermingham E. 2002. The concept of the taxon cycle in biogeography. Glob. Ecol. Biogeogr. 11, 353–361. ( 10.1046/j.1466-822x.2002.00300.x) [DOI] [Google Scholar]
- 9.Kreft H, Jetz W, Mutke J, Kier G, Barthlott W. 2008. Global diversity of island floras from a macroecological perspective. Ecol. Lett. 11, 116–127. ( 10.1111/j.1461-0248.2007.01129.x) [DOI] [PubMed] [Google Scholar]
- 10.Lomolino MV, Brown JH, Sax DF. 2010. Island biogeography theory. In The theory of island biogeography revisited (eds Losos JB, Ricklefs RE.), pp. 13–51. Princeton, NJ: Princeton University Press. [Google Scholar]
- 11.Heaney LR. 2000. Dynamic disequilibrium: a long-term, large-scale perspective on the equilibrium model of island biogeography. Glob. Ecol. Biogeogr. 9, 59–74. ( 10.1046/j.1365-2699.2000.00163.x) [DOI] [Google Scholar]
- 12.Whittaker RJ, Triantis KA, Ladle RJ. 2008. A general dynamic theory of oceanic island biogeography. J. Biogeogr. 35, 977–994. ( 10.1111/j.1365-2699.2008.01892.x) [DOI] [Google Scholar]
- 13.Rosindell J, Harmon LJ. 2013. A unified model of species immigration, extinction and abundance on islands. J. Biogeogr. 40, 1107–1118. ( 10.1111/jbi.12064) [DOI] [Google Scholar]
- 14.Kadmon R, Allouche O. 2007. Integrating the effects of area, isolation, and habitat heterogeneity on species diversity: a unification of island biogeography and niche theory. Am. Nat. 170, 443–454. ( 10.1086/519853) [DOI] [PubMed] [Google Scholar]
- 15.Hortal J, Triantis KA, Meiri S, Thébault E, Sfenthourakis S. 2009. Island species richness increases with habitat diversity. Am. Nat. 174, E205–E217. ( 10.1086/645085) [DOI] [PubMed] [Google Scholar]
- 16.Emerson BC, Kolm N. 2005. Species diversity can drive speciation. Nature 434, 1015–1017. ( 10.1038/nature03450) [DOI] [PubMed] [Google Scholar]
- 17.Chiarucci A, Bacaro G, Arévalo JR, Delgado JD, Fernández-Palacios JM. 2010. Additive partitioning as a tool for investigating the flora diversity in oceanic archipelagos. Perspect. Plant Ecol. Evol. Syst. 12, 83–91. ( 10.1016/j.ppees.2010.01.001) [DOI] [Google Scholar]
- 18.Weigelt P, Kreft H. 2013. Quantifying island isolation: insights from global patterns of insular plant species richness. Ecography 36, 417–429. ( 10.1111/j.1600-0587.2012.07669.x) [DOI] [Google Scholar]
- 19.Weigelt P, Jetz W, Kreft H. 2013. Bioclimatic and physical characterization of the world's islands. Proc. Natl Acad. Sci. USA 110, 15 307–15 312. ( 10.1073/pnas.1306309110) [DOI] [PMC free article] [PubMed] [Google Scholar]
- 20.Baselga A. 2012. The relationship between species replacement, dissimilarity derived from nestedness, and nestedness. Glob. Ecol. Biogeogr. 21, 1223–1232. ( 10.1111/j.1466-8238.2011.00756.x) [DOI] [Google Scholar]
- 21.Crist TO, Veech JA. 2006. Additive partitioning of rarefaction curves and species-area relationships: unifying alpha-, beta- and gamma-diversity with sample size and habitat area. Ecol. Lett. 9, 923–932. ( 10.1111/j.1461-0248.2006.00941.x) [DOI] [PubMed] [Google Scholar]
- 22.Kallimanis AS, Mazaris AD, Tzanopoulos J, Halley JM, Pantis JD, Sgardelis SP. 2008. How does habitat diversity affect the species–area relationship? Glob. Ecol. Biogeogr. 17, 532–538. ( 10.1111/j.1466-8238.2008.00393.x) [DOI] [Google Scholar]
- 23.Freestone AL, Inouye BD. 2006. Dispersal limitation and environmental heterogeneity shape scale-dependent diversity patterns in plant communities. Ecology 87, 2425–2432. ( 10.1890/0012-9658(2006)87[2425:dlaehs]2.0.co;2) [DOI] [PubMed] [Google Scholar]
- 24.Veech JA, Crist TO. 2007. Habitat and climate heterogeneity maintain beta-diversity of birds among landscapes within ecoregions. Glob. Ecol. Biogeogr. 16, 650–656. ( 10.1111/j.1466-8238.2007.00315.x) [DOI] [Google Scholar]
- 25.Fahrig L. 2003. Effects of habitat fragmentation on biodiversity. Annu. Rev. Ecol. Evol. Syst. 34, 487–515. ( 10.2307/30033784) [DOI] [Google Scholar]
- 26.Diekötter T, Billeter R, Crist TO. 2008. Effects of landscape connectivity on the spatial distribution of insect diversity in agricultural mosaic landscapes. Basic Appl. Ecol. 9, 298–307. ( 10.1016/j.baae.2007.03.003) [DOI] [Google Scholar]
- 27.Stegen JC, et al. 2013. Stochastic and deterministic drivers of spatial and temporal turnover in breeding bird communities. Glob. Ecol. Biogeogr. 22, 202–212. ( 10.1111/j.1466-8238.2012.00780.x) [DOI] [Google Scholar]
- 28.Tuomisto H. 2010. A diversity of beta diversities: straightening up a concept gone awry. Part 1. Defining beta diversity as a function of alpha and gamma diversity. Ecography 33, 2–22. ( 10.1111/j.1600-0587.2009.05880.x) [DOI] [Google Scholar]
- 29.Baselga A. 2010. Multiplicative partition of true diversity yields independent alpha and beta components; additive partition does not. Ecology 91, 1974–1981. ( 10.1890/09-0320.1) [DOI] [PubMed] [Google Scholar]
- 30.Anderson MJ, et al. 2011. Navigating the multiple meanings of β diversity: a roadmap for the practicing ecologist. Ecol. Lett. 14, 19–28. ( 10.1111/j.1461-0248.2010.01552.x) [DOI] [PubMed] [Google Scholar]
- 31.Kreft H, Jetz W. 2007. Global patterns and determinants of vascular plant diversity. Proc. Natl Acad. Sci. USA 104, 5925–5930. ( 10.1073/pnas.0608361104) [DOI] [PMC free article] [PubMed] [Google Scholar]
- 32.Sandel B, Arge L, Dalsgaard B, Davies R, Gaston K, Sutherland W, Svenning JC. 2011. The influence of Late Quaternary climate-change velocity on species endemism. Science 334, 660–664. ( 10.1126/science.1210173). [DOI] [PubMed] [Google Scholar]
- 33.Pascual-Hortal L, Saura S. 2006. Comparison and development of new graph-based landscape connectivity indices: towards the priorization of habitat patches and corridors for conservation. Landsc. Ecol. 21, 959–967. ( 10.1007/s10980-006-0013-z) [DOI] [Google Scholar]
- 34.Burnham KP, Anderson DR. 2002. Model selection and multimodel inference: a practical information-theoretic approach, 2nd edn New York, NY: Springer. [Google Scholar]
- 35.Grace JB, Schoolmaster DR, Guntenspergen GR, Little AM, Mitchell BR, Miller KM, Schweiger EW. 2012. Guidelines for a graph-theoretic implementation of structural equation modeling. Ecosphere 3, art73 ( 10.1890/es12-00048.1) [DOI] [Google Scholar]
- 36.Kissling WD, Carl G. 2008. Spatial autocorrelation and the selection of simultaneous autoregressive models. Glob. Ecol. Biogeogr. 17, 59–71. ( 10.1111/j.1466-8238.2007.00334.x) [DOI] [Google Scholar]
- 37.Hillebrand H. 2004. On the generality of the latitudinal diversity gradient. Am. Nat. 163, 192–211. ( 10.1086/381004) [DOI] [PubMed] [Google Scholar]
- 38.Gillooly JF, Allen AP. 2007. Linking global patterns in biodiversity to evolutionary dynamics using metabolic theory. Ecology 88, 1890–1894. ( 10.1890/06-1935.1) [DOI] [PubMed] [Google Scholar]
- 39.Kissling WD, Baker WJ, Balslev H, Barfod AS, Borchsenius F, Dransfield J, Govaerts R, Svenning J-C. 2012. Quaternary and pre-Quaternary historical legacies in the global distribution of a major tropical plant lineage. Glob. Ecol. Biogeogr. 21, 909–921. ( 10.1111/j.1466-8238.2011.00728.x) [DOI] [Google Scholar]
- 40.Leibold MA, et al. 2004. The metacommunity concept: a framework for multi-scale community ecology. Ecol. Lett. 7, 601–613. ( 10.1111/j.1461-0248.2004.00608.x) [DOI] [Google Scholar]
- 41.Kraft NJB, et al. 2011. Disentangling the drivers of β diversity along latitudinal and elevational gradients. Science 333, 1755–1758. ( 10.1126/science.1208584) [DOI] [PubMed] [Google Scholar]
- 42.Patterson BD, Atmar W. 1986. Nested subsets and the structure of insular mammalian faunas and archipelagos. Biol. J. Linn. Soc. 28, 65–82. ( 10.1111/j.1095-8312.1986.tb01749.x) [DOI] [Google Scholar]
- 43.Mouquet N, Loreau M. 2003. Community patterns in source-sink metacommunities. Am. Nat. 162, 544–557. ( 10.1086/378857) [DOI] [PubMed] [Google Scholar]
- 44.Shaw JD, Spear D, Greve M, Chown SL. 2010. Taxonomic homogenization and differentiation across Southern Ocean islands differ among insects and vascular plants. J. Biogeogr. 37, 217–228. ( 10.1111/j.1365-2699.2009.02204.x) [DOI] [Google Scholar]
- 45.Brown JH, Gillooly JF, Allen AP, Savage VM, West GB. 2004. Toward a metabolic theory of ecology. Ecology 85, 1771–1789. ( 10.1890/03-9000) [DOI] [Google Scholar]
- 46.Rosindell J, Phillimore AB. 2011. A unified model of island biogeography sheds light on the zone of radiation. Ecol. Lett. 14, 552–560. ( 10.1111/j.1461-0248.2011.01617.x) [DOI] [PubMed] [Google Scholar]
- 47.Losos JB, Ricklefs RE. 2010. The theory of island biogeography revisited. Princeton, NJ: Princeton University Press. [Google Scholar]
- 48.Tuomisto H, Ruokolainen K. 2012. Comment on ‘disentangling the drivers of β diversity along latitudinal and elevational gradients’. Science 335, 1573 ( 10.1126/science.1216393) [DOI] [PubMed] [Google Scholar]
Associated Data
This section collects any data citations, data availability statements, or supplementary materials included in this article.
Data Availability Statement
Biotic and abiotic data at the archipelagic level as well as their sources are given in the electronic supplementary material, appendix S1. Island-level species numbers and environmental information used to calculate archipelago-level diversity components and environmental predictors are stored at datadryad.org (Dryad: http://doi.org/10.5061/dryad.3jv54).