Abstract
Eukaryotic mRNAs usually form a circular structure; thus, ribosomes that terminatae translation at the 3′ end can diffuse with increased probability to the 5′ end of the transcript, initiating another cycle of translation. This phenomenon describes ribosomal flow with positive feedback—an increase in the flow of ribosomes terminating translating the open reading frame increases the ribosomal initiation rate. The aim of this paper is to model and rigorously analyse translation with feedback. We suggest a modified version of the ribosome flow model, called the ribosome flow model with input and output. In this model, the input is the initiation rate and the output is the translation rate. We analyse this model after closing the loop with a positive linear feedback. We show that the closed-loop system admits a unique globally asymptotically stable equilibrium point. From a biophysical point of view, this means that there exists a unique steady state of ribosome distributions along the mRNA, and thus a unique steady-state translation rate. The solution from any initial distribution will converge to this steady state. The steady-state distribution demonstrates a decrease in ribosome density along the coding sequence. For the case of constant elongation rates, we obtain expressions relating the model parameters to the equilibrium point. These results may perhaps be used to re-engineer the biological system in order to obtain a desired translation rate.
Keywords: gene translation, ribosomal recycling, systems biology, monotone dynamical systems, cooperative systems, contraction theory
1. Introduction
Translation is one of the stages in the flow of gene expression, i.e. the process in which cells produce proteins based on the information encoded in the DNA and mRNA sequences. During translation, ribosomes ‘read’ the mRNA sequence and translate it into a corresponding amino acid chain. Translation occurs in all organisms, in almost all the cells, and under almost all conditions; thus, developing a better understanding of this complex process has numerous potential applications in medicine, biotechnology, systems biology, functional genomics and more.
The last few years have witnessed a surge of new empirical techniques for studying gene expression and specifically the translation mechanism. Ribosome profiling [1] provides a quantitative snapshot of the protein synthesis process by ribosomes, including precise measurements of ribosomal positions. Techniques for measuring absolute protein levels [2–6] and fractionation of mRNA–ribosome complexes (polysomes) allow the number of ribosomes on each mRNA to be estimated [1,7]. Other technological advances allow large-scale measurements of mRNA half-lives [8], protein half-lives [9], protein translation rates and mRNA transcription rates [10].
These methods produce vast amounts of data. While the amount of data increases at an exponential rate, the computational approaches for analysing these data seem to evolve at a slower pace. Mathematical and computational models of translation are becoming increasingly more important because of the need to better organize and understand these data.
A standard mathematical model for translation elongation is the totally asymmetric simple exclusion process (TASEP) [11]. TASEP was introduced by MacDonald et al. [12], and independently by Spitzer [13]. TASEP is a stochastic model for particle movement along some kind of ‘tracks’ or ‘trails’. A lattice of sites models the tracks, and particles hop, with some probability, from one site to a neighbouring one. An important property of this model is that hops may take place only to a target site that is not already occupied by another particle. Hence the term simple exclusion. The term totally asymmetric is used when the motion along the lattice is unidirectional.
TASEP models have been used to study a large number of biological systems, ranging from extracellular transport and gene transcription or translation to pedestrian dynamics [14]. Despite its rather simple description, it seems that rigorous analysis of the TASEP is non-trivial.
Reuveni et al. [15] recently introduced a deterministic model for translation called the ribosome flow model (RFM; figure 1). In the RFM, mRNA molecules are coarse-grained into a unidirectional chain of n sites of codons. The value of n may depend, for example, on geometrical properties of the ribosome. Ribosomes reach the first site with initiation rate λ > 0, but are only able to bind if this site is not already occupied by another ribosome. In practice, the initiation rate is a function of physical features such as the number of available free ribosomes, the folding energy of the 5′ untranslated regions (UTRs), the folding energy at the beginning of the coding sequence, the base pairing potential between the 5′ UTR and the ribosomal rRNA, and the context of the START ATG [15–19]. A ribosome that occupies site i moves, with transition rate λi > 0, to the consecutive site, if this site is not already occupied by another ribosome. Thus, the RFM captures both the simple exclusion and totally asymmetric properties of the TASEP. The transition rates λi depend on various features of the transcript [18] (see also the Methods section in [15]).
Figure 1.
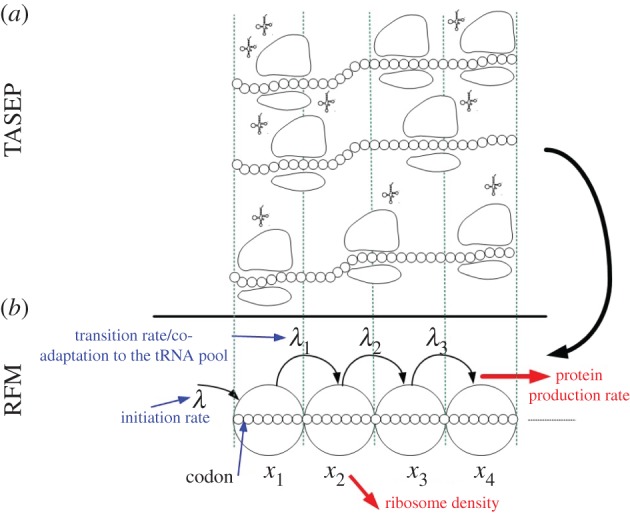
TASEP and the RFM. (a) The TASEP model—each codon has an exponentially distributed translation time; ribosomes have volume and can block each other. (b) The RFM is a coarse-grained mean field approximation of the TASEP. (Online version in colour.)
The simulations in the study of Reuveni et al. [15] show that, for suitable parameter values, TASEP and the RFM lead to similar predictions. For example, the correlation between their predictions over the set of endogenous genes of Saccharomyces cerevisiae is 0.96.
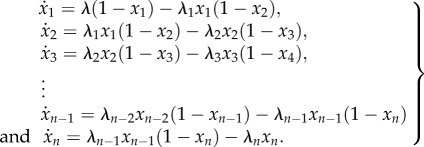
The RFM with n sites is given by
 |
1.1 |
Here,  describes how occupied site i is, where the value 1 [0] means that the site is completely occupied [completely free]. The rate of ribosome flow into [out of] the system is given by λ(1 − x1(t)) [λnxn(t)], whereas the rate of ribosome flow from site i to site i + 1 is given by λixi(t)(1 − xi
+
1(t)).
Since the state variables correspond to normalized occupation levels, we consider initial conditions x(0) in the closed unit cube
In the study of Margaliot & Tuller [20], we showed that there exists a unique equilibrium point  , where
is the interior of C, and that any solution of the RFM, with  , converges to e. The biophysical interpretation is that the parameters λ, λi uniquely determine a steady state of ribosome distributions (and thus translation rate), and that perturbations in this distribution will not change the asymptotic behaviour of the dynamics. In particular, this explains why the simulations of the RFM in Reuveni et al. [15] converged to the same final state regardless of the initial condition. Changing the values of the positive paraments λ, λi will not change this qualitative behaviour; however, it will change e, i.e. the distributions and the translation rates at the steady state.
Determining the relationship between the RFM parameters and e is an important and difficult problem. It has been shown [21] that in some cases the transition rate along genes is constant, so the translation efficiencies of all the codons are identical. This happens, for example, when the rate is limited by the concentration of elongation factors and not by the local features of the coding sequence, such as tRNA molecules or when there is a balance between the codon frequencies and tRNA levels [22]. Margaliot & Tuller [23] considered the RFM in the special case where
i.e. the transition rates λi are all equal, and λc denotes their common value. Since this homogeneous ribosome flow model (HRFM) includes only two parameters, λ and λc, the analysis is simplified. The results in Margaliot & Tuller [23] show that the dependence of e on the parameters may be separated into two different regimes. The transition between these two regimes takes place when
| 1.2 |
This is reminiscent of the phase transition that takes place in the TASEP [11]. For the HRFM, it is also possible to derive an explicit expression for e = (e1, … ,en)‘ at the limit of very high initiation rate, namely,
 |
1.3 |
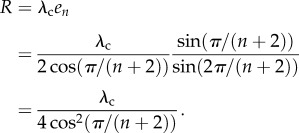
The steady-state translation rate when λ → ∞ is thus
 |
1.4 |
This implies that, when the initiation rate is very high, the translation rate in the HRFM depends on the coding sequence, i.e. the length n of the sequence and the translation rate λc, and that elongation becomes the rate-limiting step. Note that, as n goes to infinity, R in (1.4) goes to λc/4. One may define the capacity of a gene as its maximal translation rate. Thus, in the case of the HRFM, we have a closed-form formula for the capacity. These results may be applied when analysing translation rates in mouse embryonic stem cells, as in this case translation rates are usually constant [21].
In this paper, we consider for the first time the RFM as a control system, with the initiation rate as the input, and the translation rate R(t) = λnxn(t) as the output. We analyse the behaviour of the RFM after closing the loop from output to input with positive linear feedback. The motivation for this stems from the fact that in eukaryotic translation the poly(A)-binding protein binds both the poly(A) tail at the 3′ end of the transcript and eIF4G at the 5′ end of the transcript, promoting mRNA circularization. Thus, if the UTRs of the transcript are short enough, the ribosomes that terminate translation at the 3′ end can diffuse with increased probability to the 5′ end of the transcript, re-initiating another cycle of translation.
Our results show that several nice properties of the RFM and the HRFM hold also for the closed-loop system. In particular, there exists a unique globally asymptotically stable equilibrium point e. For the case of equal λis, we obtain closed-form expressions relating the closed-loop system parameters with e. Our results may be used to explain experimental data and, in the context of synthetic biology, to re-engineer the biological translation process in order to obtain a desired synthesis rate.
The remainder of this paper is organized as follows. In §2, we describe the ribosome flow model with input and output (RFMIO) with feedback as a model for the eukaryotic translation process. Section 3 states our main results. The proofs, given in §5, use some known tools that are reviewed in §4. The final section includes a comparison between our model and the TASEP, and describes some open questions for further study.
2. Ribosome flow model with input and output with feedback
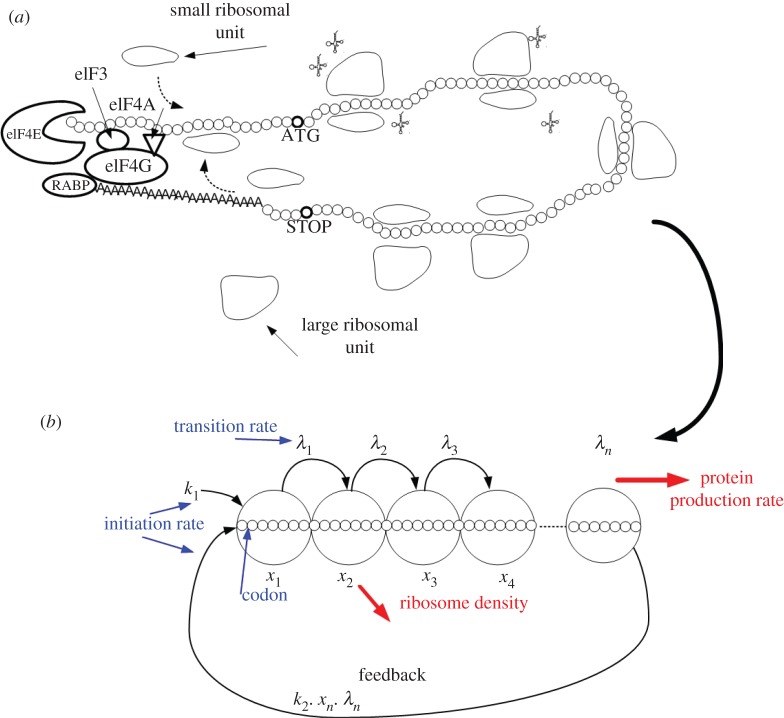
A typical eukaryotic mRNA includes, in addition to the open reading frame (ORF), also the 5′ and 3′ UTRs (figure 2) [24,25]; it also includes a cap structure (called RNA 7-methylguanosine cap, or m7G cap), which is a special tag added to the 5′ end of the mRNA; the cap is a terminal 7-methylguanosine residue that is linked to the first transcribed nucleotide. In addition, the mRNA includes the ORF (i.e. the codons that are translated to the protein), and the poly(A) tail at the 3′ end of the mRNA.
Figure 2.
The eukaryotic translation as an RFM model with feedback. (a) Illustration of the cap-dependent eukaryotic translation mechanism (explanation in the main text); for simplicity, other proteins, as well as a second eIF4A molecule known to interact with eIF4G, have been omitted. (b) The modelling of the cap-dependent eukaryotic translation mechanism by the RFMIO with feedback. (Online version in colour.)
In eukaryotes, mRNA molecules usually form circular structures; a simplified schematic of the closed-loop model of translation initiation appears in figure 2 [26,27]. In this structure, the eIF4F complex (which includes a few proteins, eIF4E complexed with eIF4G and eIF4A) interacts with both the 5′ end of the mRNA (via the protein eIF4E) and the poly(A) tail (via the poly(A) binding protein, PABP) and recruits the 40S ribosomal subunit (i.e. the small ribosomal unit) via its interaction with the protein eIF3. The small ribosomal subunit is part of the 43S pre-initiation complex (which includes the 40S ribosomal subunit loaded with the proteins eIF3, eIF1 and eIF1A, the initiator Met-tRNAiMet, eIF2 and GTP binds the eIF4F–mRNA complex) that usually scans along the mRNA molecule from the 5′ end of the 5′ UTR towards the beginning ORF until it reaches the start codon (usually an AUG triplet). Circularization is thought to promote cycling of the ribosomal subunits (figure 2), leading to time-efficient translation, and may also function to ensure that only intact mRNA molecules are translated (partially degraded mRNA characteristically has no m7G cap and no poly(A) tail) [28].
The poly(A) tail protects the mRNA molecule from enzymatic degradation in the cytoplasm and aids in: transcription termination, export of the mRNA from the nucleus, and translation [29]; thus, almost all eukaryotic mRNAs are polyadenylated [30] and transcripts lacking the poly(A) tail are expected to have improper regulation.
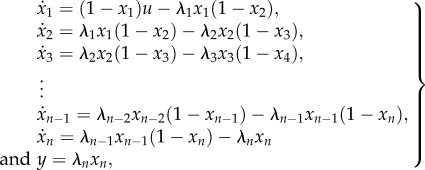
Summarizing, it is biologically reasonable to consider the translation initiation rate to be affected by the translation termination rate. Mathematically, this can be done as follows. Consider the RFMIO
 |
2.1 |
where  is a non-negative function of time, and then ‘close the loop’ by letting
| 2.2 |
Here, k1 represents diffusion of ribosomes to the 5′ UTRs that is not related to recycling of ribosomes. In practice, this parameter depends on biochemical features such as the number of available ribosomal subunits and mRNA molecules in the cell, and the properties of the 5′ UTR.
The term k2y(t) represents the recycling/reinitation of ribosomes that have already finished translating the mRNA (and is thus proportional to the output rate y(t)). The value of k2 depends on various biophysical properties of the mRNA sequence affecting the diffusion of ribosomes that terminated translation at the 3′ end back to the 5′ end.
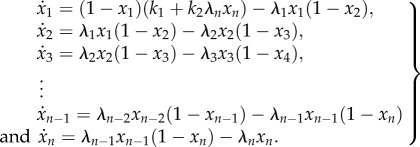
In this paper, we study the closed-loop system, obtained by combining (2.1) and (2.2), i.e.
 |
2.3 |
The next examples illustrate the dynamic behaviour of this closed-loop system. In order to allow the trajectories to be plotted, we consider examples with n = 3.
Example 2.1. —
Figure 3 depicts the trajectories of the closed-loop system (2.3), with n = 3, λ1 = λ2 = λ3 = 1, k1 = 1 and k2 = 100, for three initial conditions in C. It may be seen that all three trajectories converge to an equilibrium point
2.4 (all numerical values are to four-digit accuracy).
Example 2.2. —
Consider (2.3) with n = 3, λ1 = λ2 = λ3 = 1 and k1 = 0.01. The simulations indicate that the closed-loop system admits a unique globally attractive equilibrium point
for all k2 > 0. Figure 4 depicts e3 as a function of
. It may be seen that e3 increases with k2. For small values of k2, the increase rate is very low. The reason for this is that k1 is close to zero, and when k1 = k2 = 0 the closed-loop system admits an equilibrium point at 0. The slow increase corresponds to ‘escaping’ from this equilibrium point. For larger values of k2, the increase of e3 is more or less linear in k2, and then the graph ‘flattens’ and the limit
exists.
Figure 3.
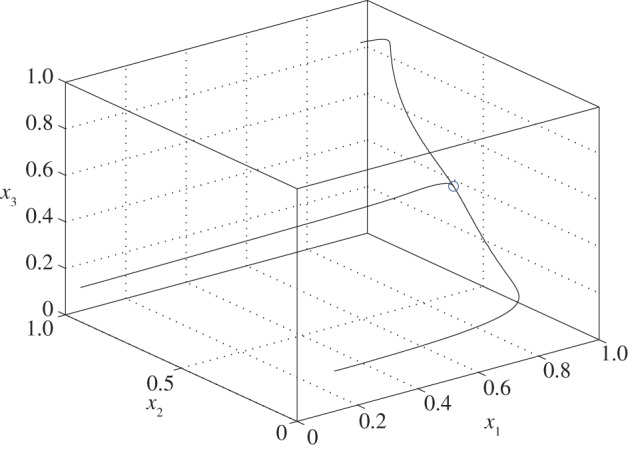
Trajectories of (2.3) with the parameter values given in example 2.1 for three initial conditions. All trajectories converge to the equilibrium point e in (2.4) (marked by a circle). (Online version in colour.)
Figure 4.
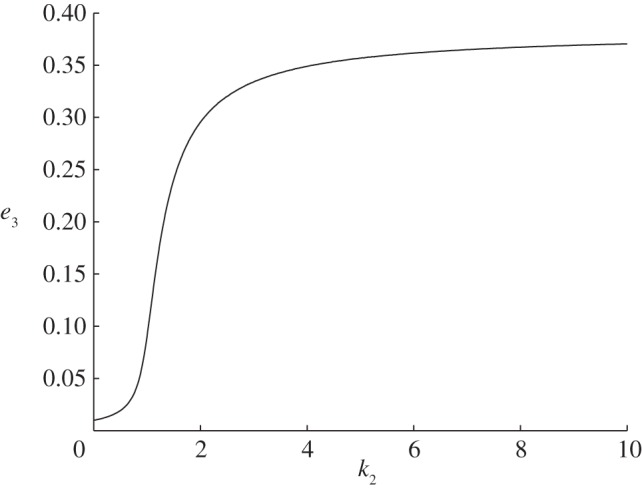
Coordinate e3 as a function of k2 in example 2.2.
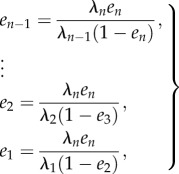
If  is an equilibrium of (2.3) then the right-hand side of every equation in (2.3) must be zero, so
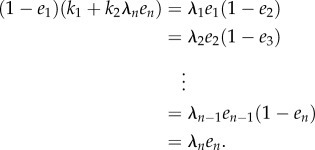 |
2.5 |
If en = 0, then this implies that ei = 0 for all i, and k1 = 0, which is a contradiction to our assumption that k1 > 0. Thus,  , and then
 |
2.6 |
and
| 2.7 |
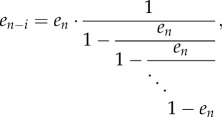
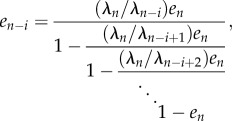
Note that (2.6) implies that
 |
and, more generally, for all i ≥ 1,
 |
2.8 |
where on the right-hand side the term en appears a total of i + 1 times. This implies in particular that en uniquely determines e.
It is important to note that the closed-loop system considered here is quite different from the RFM. Indeed, the RFM is an open-loop system with a constant initiation rate, whereas (2.3) includes a feedback connection from xn to x1. From a biological point of view, the closed-loop system is a more accurate description of translation in eukaryotes, as it includes recycling of ribosomal subunits that have not been analysed mathematically before. In fact, the closed-loop system is a generalization of the original RFM, as it includes both a term related to ribosomal recycling and a term related to ribosomal diffusion without recycling.
3. Main results
As will be shown in §5, the closed-loop system is a monotone dynamical system. Roughly speaking, bounded trajectories of such systems have a ‘simple’ behaviour: they almost always converge to an equilibrium point.
3.1. Bounded trajectories
The next result shows that C is an invariant set of the closed-loop dynamics so, in particular, trajectories that emanate from C remain bounded for all t ≥ 0. Let ∂C = C\Int(C), i.e. the boundary of C. We use x(t,a) to denote the solution of (2.3) at time t for the initial condition x(0) = a.
Proposition 3.1. —
For every
, the solution of the closed-loop system satisfies
for all t ≥ 0. Furthermore, for every
there exists a time ε > 0 such that
.
Section 3.2 shows that all these bounded trajectories converge to a unique equilibrium point.
3.2. Equilibrium point and stability
Theorem 3.2. —
The set C includes a unique equilibrium point e of the closed-loop system (2.3). This equilibrium point is globally asymptotically stable in C.
This implies that  , for all
  , so a simulation of the closed-loop system from any initial condition in C will converge to the same final state.
From a biophysical point of view, this means that the closed-loop system admits a unique steady state of ribosome distributions along the mRNA, and thus a unique steady-state translation rate. Perturbations in the distribution of ribosomes due, for example, to events that are assumed to be rare, such as ribosomal drop-off or internal initiation, will not change the asymptotic behaviour of the translation dynamics. It will still converge to the same distribution of ribosomes and the same translation rates.
When the gain k2 is sufficiently small, more can be said about what happens until convergence. Recall that the L1 norm of a vector  is
is  .
.
Theorem 3.3. —
Consider the closed-loop system (2.3). If
then
3.1 for all a,
.
In other words, the convergence is monotone in the sense that the (L1) distance between trajectories is always bounded by the distance between their initial conditions. Taking b = e in (3.1) yields
i.e. the convergence to e is monotone, as the distance to e can never increase.
Note that combining proposition 3.1 and theorem 3.2 implies that  , so
, so  for all i. We already saw that en determines e, i.e. that there exist functions gi : (0, 1) → (0, 1) such that
It is natural to consider the following question. Suppose that we fix the λis, and change the control parameters (k1, k2), thus changing en. How will this affect the other coordinates ei? The next result shows that if en increases [decreases] then every ei increases [decreases].
Proposition 3.4. —
The gis satisfy
for all i = 1, … , n − 1, and all
.
From a biophysical point of view, this implies that if a change in (k1, k2) yields an increase [decrease] in the translation rate, then it also yields an increase [decrease] in all the ribosome distributions along the mRNA.
For two vectors a,  , we write a ≤ b if ai ≤ bi for i = 1, … , n. We write a < b if a ≤ b and ai < bi for some i, and we write
  if ai < bi for i = 1, … , n.
The next result provides more information on the change in e induced by a change in the control parameters.
Proposition 3.5. —
Suppose that the λis are fixed and let (k1, k2) and
be two sets of feasible control parameters. Denote by e and
the corresponding equilibrium points. Let
3.2
If d > 0 then
 . If
d = 0 then
 . If
d < 0 then
 .
.
The case where we change only one control parameter follows immediately.
Corollary 3.6. —
Suppose that the λis are fixed. Let e and
correspond to the control parameters (k1, k2) and
, respectively. If
then
if and only if
. If
then
if and only if
.
From a biophysical point of view, this implies the intuitive result that increasing any one of the positive feedback parameters leads to an increase in the ribosome distribution along the mRNA and thus to an increase in the translation rate.
It is important to obtain more explicit information on the relationship between e and the system parameters. This seems to be a non-trivial problem. However, in the special case of the homogeneous ribosome flow model with input and output (HRFMIO) the analysis becomes simpler.
3.3. Homogeneous ribosome flow model with input and output with feedback
From here on, we assume that
| 3.3 |
with λc > 0. In this case, we refer to (2.3) as the HRFMIO with feedback.
The next result gives a closed-form expression for all the coordinates of e in terms of en.
Proposition 3.7. —
Suppose that (3.3) holds. Let
. If s < 1, let
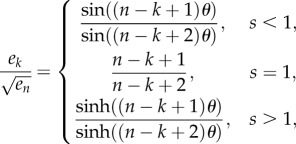
be such that cos(θ) = s. If s > 1, let θ > 0 be such that cosh(θ) = s. Then
3.4 for k = 1, 2, … , n − 1.
Example 3.8. —
Consider the closed-loop system in example 3.1, i.e. with n = 3, λc = 1, k1 = 1 and k2 = 100. In this case, the simulation results show that e is as given in (2.4). In particular, en = e3 = 0.3809, so
, and (3.4) yields
and
and this agrees with (2.4).
Since en determines all the coordinates of e (see (3.4)), it is enough to consider how en depends on the parameters λc, k1 and k2.
Theorem 3.9. —
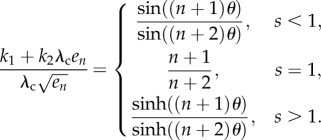
Suppose that (3.3) holds. Define s and θ as in proposition 3.7. Then
3.5
An important goal in synthetic biology and biotechnology is to artificially engineer and control the expression levels of various genes. Equation (3.5) connects the flow from the last site of the mRNA (i.e. the protein production rate) with k1, k2. Thus, it may be used for reprogramming the expression levels of genes. For example, modifying the properties or structure of the 5′ UTR may be used to change the value of k1, and thus change en (and consequently all the other eis) and the translation rate. The next example demonstrates this.
Example 3.10. —
Consider the HRFMIO with n = 3 and λc = 1. Suppose that we are interested in determining parameter values such that e3 = 1/4. This corresponds to s = 1, so (3.5) becomes
Thus, we can take, for example, k1 = 3/20 and k2 = 1; these parameters correspond to the features of the UTRs and can be manipulated relatively easily. Solving (2.6) for these parameter values yields e = [3/8, 1/3, 1/4]’, so e3 = 1/4, as required.
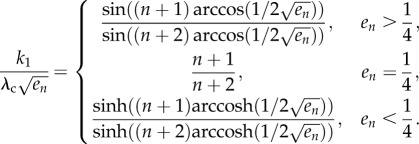
Equation (3.5) implies that the dependence of e on the parameters has two different forms. The transition between these forms takes place when s = 1, i.e. when en = 1/4, and then (3.5) yields
| 3.6 |
For example, if n = 3, λc = 1 and k1 = 0.01, this implies that, for k2 = 1.56, we have e3 = 1/4 (so the steady-state translation rate is R = λcen = 1/4). This agrees with figure 4.
When either k1 → ∞ or k2 → ∞, equation (3.5) implies that sin((n + 2)θ) must go to zero. Thus, θ → π/(n + 2), so the equation  yields
Note that this implies that en is a monotonically decreasing function of n. For example, for n = 3 this yields
 |
and this agrees with figure 4.
From a biophysical point of view, the cases k1 → ∞ or k2 → ∞ correspond to the situation where the effective initiation rate is very high because of either general diffusion of ribosomes to the 5′ UTR (large k1) or highly efficient recycling of ribosomes (large k2). In this case, the steady-state translation rate
 |
depends on the rate-limiting factor, which is the (uniform) elongation rate.
Remark 3.11. —
Note that (3.5) may be written as
3.7
This implies that, given a desired value en, any two control parameters (k1, k2) and  that satisfy the linear equation (3.7) lead to this same en, and thus to the same e. The next example demonstrates this.
Example 3.12. —
Suppose that n = 3, λc = 1, and that the desired value is e3 = 1/3. Then
, and (3.5) becomes
Figure 5 depicts the trajectories of the closed system for (k1, k2) = (2/3, 1) and for
for the same three initial conditions. It may be seen that the dynamics in these two cases is different (although similar), yet in both cases all the trajectories converge to the same equilibrium point, namely,
3.8
Remark 3.13. —
Consider the special case k2 = 0. In this case, u(t) ≡ k1, so the closed-loop system becomes the HRFM with initiation rate k1. Equation (3.5) becomes
3.9
Figure 5.
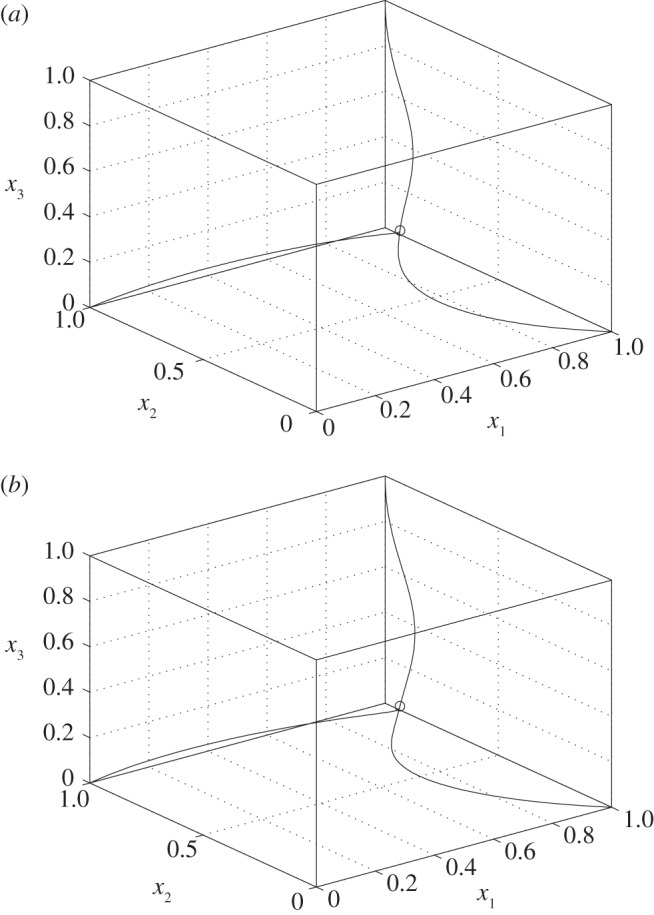
Trajectories of the closed-loop system with (a) (k1, k2) = (2/3, 1) and (b)  . The equilibrium point e in (3.8) is marked by a circle.
This provides a closed-form expression for the mapping from en to k1. The inverse of this mapping, i.e. the mapping from the initiation rate k1 to en, combined with (3.4), is the input-to-state characteristic [31] of the HRFM with input u and output y = λcen.
The next result shows that the steady-state distribution satisfies a kind of ‘traffic jam’ or ‘diffusion-like’ behaviour: as we move towards the end of the chain (i.e. from the 5′ end to the 3′ end of the ORF), the number of ribosomes decreases.
Proposition 3.14. —
Suppose that (3.3) holds. The equilibrium point
satisfies
3.10
One may think of ei as the steady-state ribosomal density at site i. A higher value of ei implies a higher chance that site i is occupied by a ribosome, and so higher values along some part of the chain corresponds to a ‘traffic jam’. The monotonic decrease of ei in (3.10) resembles the diffusion of particles (ribosomes in our case) from a region with higher particle density (5′ end of the ORF in our case) to a region with lower density (3′ end of the ORF in our case). These results seem to agree with experimental results for eukaryotes (i.e. usually containing mRNA circulation and thus feedback) showing that there is a decrease in ribosomal density from the 5′ end to the 3′ end of the ORF even when the elongation speed is constant [21]. It is interesting to note that even when the elongation speed is not constant there is an increase in ribosomal density at the beginning of genes [1] (see also [7,32]).
4. Preliminaries
In order to make this paper more self-contained, we briefly review some known results that will be used in the proofs of the main results.
4.1. Monotone dynamical systems
Let  be an open set. Consider a system of n ordinary first-order differential equations
| 4.1 |
where  is continuously differentiable. For t ≥ 0 and
  , let x(t, x0) denote the solution of (4.1) at time t for the initial condition x(0) = x0.1
Definition 4.1. —
The vector field
is said to satisfy the Kamke condition if, for any two vectors a,
satisfying a ≤ b and ai = bi,
The Kamke condition implies that the flow of (4.1) is monotone in the following sense.
Proposition 4.2. —
([33], ch. 3) Let <r denote any of the relations ≤, < or
. Suppose that the vector field f in (4.1) satisfies the Kamke condition. Then
implies that
In other words, the flow preserves the ordering of the initial conditions for all t ≥ 0.
Let  denote the Jacobian matrix of f, i.e. the matrix whose ijth entry is ∂fi/∂xj. If Ω is convex and
| 4.2 |
then the Kamke condition holds [33].
Note that (4.2) implies that a positive change in xj increases fi(x). Since  , this implies that different state variables augment the growth of each other. A system (4.1) that satisfies (4.2) is called a cooperative system. If a cooperative system satisfies ∂fi/∂xj = 0 for all |i − j| > 1, then the system is said to be a tridiagonal cooperative system [34]. If, furthermore, ∂fi/∂xj > 0 for |i − j| = 1, then the system is called a strongly cooperative tridiagonal system (SCTS). Smillie [34] has shown that any bounded trajectory of an SCTS must converge to an equilibrium point.
As noted in Margaliot & Tuller [20], the RFM (1.1) is an SCTS on the open unit cube Int(C). For example, since  , with f2(x) = λ1x1(1 − x2) − λ2x2(1 − x3), we have
  only for i = 1,2,3. Also, for every
  ,
,
and
However, the closed-loop system (2.3) considered in this paper is not tridiagonal, as f1(x) depends on xn.
4.2. Periodic continued fractions
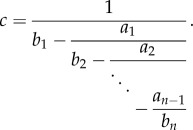
Consider the finite continued fraction
 |
4.3 |
If bi = b and ai = a for all i, then (4.3) is (a special case of) a finite periodic continued fraction [35]. In this case, there exists a closed-form expression for c in terms of Chebyshev polynomials of the second kind. These polynomials are defined by the recurrence relation ([36], ch. 1)
 |
4.4 |
Lemma 4.3. —
[37] Consider the continued fraction (4.3) with bi = 1 and ai = a for all i, where a > 0. Then
We list some properties of the Uis that will be used below. For more details and proofs, see Mason & Handscomb [36]. For  ,
,
| 4.5 |
where  is the angle such that cos(θ) = z. Similarly, for
  ,
,
| 4.6 |
where θ is such that cosh(θ) = z.
4.3. Contraction principle
We briefly review a contraction principle that will be used in the proof of theorem 3.3. For more details, see Vidyasagar ([38], ch. 3), Russo et al. [39] and Lohmiller & Slotine [40]. Let  be a vector norm. The induced matrix norm
  is
is
and the induced matrix measure
 is
is
Matrix measures have an important role in the stability analysis of dynamical systems. Indeed, consider the linear system  . Then, up to a first-order approximation
so |y(t + ε)| ≤ ||I + εA|||y(t)|, and
Hence,
where d+/dt denotes the right-hand derivative.
Recall that a set  is called an invariant set of the dynamical system
  if
if  implies that
  for all t ≥ 0. Intuitively, this means that, once a trajectory of the system enters K, it will never leave it.
Theorem 4.4 (Contraction principle) —
Consider the equation
4.7 with
continuously differentiable. Let
denote the Jacobian of f. Suppose that a convex set
is an invariant set for (4.7), and that there exists a vector norm
such that the induced matrix measure satisfies
Then for all
a,  and all
t ≥ 0,
For a self-contained proof of this result, see Russo et al. [39].
If r < 0 then the distance between the two trajectories x(t, a) and x(t, b) decays exponentially with t, the system is said to be contracting, and r is called the contraction rate.
From the point of view of mathematical analysis, the RFM has three important properties. It is a monotone dynamical system, it is almost a contractive system, i.e. it is contractive with zero contraction rate, and the equations describing e can be put in the form of a continued fraction (in the HRFM, a periodic continued fraction).
For our choice of input and output, the RFMIO is a monotone control system as defined by Angeli & Sontag [41]. There are several interesting results on the behaviour of monotone control systems with feedback [41–44]. An important tool in the analysis of such systems is a reduced-order system that depends on the input-state/output characteristic of the monotone control system. For the RFMIO, it seems that obtaining an explicit expression for this characteristic is non-trivial. Instead, our analysis relies on combining the theory of monotone systems (and not monotone control systems) with the special structure of the HRFM.
5. Proofs
An immediate yet important observation is that the closed-loop system (2.3) is a monotone dynamical system. Indeed, a calculation of the Jacobian J(x) of (2.3) appears below, where u = k1 + k2λnxn. It may be seen that all the non-diagonal elements are non-negative for all  , so the Kamke condition holds.
 |
Proof of proposition 3.1 —
Seeking a contradiction, assume that there exists a (first) time T > 0 such that

. Then
, i.e.
for at least one index k. This implies at least one of the following two cases.
Case 1. There exists a (minimal) index i such that
5.1 and xj(T) > 0 for all j < i. If i = 1 then
Since
for t < T, this implies that x1(T) > 0. We conclude that the case i = 1 is not possible, so i > 1. Now (2.3) yields
. Since xj(T) > 0 for all j < i, this implies that
, so xi(T) > 0. This contradicts (5.1), so we conclude that case 1 is not possible.
Case 2. There exists a (maximal) index i such that
and xj(T) < 1 for all j > i. If i = n, (2.3) yields

. Since
for t < T, this implies that xn(T) < 1. We conclude that the case i = n is not possible, so i < n. Using (2.3) again yields
. Since xj(T) < 1 for all j > i, this implies that
, so xi(T) < 1. We conclude that case 2 is also not possible. This contradiction implies that Int(C) is an invariant set of the RFM.
To complete the proof of the proposition, consider an initial condition
. Then
for at least one index k. This implies at least one of the following two cases.
Case 1. There exists a (minimal) index i such that ai = 0, and aj > 0 for j < i. We will show that
5.2 If i = 1, then (2.3) yields
, so (5.2) indeed holds. If i > 1, then
and since xi−1(0) = ai−1 > 0, this implies that
, so again (5.2) holds. It follows from the proof above that, for all j < i,
for all t ≥ 0. Thus,
for all
, and then
for all
and all t ≥ τ.
Case 2. There exists a (maximal) index i such that ai = 1 and aj < 1 for j > i. A similar argument shows that
for some τ > 0.
Inductively, this implies that there exists a time η > 0 such that
for all
and all t > η. This completes the proof of proposition 3.1. ▪
Proof of theorem 3.2 —
Since C is a convex and compact invariant set of the dynamics, it must include an equilibrium point. Assume that e,
are two different equilibrium points in C. Since en determines e (see (2.8)), this means that
, so we may assume that
5.3 Equation (2.6) yields
and proceeding in this fashion yields
, so (2.7) yields
Since k1 > 0 and k2 ≥ 0, this implies that
. This contradicts (5.3). We conclude that the equilibrium point in C is unique. For cooperative systems, the existence of an invariant set that contains a unique equilibrium implies that this equilibrium is globally asymptotically stable [45] (see also [46]), and this completes the proof.▪
Proof of theorem 3.3 —
Let
denote the matrix measure induced by the L1 norm. It is well known ([38], ch. 3) that
5.4 i.e. the maximum of the column sums, with non-diagonal elements taken in absolute values. Consider μ1(J(x)). For
, the off-diagonal elements of J(x) are non-negative, so we may ignore the absolute values in (5.4). Let si(x) denote the sum of the elements in column i of J(x). Then
and s2(x) = s3(x) = … = sn−1(x) = 0 for all x. For
, we have
for all
. Combining this with theorem 4.4 proves (3.1). ▪
Proof of proposition 3.4 —
The proof is by induction. First, it follows from (2.6) that gn−1(z) = λnz/(λn−1(1 − z)), so
Now suppose that ∂/(∂z)gn−i(z) > 0 for i = 1, … , k − 1. Using (2.6) yields
, so
Using the induction hypothesis and the fact that
completes the proof. ▪
Proof of proposition 3.5 —
Consider the case
. We already know that this happens if and only if
. In particular, if and only if
. By (2.7), this happens if and only if
i.e. if and only if d > 0. The proof in the cases
and
is similar. ▪
Proof of corollary 3.6 —
Consider first the case where
. Then (3.2) becomes
5.5 We consider three subcases.
Case 1. Suppose that d < 0. Then proposition 3.5 implies that
, so in particular
. Combining this with (5.5) yields
.
Case 2. Suppose that d = 0. Proposition 3.5 implies that
. Combining this with (5.5) yields
.
Case 3. Suppose that d > 0. Proposition 3.5 implies that
, and combining this with (5.5) yields
.
This completes the proof for the case
. The proof for the case
is similar.▪
Proof of proposition 3.7 —
Combining (3.3) and (2.6) yields
5.6 where the term en appears a total i + 1 times. The right-hand side of this equation is a periodic continued fraction, and, by lemma 4.3,
If en < 1/4, then
. Let θ be such that
. Using (4.6) yields
If en = 1/4, then
. It follows from (4.4) that Uk(1) = k + 1, so
If en > 1/4, then
. Letting
be the angle such that
, and using (4.5), yields
This completes the proof of (3.4).▪
Proof of theorem 3.9 —
Combining (2.6), (2.7) and (3.3) yields
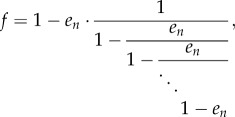
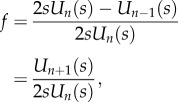
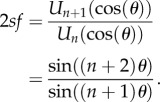
5.7 where f = λcen/(k1 + k2λcen), and on the right-hand side the term en appears a total of n times. Applying lemma 4.3 yields
where
). Thus,
where the last equation follows from (4.4). Suppose for the moment that
, and let
be the angle such that cos(θ) = s. Then (4.5) yields
This proves (3.5) when s < 1. The proof in the cases s = 1 and s > 1 is similar.▪
Proof of proposition 3.14 —
Since
, we have in particular en < 1. Combining this with (2.6) and (3.3) yields
5.8 Using (2.6) again yields
and (5.8) implies that en−2 > en−1. Proceeding in this fashion proves (3.10). ▪
6. Discussion
In this paper, we analysed for the first time the RFM with positive linear feedback. Our results show that several nice properties of the RFM/HRFM remain true for the closed-loop system. In particular, it admits a unique globally attractive equilibrium point e in C, and, in the case of equal translation rates, it is possible to derive expressions relating e to the model parameters.
Any good mathematical model must encapsulate the complexity of the real system, yet remain tractable. This is true for the RFMIO as well. However, even the particular case of the HRFMIO model is not sequence independent. For example, the value of the parameter λc depends on features of the coding sequence and their effect on translation elongation; genes with sequence features that promote a higher elongation rate (e.g. higher adaptation to the tRNA pool [47] and/or weaker folding of the mRNA sequence [18]) correspond to a higher value of λc. Similarly, the variables k1 and k2, related to the closed-loop initiation rate, depend among other on features of the 5′ UTR such as the Kozak sequence [17], the strength of the folding at the 5′ end of the ORF [47,48], and the length and nucleotide content of the ORF and UTRs [49]. Thus, the results reported in this study encapsulate a wide range of sequence features related to translation initiation and elongation efficiency.
As noted earlier, some of the model predictions can be compared with biological experiments; for example, the monotonic decrease of the ribosomal density (ei) along the coding sequence is in agreement with previously reported results [21,50]. It may be interesting to try and validate other predictions of the model. For example,
— The convergence rate of the translation process to steady state (see theorem 3.3) can be experimentally studied via real-time observation of translation of genes with high-enough mRNA half-lives [51].
— The relations between (k1, k2) and the ribosomal density and translation rate (see proposition 3.5 and corollary 3.6) can be validated experimentally by the synthesis and analysis of heterologous gene libraries based on the manipulations of the UTRs (which should affect these parameters) [3], but not the ORFs, and the measuring of the ribosomal density [1] and protein levels (for example, with green fluorescent protein [3]). Other formulae reported in this paper (see proposition 3.4 and theorem 3.9) can also be validated via the same procedure.
It is interesting to compare our results with those obtained for the TASEP model with feedback connections. Recall that the one-dimensional open-boundaries TASEP includes L sites numbered 1, … , L. The configuration of the particles is defined by n1, … , nL, where ni = 0 [ni = 1] indicates that site i is vacant [occupied by a particle]. The total number of particles on the lattice is  . The dynamics is random and sequential: at each time step a particle is chosen in random and moves to the consecutive site with unit rate, provided that this site is not occupied. Particles enter site 1 with rate α and exit from site L with rate β. At steady state, the average overall density
  is constant, and the system settles into one of three different phases:
— maximal current (MC), here α and β are large, and the internal hopping rate is the limiting factor;
— low density (LD), where the entry rate α is the limiting factor; and
— high density (HD), where the exit rate β is the limiting factor, resulting in a ‘traffic jam’ at the end of the lattice.
A summary of the behaviour of the model is given by
 |
6.1 |
The average current of particles in all these cases is J = ρ(1 − ρ), i.e. the product of the density ρ and the ‘hole density’ (1 − ρ). Note that these results are mean-field solutions, i.e. they are approximations that become exact when L → ∞.
The LD and HD regions coexist on the line α = β < 1/2. Domain wall theory [52] assumes that the system admits two regions separated by a zero-width wall. In other words, an LD ρ− = α on sites [1, k], and an HD ρ+ = 1 − β for sites [k + 1, L]. The well-defined boundary between these domains is called shock, and this scenario is known as a shock phase. Intuitively, this corresponds to a road with a high-speed, low-density region ending with a traffic jam.
Note that (3.5) suggests that the HRFMIO with feedback admits two different phases. The transition between these phases takes place when s = 1, i.e. when en = 1/4. For λc = 1, this corresponds to the steady-state translation rate R = λcen = 1/4. This is reminiscent of the phase transitions in the TASEP that take place along lines in the (α, β) plane corresponding to J = 1/4 (see (6.1)).
Ha & den Nijs [53] introduced the constrained TASEP to model the effects of finite resources. In their model particles enter the lattice from a finite pool. The pool models a parking garage, and the lattice models a closed road that starts and terminates at the garage. Let Np denote the number of particles in the pool. The total number of particles, Ntot = N + Np, is a fixed constant, and the effective entry rate, denoted αeff, depends on the size of the pool, i.e.
Thus, the total occupation on the lattice feeds back into its filling process. In the study of Ha & den Nijs [53], f(0) = 0 (a car cannot emerge from an empty garage) and f(k) = 1, for all k > 0.
Adams et al. [54] considered the constrained TASEP in the context of modelling translation, and thus suggested using a function f(x) that is linear in x for small x. Specifically, they used
| 6.2 |
where N* is the average number of particles in the standard TASEP. The main interest in these studies is to determine how N varies as Ntot is increased, while the exit rate remains fixed at β.
Note that these models correspond to negative feedback, as when the number of particles on the lattice N increases, Np = Ntot − N decreases, and thus the entry rate decreases.
A comparison between the constrained TASEP and the RFMIO with feedback is not straightforward. Indeed, a coherent theory of constrained TASEP is still a challenge, and also the physical point of view, which focuses on phase transitions, domain wall theory, etc., is different from the control-theoretic approach used here.
Two important differences are that in constrained TASEP the feedback is defined in a somewhat implicit way via f(Np). Indeed, the emphasis is on modelling finite resources, rather than the feedback itself. In the model studied here, u = k1 + k2y is an explicit function of the translation rate y. In most naturally expressed genes (i.e. endogenous genes), the number of mRNA molecules of each gene is relatively low (e.g. less than 1% of the total mRNA molecules in the cells). Therefore, the effect of the number of ribosomes on the mRNA related to one specific gene on the total ribosomal pool is negligible; thus, changes in the ribosomal densities and mRNA levels of one such gene are not expected to significantly affect the total ribosomal pool. (There is a rare exception; namely, highly expressed heterologous genes in which the mRNA molecules related to one gene may be a significant part of the total cellular mRNA levels [16].)
Also, analysis of the TASEP always provides approximate results (which become accurate as the number of sites goes to infinity) while the analysis of the deterministic RFMIO provides results that are valid for every n. Summarizing, we believe that the RFMIO is a more appropriate model than TASEP both for studying gene translation and for applications in synthetic biology.
Topics for further research include the following. The TASEP (or its variants) have been used to model not only protein synthesis, but several other real systems as well, including biomolecular motors [55,56], collective motion of ants [57], traffic flow [58–60] and surface growth [61]. In many of these systems, it is reasonable to consider feedback connections, so modelling such systems using the RFMIO with feedback may be of interest.
Several researchers studied the scenario in which several TASEP models compete for a joint pool of resources (see [19,62] and the references therein). This may model several translation processes taking part in parallel in a cell, while competing for the finite pool of ribosomal units. The competition effectively couples all the lattices and leads to interesting new phenomena. In particular, a phase transition in one lattice affects the others. It may be interesting to develop a similar model using a set of coupled RFMIOs (or HRFMIOs).
Finally, another study [63] has demonstrated selection for coding sequence features that optimize tRNA molecule recycling during translation elongation (e.g. pairs of consecutive codons of the same amino acid tend to be identical). Thus, from the functional genomic and evolutionary points of view, it may be interesting to study whether there is selection for transcript features that contribute to ribosomal recycling re-initiation. In addition, a study by Kondrashov et al. [64] has suggested a new layer of specificity in the control of gene expression and mammalian development that requires additional modelling and analysis.
Endnote
For the sake of simplicity, we assume from here on that a unique solution x(t,x0) exists for all t ≥ 0.
References
- 1.Ingolia NT, Ghaemmaghami S, Newman JR, Weissman JS. 2009. Genome-wide analysis in vivo of translation with nucleotide resolution using ribosome profiling. Science 324, 218–223 10.1126/science.1168978 (doi:10.1126/science.1168978) [DOI] [PMC free article] [PubMed] [Google Scholar]
- 2.Vogel C, et al. 2010. Sequence signatures and mRNA concentration can explain two-thirds of protein abundance variation in a human cell line. Mol. Syst. Biol. 6, 400. 10.1038/msb.2010.59 (doi:10.1038/msb.2010.59) [DOI] [PMC free article] [PubMed] [Google Scholar]
- 3.Kudla G, Murray AW, Tollervey D, Plotkin JB. 2009. Coding-sequence determinants of gene expression in Escherichia coli. Science 324, 255–258 10.1126/science.1170160 (doi:10.1126/science.1170160) [DOI] [PMC free article] [PubMed] [Google Scholar]
- 4.Ghaemmaghami S, Huh W, Bower K, Howson R, Belle A, Dephoure N, O'Shea E, Weissman J. 2003. Global analysis of protein expression in yeast. Nature 425, 737–741 10.1038/nature02046 (doi:10.1038/nature02046) [DOI] [PubMed] [Google Scholar]
- 5.Newman J, Ghaemmaghami S, Ihmels J, Breslow D, Noble M, DeRisi J, Weissman J. 2006. Single-cell proteomic analysis of S. cerevisiae reveals the architecture of biological noise. Nature 441, 840–846 10.1038/nature04785 (doi:10.1038/nature04785) [DOI] [PubMed] [Google Scholar]
- 6.Lu P, Vogel C, Wang R, Yao X, Marcotte E. 2007. Absolute protein expression profiling estimates the relative contributions of transcriptional and translational regulation. Nat. Biotechnol. 25, 117–124 10.1038/nbt1270 (doi:10.1038/nbt1270) [DOI] [PubMed] [Google Scholar]
- 7.Arava Y, Wang Y, Storey JD, Liu CL, Brown PO, Herschlag D. 2003. Genome-wide analysis of mRNA translation profiles in Saccharomyces cerevisiae. Proc. Natl Acad. Sci. USA 100, 3889–3894 10.1073/pnas.0635171100 (doi:10.1073/pnas.0635171100) [DOI] [PMC free article] [PubMed] [Google Scholar]
- 8.Shalem O, Dahan O, Levo M, Martinez M, Furman I, Segal E, Pilpel Y. 2008. Transient transcriptional responses to stress are generated by opposing effects of mRNA production and degradation. Mol. Syst. Biol. 4, 223. 10.1038/msb.2008.59 (doi:10.1038/msb.2008.59) [DOI] [PMC free article] [PubMed] [Google Scholar]
- 9.Belle A, Tanay A, Bitincka L, Shamir R, O'Shea E. 2006. Quantification of protein half-lives in the budding yeast proteome. Proc. Natl Acad. Sci. USA 103, 13 004–13 009 10.1073/pnas.0605420103 (doi:10.1073/pnas.0605420103) [DOI] [PMC free article] [PubMed] [Google Scholar]
- 10.Schwanhausser B, Busse D, Li N, Dittmar G, Schuchhardt J, Wolf J, Chen W, Selbach M. 2011. Global quantification of mammalian gene expression control. Nature 473, 337–342 10.1038/nature10098 (doi:10.1038/nature10098) [DOI] [PubMed] [Google Scholar]
- 11.Zia R, Dong J, Schmittmann B. 2011. Modeling translation in protein synthesis with TASEP: a tutorial and recent developments. J. Stat. Phys. 144, 405–428 10.1007/s10955-011-0183-1 (doi:10.1007/s10955-011-0183-1) [DOI] [Google Scholar]
- 12.MacDonald CT, Gibbs JH, Pipkin AC. 1968. Kinetics of biopolymerization on nucleic acid templates. Biopolymers 6, 1–25 10.1002/bip.1968.360060102 (doi:10.1002/bip.1968.360060102) [DOI] [PubMed] [Google Scholar]
- 13.Spitzer F. 1970. Interaction of Markov processes. Adv. Math. 5, 246–290 10.1016/0001-8708(70)90034-4 (doi:10.1016/0001-8708(70)90034-4) [DOI] [Google Scholar]
- 14.Chowdhury D, Schadschneider A, Nishinari K. 2005. Physics of transport and traffic phenomena in biology: from molecular motors and cells to organisms. Phys. Life Rev. 2, 318–352 10.1016/j.plrev.2005.09.001 (doi:10.1016/j.plrev.2005.09.001) [DOI] [Google Scholar]
- 15.Reuveni S, Meilijson I, Kupiec M, Ruppin E, Tuller T. 2011. Genome-scale analysis of translation elongation with a ribosome flow model. PLOS Comput. Biol. 7, e1002127. 10.1371/journal.pcbi.1002127 (doi:10.1371/journal.pcbi.1002127) [DOI] [PMC free article] [PubMed] [Google Scholar]
- 16.Plotkin JB, Kudla G. 2010. Synonymous but not the same: the causes and consequences of codon bias. Nat. Rev. Genet. 12, 32–42 10.1038/nrg2899 (doi:10.1038/nrg2899) [DOI] [PMC free article] [PubMed] [Google Scholar]
- 17.Kozak M. 1986. Point mutations define a sequence flanking the AUG initiator codon that modulates translation by eukaryotic ribosomes. Cell 44, 283–292 10.1016/0092-8674(86)90762-2 (doi:10.1016/0092-8674(86)90762-2) [DOI] [PubMed] [Google Scholar]
- 18.Tuller T, Veksler I, Gazit N, Kupiec M, Ruppin E, Ziv M. 2011. Composite effects of the coding sequences determinants on the speed and density of ribosomes. Genome Biol. 12, R110. 10.1186/gb-2011-12-11-r110 (doi:10.1186/gb-2011-12-11-r110) [DOI] [PMC free article] [PubMed] [Google Scholar]
- 19.Dana A, Tuller T. 2012. Efficient manipulations of synonymous mutations for controlling translation rate: an analytical approach. J. Comput. Biol. 19, 200–231 10.1089/cmb.2011.0275 (doi:10.1089/cmb.2011.0275) [DOI] [PubMed] [Google Scholar]
- 20.Margaliot M, Tuller T. 2012. Stability analysis of the ribosome flow model. IEEE/ACM Trans. Comput. Biol. Bioinform. 9, 1545–1552 10.1109/TCBB.2012.88 (doi:10.1109/TCBB.2012.88) [DOI] [PubMed] [Google Scholar]
- 21.Ingolia NT, Lareau L, Weissman J. 2011. Ribosome profiling of mouse embryonic stem cells reveals the complexity and dynamics of mammalian proteomes. Cell 147, 789–802 10.1016/j.cell.2011.10.002 (doi:10.1016/j.cell.2011.10.002) [DOI] [PMC free article] [PubMed] [Google Scholar]
- 22.Qian W, Yang J, Pearson N, Maclean C, Zhang J. 2012. Balanced codon usage optimizes eukaryotic translational efficiency. PLOS Genet. 8, e1002603. 10.1371/journal.pgen.1002603 (doi:10.1371/journal.pgen.1002603) [DOI] [PMC free article] [PubMed] [Google Scholar]
- 23.Margaliot M, Tuller T. 2012. On the steady-state distribution in the homogeneous ribosome flow model. IEEE/ACM Trans. Comput. Biol. Bioinform. 9, 1724–1736 10.1109/TCBB.2012.120 (doi:10.1109/TCBB.2012.120) [DOI] [PubMed] [Google Scholar]
- 24.Alberts B, Johnson A, Lewis J, Raff M, Roberts K, Walter P. 2002. Molecular biology of the cell. New York, NY: Garland Science [Google Scholar]
- 25.Lpez-Lastra M, Rivas A, Barra M. 2005. Protein synthesis in eukaryotes: the growing biological relevance of cap-independent translation initiation. Biol. Res. 38, 121–146 [DOI] [PubMed] [Google Scholar]
- 26.Craig A, Haghighat A, Yu A, Sonenberg N. 1998. Interaction of polyadenylate-binding protein with the eIF4G homologue PAIP enhances translation. Nature 392, 520–523 10.1038/33198 (doi:10.1038/33198) [DOI] [PubMed] [Google Scholar]
- 27.Tarun SZ, Sachs AB. 1997. Binding of eukaryotic translation initiation factor 4E (eIF4E) to eIF4G represses translation of uncapped mRNA. Mol. Cell. Biol. 17, 6876–6886 [DOI] [PMC free article] [PubMed] [Google Scholar]
- 28.Howard G, Adamson S, Herbert E. 1970. Subunit recycling during translation in a reticulocyte cell-free system. J. Biol. Chem. 245, 6237–6239 [PubMed] [Google Scholar]
- 29.Guhaniyogi J, Brewer G. 2001. Regulation of mRNA stability in mammalian cells. Gene 265, 11–23 10.1016/S0378-1119(01)00350-X (doi:10.1016/S0378-1119(01)00350-X) [DOI] [PubMed] [Google Scholar]
- 30.Hunt A, et al. 2008. Arabidopsis mRNA polyadenylation machinery: comprehensive analysis of protein–protein interactions and gene expression profiling. BMC Genomics 9, 220. 10.1186/1471-2164-9-220 (doi:10.1186/1471-2164-9-220) [DOI] [PMC free article] [PubMed] [Google Scholar]
- 31.Angeli D, Sontag E. 2004. Interconnections of monotone systems with steady-state characteristics. In Optimal control, stabilization and nonsmooth analysis, vol. 301 (eds de Queiroz MS, Malisoff MA, Wolenski PR.), pp. 135–154 Lecture Notes in Control and Information Science Berlin, Germany: Springer [Google Scholar]
- 32.Ciandrini L, Stansfield I, Romano M. 2013. Ribosome traffic on mRNAs maps to gene ontology: genome-wide quantification of translation initiation rates and polysome size regulation. PLOS Comput. Biol. 9, e1002866. 10.1371/journal.pcbi.1002866 (doi:10.1371/journal.pcbi.1002866) [DOI] [PMC free article] [PubMed] [Google Scholar]
- 33.Smith HL. 1995. Monotone dynamical systems: an introduction to the theory of competitive and cooperative systems, p. 41 Mathematical Surveys and Monographs Providence, RI: American Mathematical Society. [Google Scholar]
- 34.Smillie J. 1984. Competitive and cooperative tridiagonal systems of differential equations. SIAM J. Math. Anal. 15, 530–534 10.1137/0515040 (doi:10.1137/0515040) [DOI] [Google Scholar]
- 35.Rosen KH. 2000. Elementary number theory and its applications, 4th edn Reading, MA: Addison-Wesley [Google Scholar]
- 36.Mason JC, Handscomb DC. 2003. Chebyshev polynomials. London, UK: Chapman & Hall [Google Scholar]
- 37.Mansour T, Vainshtein A. 2000. Restricted permutations, continued fractions, and Chebyshev polynomials. Electron. Comb. J. 7, R17 [Google Scholar]
- 38.Vidyasagar M. 1978. Nonlinear systems analysis. Englewood Cliffs, NJ: Prentice Hall [Google Scholar]
- 39.Russo G, di Bernardo M, Sontag ED. 2010. Global entrainment of transcriptional systems to periodic inputs. PLOS Comput. Biol. 6, e1000739. 10.1371/journal.pcbi.1000739 (doi:10.1371/journal.pcbi.1000739) [DOI] [PMC free article] [PubMed] [Google Scholar]
- 40.Lohmiller W, Slotine J-JE. 1998. On contraction analysis for nonlinear systems. Automatica 34, 683–696 10.1016/S0005-1098(98)00019-3 (doi:10.1016/S0005-1098(98)00019-3) [DOI] [Google Scholar]
- 41.Angeli D, Sontag ED. 2003. Monotone control systems. IEEE Trans. Automat. Control 48, 1684–1698 10.1109/TAC.2003.817920 (doi:10.1109/TAC.2003.817920) [DOI] [Google Scholar]
- 42.Enciso G, Sontag ED. 2005. Monotone systems under positive feedback: multistability and a reduction theorem. Syst. Control Lett. 54, 159–168 10.1016/j.sysconle.2004.08.003 (doi:10.1016/j.sysconle.2004.08.003) [DOI] [Google Scholar]
- 43.Angeli D, Sontag ED. 2008. Oscillations in I/O monotone systems under negative feedback. IEEE Trans. Automat. Control 53, 166–176 10.1109/TAC.2007.911320 (doi:10.1109/TAC.2007.911320) [DOI] [Google Scholar]
- 44.Wang L, de Leenheer P, Sontag ED. 2010. Conditions for global stability of monotone tridiagonal systems with negative feedback. Syst. Control Lett. 59, 130–138 10.1016/j.sysconle.2009.12.008 (doi:10.1016/j.sysconle.2009.12.008) [DOI] [PMC free article] [PubMed] [Google Scholar]
- 45.Ji-Fa J. 1994. On the global stability of cooperative systems. Bull. Lond. Math. Soc. 26, 455–458 10.1112/blms/26.5.455 (doi:10.1112/blms/26.5.455) [DOI] [Google Scholar]
- 46.Leenheer PD, Angeli D, Sontag ED. 2007. Monotone chemical reaction networks. J. Math. Chem. 41, 295–314 10.1007/s10910-006-9075-z (doi:10.1007/s10910-006-9075-z) [DOI] [Google Scholar]
- 47.Tuller T, Waldman YY, Kupiec M, Ruppin E. 2010. Translation efficiency is determined by both codon bias and folding energy. Proc. Natl Acad. Sci. USA 107, 3645–3650 10.1073/pnas.0909910107 (doi:10.1073/pnas.0909910107) [DOI] [PMC free article] [PubMed] [Google Scholar]
- 48.Gu W, Zhou T, Wilke CO. 2010. A universal trend of reduced mRNA stability near the translation–initiation site in prokaryotes and eukaryotes. PLOS Comput. Biol. 6, e1000664. 10.1371/journal.pcbi.1000664 (doi:10.1371/journal.pcbi.1000664) [DOI] [PMC free article] [PubMed] [Google Scholar]
- 49.Ledda M, Croce MD, Bedini B, Wannenes F, Corvaro M, Boyl PP, Caldarola S, Loreni F, Amaldi F. 2005. Effect of 3′UTR length on the translational regulation of 5′-terminal oligopyrimidine mRNAs. Gene 344, 213–220 10.1016/j.gene.2004.09.023 (doi:10.1016/j.gene.2004.09.023) [DOI] [PubMed] [Google Scholar]
- 50.Dana A, Tuller T. 2012. Determinants of translation elongation speed and ribosomal profiling biases in mouse embryonic stem cells. PLOS Comput. Biol. 8, e1002755. 10.1371/journal.pcbi.1002755 (doi:10.1371/journal.pcbi.1002755) [DOI] [PMC free article] [PubMed] [Google Scholar]
- 51.Uemura S, Aitken C, Korlach J, Flusberg B, Turner S, Puglisi J. 2010. Real-time tRNA transit on single translating ribosomes at codon resolution. Nature 464, 1012–1017 10.1038/nature08925 (doi:10.1038/nature08925) [DOI] [PMC free article] [PubMed] [Google Scholar]
- 52.Santen L, Appert C. 2002. The asymmetric exclusion process revisited: fluctuations and dynamics in the domain wall picture. J. Stat. Phys. 106, 187–199 10.1023/A:1013176229983 (doi:10.1023/A:1013176229983) [DOI] [Google Scholar]
- 53.Ha M, den Nijs M. 2002. Macroscopic car condensation in a parking garage. Phys. Rev. E 66, 036118. 10.1103/PhysRevE.66.036118 (doi:10.1103/PhysRevE.66.036118) [DOI] [PubMed] [Google Scholar]
- 54.Adams DA, Schmittmann B, Zia RKP. 2008. Far-from-equilibrium transport with constrained resources. J. Stat. Mech. 2008, P06009. 10.1088/1742-5468/2008/06/P06009 (doi:10.1088/1742-5468/2008/06/P06009) [DOI] [Google Scholar]
- 55.Berger F, Keller C, Klumpp S, Lipowsky R. 2012. Distinct transport regimes for two elastically coupled molecular motors. Phys. Rev. Lett. 20, 208 101–208 105 10.1103/PhysRevLett.108.208101 (doi:10.1103/PhysRevLett.108.208101) [DOI] [PubMed] [Google Scholar]
- 56.Klumpp S, Lipowsky R. 2003. Traffic of molecular motors through tube-like compartments. J. Stat. Phys. 113, 233–268 10.1023/A:1025778922620 (doi:10.1023/A:1025778922620) [DOI] [Google Scholar]
- 57.John A, Schadschneider A, Chowdhury D, Nishinari K. 2009. Traffic-like collective movement of ants on trails: absence of a jammed phase. Phys. Rev. Lett. 102, 108001. 10.1103/PhysRevLett.102.108001 (doi:10.1103/PhysRevLett.102.108001) [DOI] [PubMed] [Google Scholar]
- 58.Chowdhury D, Santen L, Schadschneider A. 1999. Vehicular traffic: a system of interacting particles driven far from equilibrium. Curr. Sci. 77, 411–419 [Google Scholar]
- 59.Popkov V, Santen L, Schadschneider A, Schutz GM. 2001. Empirical evidence for a boundary-induced nonequilibrium phase transition. J. Phys. A Math. Gen. 34, L45. 10.1088/0305-4470/34/6/103 (doi:10.1088/0305-4470/34/6/103) [DOI] [Google Scholar]
- 60.Chai Y, Klumpp S, Muller MJI, Lipowsky R. 2009. Traffic by multiple species of molecular motors. Phys. Rev. E 80, 041928. 10.1103/PhysRevE.80.041928 (doi:10.1103/PhysRevE.80.041928) [DOI] [PubMed] [Google Scholar]
- 61.Ferrari PL, Frings R. 2011. Finite time corrections in KPZ growth models. J. Stat. Phys. 144, 1123–1150 10.1007/s10955-011-0318-4 (doi:10.1007/s10955-011-0318-4) [DOI] [Google Scholar]
- 62.Greulich P, Ciandrini L, Allen RJ, Romano MC. 2012. Mixed population of competing totally asymmetric simple exclusion processes with a shared reservoir of particles. Phys. Rev. E 85, 011142. 10.1103/PhysRevE.85.011142 (doi:10.1103/PhysRevE.85.011142) [DOI] [PMC free article] [PubMed] [Google Scholar]
- 63.Cannarozzi G, Schraudolph NN, Faty M, von Rohr P, Friberg MT, Roth AC, Gonnet P, Gonnet G, Barral Y. 2010. A role for codon order in translation dynamics. Cell 141, 355–367 10.1016/j.cell.2010.02.036 (doi:10.1016/j.cell.2010.02.036) [DOI] [PubMed] [Google Scholar]
- 64.Kondrashov N, Pusic A, Stumpf C, Shimizu K, Hsieh A, Xue S, Ishijima J, Shiroishi T, Barna M. 2011. Ribosome-mediated specificity in Hox mRNA translation and vertebrate tissue patterning. Cell 145, 383–397 10.1016/j.cell.2011.03.028 (doi:10.1016/j.cell.2011.03.028) [DOI] [PMC free article] [PubMed] [Google Scholar]


