Summary
This manuscript suggests TR4 is a tumor suppressor of prostate tumorigenesis via regulating ATM expression at the transcriptional level.
Abstract
Testicular nuclear receptor 4 (TR4), a member of the nuclear receptor superfamily, plays important roles in metabolism, fertility and aging. The linkage of TR4 functions in cancer progression, however, remains unclear. Using three different mouse models, we found TR4 could prevent or delay prostate cancer (PCa)/prostatic intraepithelial neoplasia development. Knocking down TR4 in human RWPE1 and mouse mPrE normal prostate cells promoted tumorigenesis under carcinogen challenge, suggesting TR4 may play a suppressor role in PCa initiation. Mechanism dissection in both in vitro cell lines and in vivo mice studies found that knocking down TR4 led to increased DNA damage with altered DNA repair system that involved the modulation of ATM expression at the transcriptional level, and addition of ATM partially interrupted the TR4 small interfering RNA-induced tumorigenesis in cell transformation assays. Immunohistochemical staining in human PCa tissue microarrays revealed ATM expression is highly correlated with TR4 expression. Together, these results suggest TR4 may function as a tumor suppressor to prevent or delay prostate tumorigenesis via regulating ATM expression at the transcriptional level.
Introduction
Prostate cancer (PCa) is one of the most common cancers in the USA, the highest in incidence and second highest in mortality in men (1). It starts with prostate luminal epithelial cells malignant transformation into small clumps of tumor cells confined in normal prostate glands, named prostatic intraepithelial neoplasia (PIN). Over time these cells with PIN then spread to the stromal compartment forming a prostate tumor, and then gradually invade into blood vessels and metastasized into bones or other organs. The etiology of PCa is complicated with factors including genetic background (2), inherited factors (3), specific genes (4), diet (5) and vitamins (6), which might all be able to contribute to PCa development. However, the molecular mechanisms involved in PCa development remain unclear.
Testicular nuclear receptor 4 (TR4) belongs to the nuclear receptor superfamily and was first cloned from human and rat in 1994 (7). TR4 is ubiquitously expressed in all tissues (49 mouse messenger RNAs in 39 tissues) examined (8). The TR4 knockout (TR4− /−) mouse was first generated in 2004 by using traditional homologous recombination strategy to delete the TR4 gene (9). The phenotypes of TR4− /− mouse include growth retardation, defects in reproduction and maternal behavior in female, disturbed development of cerebellum, impaired oligodendrocytes and reduced myelination, delayed spermatogenesis and reduced sperm count (9–12).
Here, we found the loss of TR4 in three different mouse models all led to increased PIN and/or prostatic carcinoma formation. Molecular mechanism dissections suggested TR4 might function as a tumor suppressor via alteration of the signals involved in the DNA damage and DNA repair.
Materials and methods
Mouse breeding
All animal procedures were approved by the Animal Care and Use Committee of the University of Rochester. TR4 heterozygous (TR4+/−) mice were made by Lexicon Genetics (9). TR4 knockout (TR4− /−) mice were generated by mating male and female TR4+/− mice. PTEN heterozygous (PTEN+/−) mice were purchased from National Cancer Institute. The TRAMP mice were purchased from Jackson Laboratory. PTEN+/−-TR4+/− mice were generated by mating male PTEN+/− mice with female TR4+/− mice. TRAMP TR4+/− mice were generated by mating male TR4+/− mice with female TRAMP mice. The background of all mice used was C57BL/6J (B6).
Immunohistochemical staining
Human or mouse tissues were collected and fixed with 10% formalin followed by paraffin embedding. Samples were sliced to 5 μm thickness. We used the primary antibodies of anti-TR4 (Perseus Proteomics), anti-ATM (Santa Cruz), anti-γH2AX (Millipore) and anti-phospho-ATM serine 1981 (Millipore). The primary antibody was recognized by the biotinylated secondary antibody and visualized by Vectastain ABC peroxidase system and peroxidase substrate DAB kit (Vector Laboratories). The positive staining signals in mouse tissues were quantitated by Image J software.
Cell culture
RWPE1 cell line was obtained from the American Type Culture collection (ATCC, Rockwell, MD) and maintained in complete keratinocyte serum-free medium, supplemented with 1% penicillin/streptomycin, 50 mg/ml bovine pituitary extract and 5ng/ml epidermal growth factor (Life Technologies, Barcelona, Spain). The spontaneously immortalized mouse prostatic epithelial cell line, mPrE, was a generous gift from Dr M.Jiang (13) and maintained in RPMI 1640 medium (GIBCO) supplemented with 10% fetal bovine serum and 1% Antibiotic-Antimycotic solution (Invitrogen). Stable cell lines expressing scramble small interfering RNA (scr) or small interfering RNA (CGGGAGAAACCAAGCAATT) against TR4 (siTR4) were established by transfecting pCDNA6/TR and pSuperior.retro.puro plasmids into RWPE1 or mPrE cells and selected for stable cell lines by treatment with blasticidin (12 μg/ml) and puromycin (1.2 μg/ml) for 2 weeks. Tetracycline (1 μg/ml) was added in order to induce siRNA expression. Primary cultures of mouse embryonic fibroblasts (MEFs) were prepared from embryos at embryonic day 14.5 with TR4+/+ or TR4− /− genotypes and maintained in RPMI 1640 medium (GIBCO) supplemented with 10% fetal bovine serum.
RNA extraction and quantitative PCR
RNA was extracted from cell lines using TRIzol® reagent (Invitrogen) and converted to complementary DNA by Superscript III transcriptase (Invitrogen). Quantitative PCR was performed using Bio-Rad CFX96 system with SYBR green (Bio-Rad) to determine the level of messenger RNA expression of a gene of interest. Expression levels were normalized to the expression of β-actin RNA.
Cell proliferation assay
Cells were subcultured to 10% confluence then treated with 100 μM N-methyl-N-nitrosourea (MNU) or vehicle control dimethyl sulfoxide for 2 h. Then the cells were grown to reach 100% confluence. Repeat the procedure of MNU treatment for total three cycles. After three cycles, then we passaged the cells five more times. The treated RWPE1 and mPrE cells were seeded in 24-well plates (3000 cells/well) and cultured for 24, 48, 72 or 96h. After each time point, cell numbers were calculated by staining with 3-(4,5-dimethylthiazole-2-yl)-2,5-diphenyl tetrazolium bromide agent.
Cell transformation/colony-forming assay
Cells were treated with 100 μM MNU or vehicle control dimethyl sulfoxide for 3 cycles (RWPE1) or 30 cycles (mPrE) followed by five passages. Cells were suspended at a density of 2 × 10⁵ cells/ml in 0.4% Noble agar (Sigma, St Louis, MO) containing media and seeded on top of 0.8% agarose containing media in culture plates. Additional media (1–2 ml) on the top of the plates were changed. Colonies were stained with p-iodonitrotetrazolium violet (Sigma), photographed and counted.
Cell immunofluorescence staining
105 cells were seeded in 4-well chamber slides. After 24 h, cells were fixed with acetone for 5 min. After 30 min blocking, 2 μg/ml of primary antibodies anti-ATM and anti-γH2AX were added to the slides overnight in 4°C. Fluorescence-conjugated secondary antibodies were then added at 1:500 dilution. Cells were then mounted with mounting solution containing 4′,6-diamidino-2-phenylindole nucleus staining and pictures were taken with fluorescence microscopy.
Pathway-focused microarray
Primary cultured MEFs from TR4+/+ and TR4− /− mice with C57BL/6J (B6) background were prepared. DNA damages were induced by 250 μM H2O2 treatment for 2 h. The media were then changed to fresh normal media. The RNA was harvested 24 h after H2O2 challenge. Mouse DNA Damage Signaling RT2 Profiler™ PCR Array (SuperArray) was performed. Data was analyzed by RT2 Profiler™ PCR Array Data Analysis.
Luciferase reporter assay
ATM promoter (-1)-(-827) was cloned to pGL3 luciferase plasmid. Cells were cotransfected with pGL3-ATM promoter with pRL-tk as an internal control. Cells were lysed and detected for firefly luciferase activity by adding substrate LAR II. The internal renilla luciferase control was detected by adding Stop & Glo reagent (Promega).
Chromatin immunoprecipitation assay
Chromatin immunoprecipitation assay was performed using anti-TR4 (Perseus Proteomics) antibody by Millipore EZ-ChIP™ kit and followed the manufacturer’s protocol.
Human PCa tissue microarray and immunohistochemistry scoring
We retrieved 73 PCa and 75 adjacent benign prostate specimens from patients undergoing radical prostatectomy performed at the University of Rochester Medical Center. Appropriate approval from the Institutional Review Board at our institution was obtained prior to construction and use of the tissue microarray (TMA). The mean age of the patients at presentation was 60.2 years. None of the patients had received therapy with hormonal reagents, radiation or other anticancer drugs preoperatively.
Immunohistochemical (IHC) staining was performed as described previously. All these stains were manually scored by one pathologist (H.M.) who was blinded to patient identity. German immunoreactive score was calculated by multiplying the percentage of immunoreactive cells (0% = 0; 1–10% = 1; 11–50% = 2; 51–80% = 3; 81–100% = 4) by staining intensity (negative = 0; weak = 1; moderate = 2; strong = 3). Cores with the immunoreactive score of 0 or 1 were considered negative (0), and those with the immunoreactive scores of 2–4, 6–8 and 9–12 were considered weakly positive (1+), moderately positive (2+) and strongly positive (3+), respectively.
Statistics
The data values were presented as the mean ± standard error of the mean. P values were calculated by unpaired Student’s t-test or Fisher’s exact test. P < 0.05 was considered statistically significant.
Results
TR4 suppresses PIN lesions and PCa development in three different mouse models
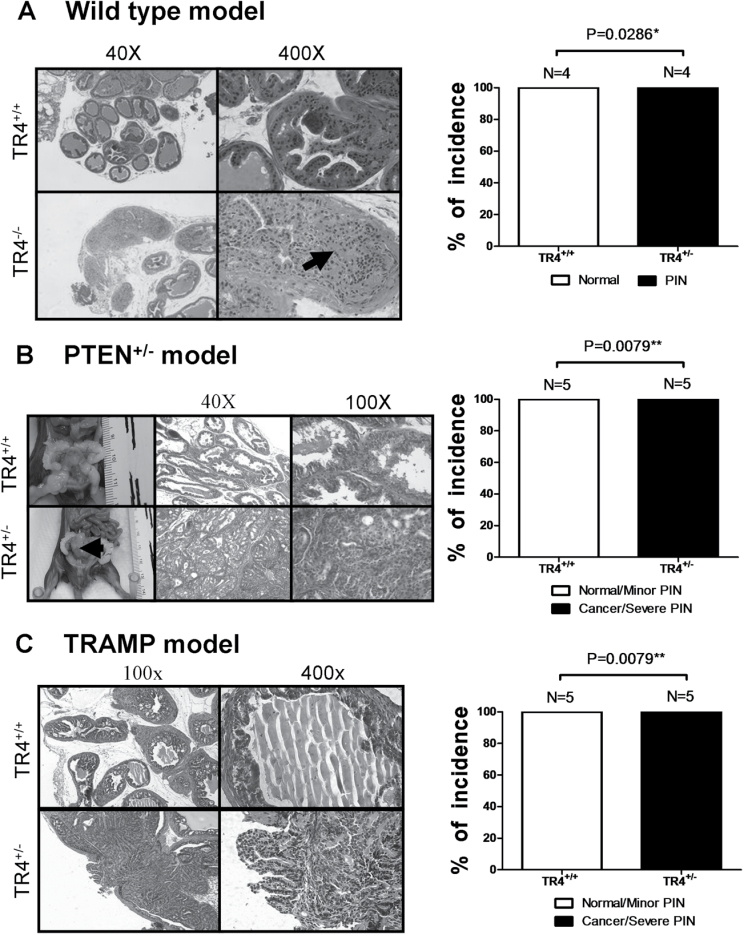
We used three different mouse models to investigate TR4 in vivo roles in prostate tumorigenesis. We first generated TR4 knockout C57BL/6 (B6) mouse (TR4− /−) and found mice lacking TR4 developed PIN lesions from 12 months old and none of their wild-type littermate control (TR4+/+) mice developed such PIN lesions (Figure 1A), suggesting loss of TR4 gene may play key roles for the development of PIN lesions.
Fig. 1.
Loss of TR4 promotes prostate tumorigenesis.
(A) TR4− /− mice show PIN phenotype, whereas TR4+/+ show normal prostate structure. The black arrow indicates PIN lesion. (B) PTEN+/−-TR4+/− mice develop PCa, whereas PTEN+/−-TR4+/+ show minor PIN lesions. The black arrow indicates prostate tumor. (C) TRAMP-TR4+/− show tumor formation or severe PIN lesions, whereas TRAMP-TR4+/+ show minor PIN lesions. Quantitations are shown in the right panels and the P values were calculated by Fisher’s exact test.
We then generated the second mouse model using PTEN+/− mice that could spontaneously develop PIN lesions (14). We mated TR4+/− mouse with PTEN+/− mouse to generate PTEN+/−-TR4+/− mice (B6) and found PTEN+/−-TR4+/− mice could form severe PIN lesions, PIN III or PIN IV as defined by Park et al. (15), and also overcome the natural tumor suppression barrier to further develop PCa at 15 months old, whereas their littermate PTEN+/−-TR4+/+ mice could only develop minor PIN lesions, PIN I or PIN II (15) (Figure 1B). These results further confirmed the above finding showing TR4 might play a suppressor role in the prostate tumorigenesis.
Finally, we applied the third mouse model using TRAMP mouse that could spontaneously develop PCa (16) to confirm the above findings. We generated TRAMP-TR4+/− mice (B6) and compared PIN development with control TRAMP-TR4+/+ mice. The TR4 expression level is decreased in TRAMP-TR4+/− mice (Supplementary Figure S1A, available at Carcinogenesis Online). As expected, we found TRAMP-TR4+/− mice developed severe PIN lesions and PCa at 6 months old, whereas TRAMP-TR4+/+ mice developed only minor PIN lesions (Figure 1C).
Together, results of Figure 1A–C from three different mouse models demonstrated that TR4 could play a suppressor role in prostate tumorigenesis and loss of TR4 promotes PIN (all three models) and PCa development (PTEN+/− and TRAMP models).
TR4 suppresses prostate tumorigenesis in prostate cell transformation assay
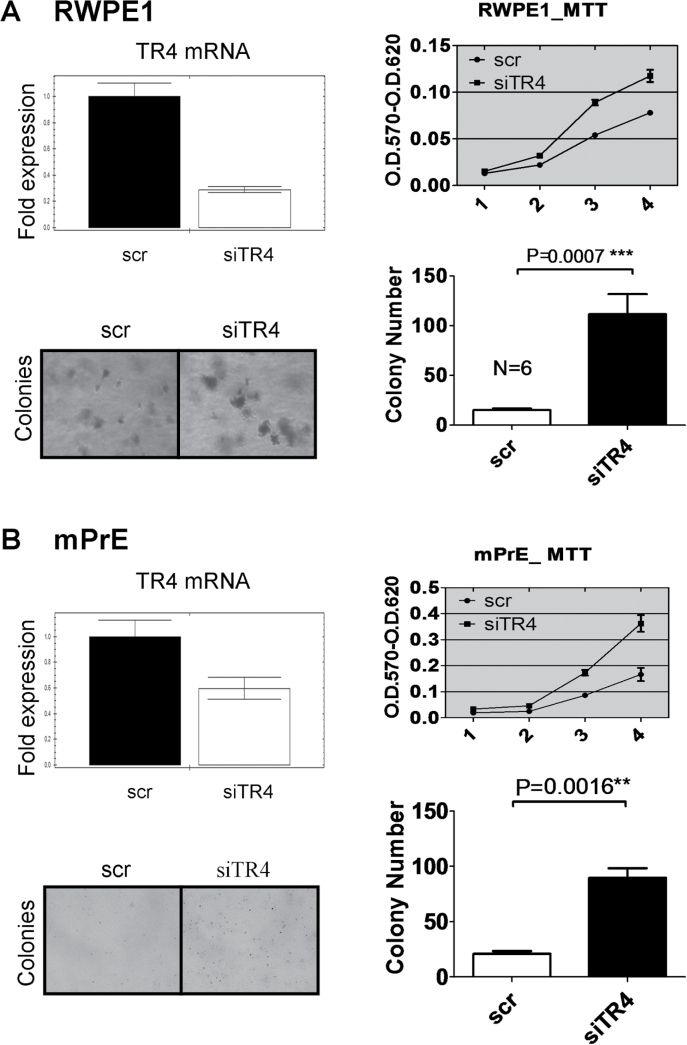
We then applied cell transformation with colony formation assay using two prostate epithelial cell lines, human and mouse, RWPE1 and mPrE, respectively (13), to confirm the above in vivo data. RWPE1 cells stably transfected with TR4 small interfering RNA (RWPE1_siTR4) or scramble small interfering RNA (RWPE1_scr) (Figure 2A, upper left panel) were first treated with carcinogen MNU and then assayed for cell proliferation using 3-(4,5-dimethylthiazole-2-yl)-2,5-diphenyl tetrazolium bromide assay. The results showed that RWPE1_siTR4 had better cell growth compared with RWPE1_scr (Figure 2A, upper right panel). We then performed cell transformation followed by colony formation assay via treating these RWPE1 cells with carcinogen MNU for three cycles (17), and results showed that RWPE1_siTR4 had better cell transformation compared with RWPE1_scr (Figure 2A, lower panels). Similar results of cell proliferation and cell transformation followed by colony formation assay also occurred when we replaced the RWPE1 cells with the mPrE cells (Figure 2B).
Fig. 2.
TR4 inhibits both mouse and human prostate epithelial cells growth and colony formation.
(A) Quantitative PCR showed RWPE1 cells TR4 messenger RNA (mRNA) level was knocked down by stably transfecting TR4 small interfering RNA (upper left panel). RWPE1_siTR4 and RWPE1_scr cells were treated with carcinogen MNU at 100 μg/ml for 2h each cycle. After three cycles of treatment, the cells were passaged another five times. RWPE1_siTR4 cells had increased growth (upper right panel) and colony formation (lower left panel). P value is 0.0007 in colony formation assay by Student’s t-test (lower right panel). (B) Quantitative PCR showed mPrE cells TR4 mRNA level was knocked down by stably transfected TR4 small interfering RNA (upper left panel). mPrE_siTR4 and mPrE_scr cells were treated with carcinogen MNU at 100 μg/ml for 2h each cycle. After 30 cycles of treatment, the cells were passaged another five times. mPrE_siTR4 cells had increased growth (upper right panel) and colony formation (lower left panel). P value is 0.0016 in colony formation assay by Student’s t-test (lower right panel).
Together, results from Figure 2A and B of prostate cell transformation confirmed the above in vivo data and concluded that knocking down TR4 promotes PCa development; therefore, TR4 could play a suppressor role in prostate tumorigenesis
Loss of TR4 interrupts DNA damage and DNA repair system both in vitro and in vivo
Genome instability, or DNA damage, is the major factor to cause normal cells transformation to cancer cells. With the neoplastic cellular phenotype progression, genomic stability continues to deteriorate, leading to a vicious cycle of genomic aberrations and advancing malignancy. The DNA damage response is crucial for cell survival and for avoiding neoplasia that occurs by transducing the damage signal to DNA repair machinery (18). One of the first processes is massive phosphorylation of the tail of a histone protein variant called H2AX (19). Foci of phosphorylated H2AX (γH2AX) are rapidly formed and are thought to be essential for further recruitment of repair factors, such as the MRN complex, RAD51 and BRCA1 (20). Thus, γH2AX staining usually serves as a marker for DNA damage.
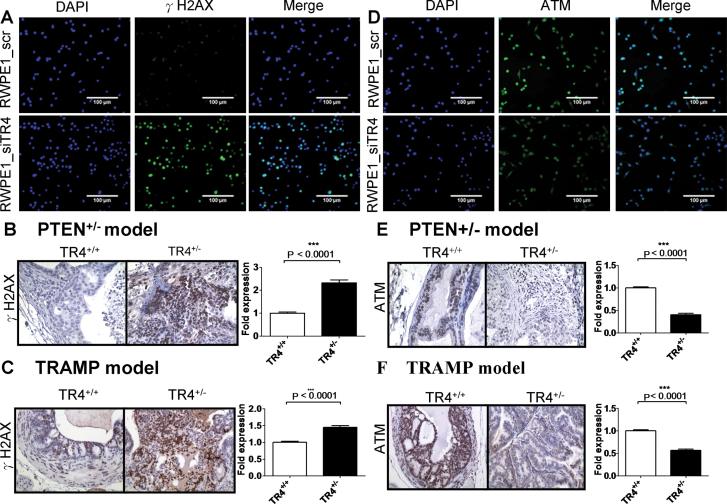
Based on the above facts, we hypothesized TR4 may prevent prostate tumorigenesis by protecting DNA stability. We first checked DNA damage in RWPE1 cell lines by immunofluorescence staining and found RWPE1_siTR4 cells had increased DNA damage marker γH2AX expression compared with RWPE1_scr cells (Figure 3A). Similar in vivo results were also obtained when we examined the γH2AX expression in prostate tissues using IHC staining in both TRAMP and PTEN mouse models showing knocking out one allele of TR4 led to increased DNA damage with increased γH2AX expression in PTEN+/−-TR4+/− and TRAMP-TR4+/− mice as compared with PTEN+/−-TR4+/+ and TRAMP-TR4+/+ mice (Figure 3B and C, respectively).
Fig. 3.
Reduction of TR4 increases DNA damage but decreases DNA repair gene ATM expression both in vitro and in vivo.
(A) Knocking down TR4 in RWPE1 cells (RWPE1_siTR4) increased DNA damage marker γH2AX foci formation compared with scramble siRNA control cell line (RWPE1_scr) upon carcinogen MNU 100 μg/ml treatment for three cycles. From left to right panels are 4′,6-diamidino-2-phenylindole (DAPI) staining for nuclei, γH2AX staining and merge with DAPI and γH2AX staining. (B and C) DNA damage marker γH2AX expression in prostate tissues increased in PTEN+/−-TR4+/− mice (B) as well as in TRAMP-TR4+/− mice (C) compared with TR4+/+ control mice using IHC staining. (D) RWPE1_siTR4 cells fail to induce DNA repair gene ATM expression compared with RWPE1_scr upon carcinogen MNU 100 μg/ml treatment for three cycles. From left to right panels are DAPI staining for nuclei, ATM staining and merge with DAPI and ATM staining. (E and F) DNA repair gene ATM expression in prostate tissues decreased in PTEN+/−-TR4+/− mice (E) as well as in TRAMP-TR4+/− mice (F) compared with TR4+/+ control mice using IHC staining. The density of γH2AX and ATM staining was calculated by ImageJ software by averaging six randomly selected fields. P values are < 0.0001 by Student’s t-test in both mouse models.
We then performed mouse DNA damage/repair signaling pathway PCR array in MEFs isolated from TR4− /− versus TR4+/+ mice, as impaired DNA repair system not only led to increased/accumulated DNA damage, it has also been reported to serve as a caretaker to protect DNA integrity, hence prevent normal cells from transforming into cancer cells (18). The DNA damage/repair pathway PCR array involves DNA damage signaling pathways that are associated with the ATM signaling network and transcriptional targets of DNA damage response. We treated the MEFs with 250 μM DNA damage agent H2O2 for 2 h then changed to the fresh normal medium. After 24 h of incubation, we performed the PCR array. The results showed H2O2 could increase DNA repair genes expression in TR4+/+ MEFs but not in TR4− /− MEFs (Supplementary Figure S2A–D, available at Carcinogenesis Online). The whole data set of the PCR array is shown in the Supplementary Table S1, available at Carcinogenesis Online. Together, the data suggests TR4 might influence prostate tumorigenesis via modulation of expression in those genes involved in the DNA damage/repair system.
TR4 regulates DNA repair gene ATM at transcriptional level
The microarray data (Supplementary Table S1, available at Carcinogenesis Online) showed many genes involved in the DNA repair system were modulated upon loss of TR4. We believe many parts, not just a single point, of the DNA repair system were altered via knocking out the TR4 gene. Since the DNA repair system involves many kinds of repairs, such as base excision repair, nucleotide excision repair, double-strand break repair and mismatch repair, we highly suspected that TR4 might alter the DNA repair system from the very upstream signal, i.e. the sensor of DNA damage. We therefore decided to focus our investigation on the influences of ATM, the key DNA damage sensor and transducer (18). We first confirmed that knocking down TR4 led to decreased ATM protein expression in RWPE1_siTR4 compared with RWPE1_scr cells using immunofluorescence staining (Figure 3D). We then examined the ATM protein expression in prostate tissues using IHC staining in both TRAMP and PTEN mouse models and found that knocking out one allele of TR4 led to decreased ATM expression in PTEN+/−-TR4+/− and TRAMP-TR4+/− mice as compared with PTEN+/−-TR4+/+ and TRAMP-TR4+/+ mice (Figure 3E and F, respectively). Furthermore, we also found that knocking out one allele of TR4 led to decreased phospho-ATM expression in TRAMP-TR4+/− mice as compared with TRAMP-TR4+/+ mice (Supplementary Figure S1B, available at Carcinogenesis Online).
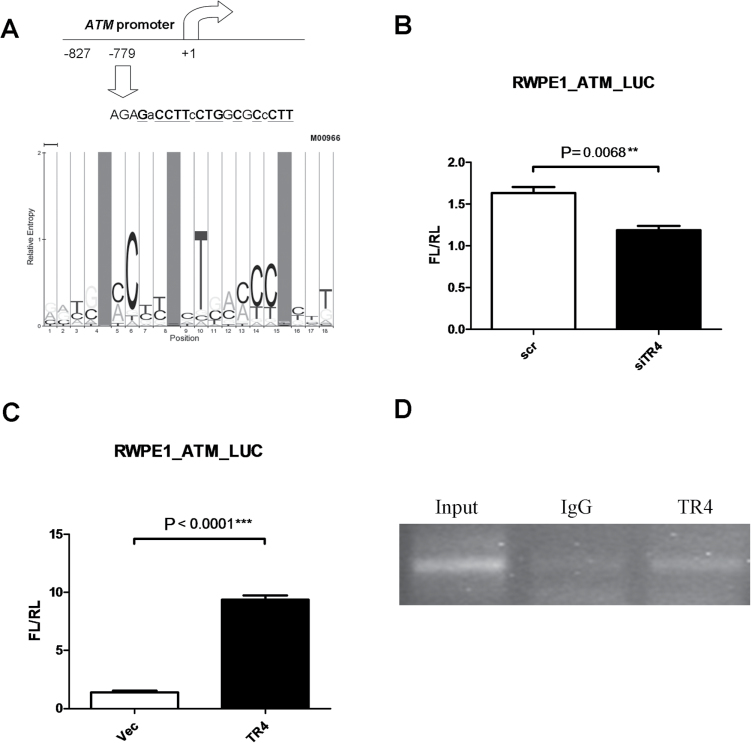
To determine if ATM expression is controlled by TR4 through its transcriptional regulation, we then cloned the ATM promoter with the putative TR4 binding site (Figure 4A) into luciferase reporter plasmid and transfected it into RWPE1_siTR4 or RWPE1_scr cells. As expected, the results showed knocking down TR4 led to reduction of ATM-luciferase activity (Figure 4B). We also transfected the reporter plasmid into RWPE1 cell lines with stably transfected TR4 overexpression or vector control. As expected, the results showed overexpression of TR4 led to induction of ATM-luciferase activity (Figure 4C).
Fig. 4.
TR4 prevents prostate tumorigenesis by regulating DNA repair gene ATM transcription.
(A) Scheme of putative TR4 binding element on ATM promoter. The sequence was determined by Multi-genome Analysis of Positions and Patterns of Elements of Regulation search engine (MAPPER). The sequence matching model M00966 is marked in bold with underline. (B and C) ATM promoter was cloned into luciferase reporter vector pGL3 and was transfected along with internal control pRL-tk into RWPE1 cells. The results show that knocking down TR4 reduced ATM-Luc activity in RWPE1 cell, whereas overexpression increased ATM-Luc activity. Y-axis FL/RL indicates firefly luciferase activity normalized by internal control renilla luciferase activity. The results were normalized by internal control and were repeated three times. P values are 0.0068 and <0.0001 in TR4 knockdown and TR4 overexpression groups, respectively, via Student’s t-test, respectively. (D) Chromatin immunoprecipitation assay shows TR4 can physically bind to ATM promoter region shown in Figure 6A. 1×10⁶ cells per 200 μl of SDS Lysis Buffer were sonicated and DNA was pulled down by either TR4 antibody or normal mouse IgG. DNA from each group was washed, eluted and amplified by specific primers flanking the sequences shown in A. Input sample (1% of total sample) was gathered before immunoprecipitation was performed.
We further applied chromatin immunoprecipitation assay to prove in vivo direct binding of TR4 to the ATM promoter, and results showed TR4 could directly bind to the ATM promoter, in vitro (Figure 4D).
Together, results from Figures 3 and 4 demonstrated well that TR4 could modulate ATM expression (Figure 3D–F) at the transcriptional level (Figure 4).
ATM interrupts loss of TR4-induced prostate tumorigenesis in cell transformation assay
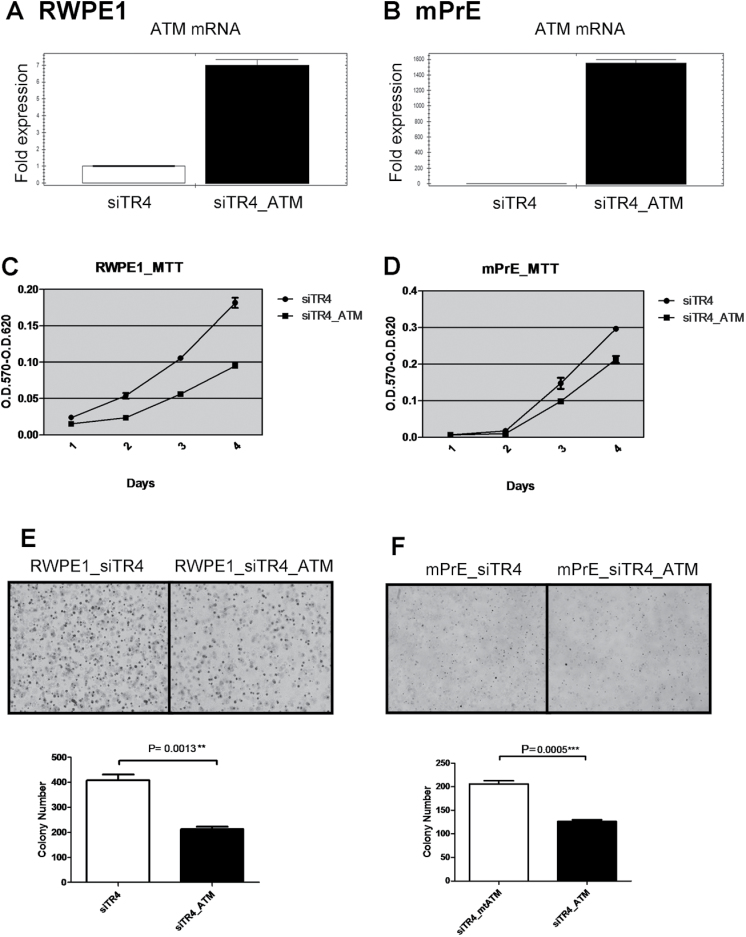
Importantly, we needed to demonstrate ATM is the key element in TR4-mediated prostate tumorigenesis via interruption experiments. As expected, addition of ATM by stable transfection in RWPE1_siTR4 and mPrE_siTR4 partially interrupted cell growth induced by carcinogen MNU treatment by >50% (Figure 5A–D). Similar interruption effect also occurred in cell transformation induced by carcinogen MNU treatment by stably adding back ATM in TR4 knocked down RWPE1 and mPrE cells, which indicates ATM could interrupt the loss of TR4-induced cell transformation (Figure 5E and F).
Fig. 5.
ATM interrupts loss of TR4-induced prostate tumorigenesis.
(A and B) Quantitative PCR shows ATM mRNA overexpression in both RWPE1_siTR4 and mPrE_siTR4 cell lines. RWPE1siTR4_ATM and mPrEsiTR4_ATM represent ATM overexpression in these two cell lines. (C–F) Stably overexpressing functional ATM partially interrupted TR4 siRNA-induced cell growth (C and D) and colony formation (E and F, upper panels) after carcinogen MNU treatment in both RWPE1 and mPrE cell lines. Quantitations are shown in the lower panels of E and F and the P values were calculated by Student’s t-test.
ATM expression is highly correlated with TR4 in human TMA
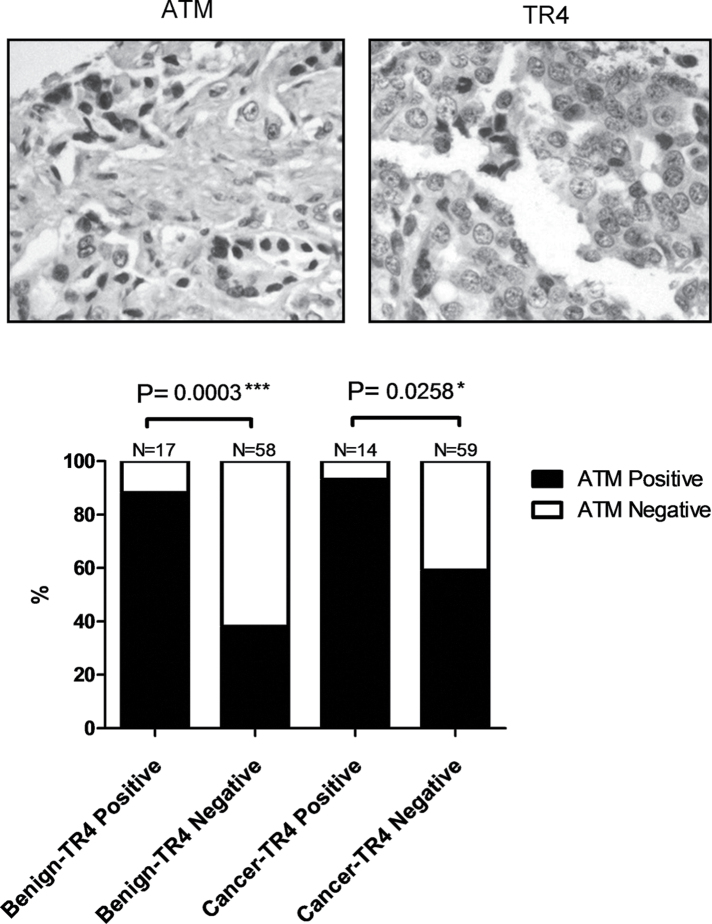
Finally, we immunohistochemically stained for TR4 and ATM using human prostate TMAs (Figure 6, top panels). Although we did not see a statistically significant difference in TR4 expression between the benign tissue versus cancer tissue, we did find 88% of benign prostate or 93% of PCa tissues with TR4 expression also showed positive ATM expression; on the other hand, only 38% of benign or 59% of PCa tissues showed ATM-positivity when TR4 is not expressed (by German immunoreactive score, see Materials and methods for detail) (Figure 6, lower panel). These human data together with mouse and cell line data indicates ATM expression is controlled by TR4 and therefore regulates the DNA repair system.
Fig. 6.
ATM expression level is highly correlated with TR4 in human TMA.
The representative IHC staining pictures are shown in the top panels. IHC in human prostate TMA shows correlations of ATM versus TR4 expression. When PCa samples were divided into TR4 positive versus TR4 negative, ATM expression is significantly reduced in the TR4-negative group. The P values were calculated by Fisher’s exact test.
Discussion
For prostate tumorigenesis, PTEN was the only identified tumor suppressor showing loss of one allele could lead to PIN development (14). Here we showed loss of both alleles of TR4 also led to PIN development, suggesting TR4 is a newly identified tumor suppressor of prostate tumorigenesis. Importantly, one allele deletion of TR4 in PTEN+/− mice not only resulted in this new PTEN+/−-TR4+/− mouse forming more severe PIN lesions, it also overcame the natural tumor suppression barrier to push prostate PIN stage into PCa that their littermate PTEN+/−-TR4+/+ mice could never reach (Figure 1B). These key findings from these knockout mouse models demonstrate that TR4 is a strong tumor suppressor to control prostate tumorigenesis. Early reports also found that adding the second deletion of p27KIP1 or NKX3.1 in PTEN+/− mouse might also lead to development of PCa (21,22), however, unlike TR4, with deletion of one allele of p27KIP1 or NKX3.1 gene the mice failed to develop PIN (23,24).
As our results concluded that TR4 could function as a suppressor of prostate tumorigenesis, one might expect that any small molecules or gene products that could either increase TR4 expression or enhance this nuclear receptor activity might then be able to promote the suppressor activity of TR4 to either prevent or delay prostate tumorigenesis or development. Interestingly, early studies did find some selective molecules were able to modulate TR4 expression and/or TR4 activity.
The first of such molecules was the retinoic acid, a vitamin A metabolite that was able to increase TR4 expression (25). Since retinoic acid could also go through increasing DNA repair to exert its antitumor activity (26), it will be interesting to determine if TR4 may also be involved in the retinoic acid-mediated antitumor activity.
Another TR4 upstream inducer is forkhead transcriptional factor FOXO3a, a key stress-responsive factor (27) that is negatively controlled by the PI3K/AKT pathway. Addition of the AKT inhibitor LY294002 enhances FOXO3a translocation and activity (28), which might increase TR4 expression, and then result in suppression of prostate tumorigenesis. Indeed, results from our PTEN+/− mouse model did support such a conclusion showing more PI3K/AKT signals in PTEN+/− mice could reduce FOXO3a expression, which might then lead to suppress TR4 expression. The consequence of such suppression then allowed PTEN+/−-TR4− /− mice to develop PIN more easily (Figure 1).
The microarray data in Supplementary Table S1, available at Carcinogenesis Online listed many genes involved in DNA repair system were modulated upon loss of TR4. Other than ATM, that we chose to further dissect to determine the mechanism by which TR4 suppressed prostate tumorigenesis, we believe other TR4 modulated genes might also play important roles to influence prostate tumorigenesis, especially since the prostate carcinogenesis is a long-term process in order to accumulate enough mutations via DNA instability (average age at time of diagnosis is 70, ref. 29). For example, mutations in BRCA1 and BRCA2, important risk factors for breast/ovarian cancers that play important roles in DNA damage response (30), have also been linked to PCa development (4). In addition, the vitamin D receptor, another nuclear receptor (31), could also regulate ATM signaling to prevent PCa tumorigenesis (32), as well as the PTEN tumor suppressor (33) also could maintain the chromosomal integrity (34).
In summary, we identified TR4 as a new prostate tumor suppressor gene and mechanism dissection found TR4 might go through modulation of the DNA repair system to suppress prostate tumorigenesis. IHC data from human PCa samples also supported the linkage of TR4 expression with ATM expression and its roles in DNA damage. These findings may provide us a new potential therapeutic target to better battle PCa in the future.
Supplementary material
Supplementary Table S1 and Figures S1 and S2 can be found at http://carcin.oxfordjournals.org/
Funding
National Institutes of Health Grants (CA156700, CA127548, DK73414); Taiwan Department of Health Clinical Trial and Research Center of Excellence Grant (DOH99-TD-B-111-004; China Medical University, Taichung, Taiwan).
Supplementary Material
Acknowledgement
We thank K.Wolf for help in editing the manuscript.
Conflict of Interest Statement: The authors have nothing to disclose.
Glossary
Abbreviations:
- IHC
immunohistochemistry
- MEF
mouse embryonic fibroblast
- MNU
N-methyl-N-nitrosourea
- PCa
prostate cancer
- PIN
prostatic intraepithelial neoplasia
- TMA
tissue microarray
- TR4
testicular nuclear receptor 4.
References
- 1. Siegel R., et al. (2011). Cancer statistics, 2011: the impact of eliminating socioeconomic and racial disparities on premature cancer deaths. Cancer J. Clin., 61, 212–236 [DOI] [PubMed] [Google Scholar]
- 2. Hoffman R.M., et al. (2001). Racial and ethnic differences in advanced-stage prostate cancer: the Prostate Cancer Outcomes Study. J. Natl Cancer Inst., 93, 388–395 [DOI] [PubMed] [Google Scholar]
- 3. Lichtenstein P., et al. (2000). Environmental and heritable factors in the causation of cancer–analyses of cohorts of twins from Sweden, Denmark, and Finland. N. Engl. J. Med., 343, 78–85 [DOI] [PubMed] [Google Scholar]
- 4. Struewing J.P., et al. (1997). The risk of cancer associated with specific mutations of BRCA1 and BRCA2 among Ashkenazi Jews. N. Engl. J. Med., 336, 1401–1408 [DOI] [PubMed] [Google Scholar]
- 5. Chavarro J.E., et al. (2008). A prospective study of trans-fatty acid levels in blood and risk of prostate cancer. Cancer Epidemiol. Biomarkers Prev., 17, 95–101 [DOI] [PubMed] [Google Scholar]
- 6. Schulman C.C., et al. (2001). Nutrition and prostate cancer: evidence or suspicion? Urology, 58, 318–334 [DOI] [PubMed] [Google Scholar]
- 7. Chang C., et al. (1994). Human and rat TR4 orphan receptors specify a subclass of the steroid receptor superfamily. Proc. Natl Acad. Sci. USA, 91, 6040–6044 [DOI] [PMC free article] [PubMed] [Google Scholar]
- 8. Bookout A.L., et al. (2006). Anatomical profiling of nuclear receptor expression reveals a hierarchical transcriptional network. Cell, 126, 789–799 [DOI] [PMC free article] [PubMed] [Google Scholar]
- 9. Collins L.L., et al. (2004). Growth retardation and abnormal maternal behavior in mice lacking testicular orphan nuclear receptor 4. Proc. Natl Acad. Sci. USA, 101, 15058–15063 [DOI] [PMC free article] [PubMed] [Google Scholar]
- 10. Chen Y.T., et al. (2008). The roles of testicular orphan nuclear receptor 4 (TR4) in cerebellar development. Cerebellum. 7, 9–17 [DOI] [PubMed] [Google Scholar]
- 11. Chen L.M., et al. (2008). Subfertility with defective folliculogenesis in female mice lacking testicular orphan nuclear receptor 4. Mol. Endocrinol., 22, 858–867 [DOI] [PMC free article] [PubMed] [Google Scholar]
- 12. Zhang Y., et al. (2007). Loss of testicular orphan receptor 4 impairs normal myelination in mouse forebrain. Mol. Endocrinol., 21, 908–920 [DOI] [PubMed] [Google Scholar]
- 13. Jiang M., et al. (2010). Disruption of PPARgamma signaling results in mouse prostatic intraepithelial neoplasia involving active autophagy. Cell Death Differ., 17, 469–481 [DOI] [PMC free article] [PubMed] [Google Scholar]
- 14. Di Cristofano A., et al. (1998). Pten is essential for embryonic development and tumour suppression. Nat. Genet., 19, 348–355 [DOI] [PubMed] [Google Scholar]
- 15. Park J.H., et al. (2002). Prostatic intraepithelial neoplasia in genetically engineered mice. Am. J. Pathol., 161, 727–735 [DOI] [PMC free article] [PubMed] [Google Scholar]
- 16. Greenberg N.M., et al. (1995). Prostate cancer in a transgenic mouse. Proc. Natl Acad. Sci. USA, 92, 3439–3443 [DOI] [PMC free article] [PubMed] [Google Scholar]
- 17. Bosland M.C. (1992). Animal models for the study of prostate carcinogenesis. J. Cell. Biochem. Suppl., 16H, 89–98 [DOI] [PubMed] [Google Scholar]
- 18. Shiloh Y. (2003). ATM and related protein kinases: safeguarding genome integrity. Nat. Rev. Cancer, 3, 155–168 [DOI] [PubMed] [Google Scholar]
- 19. Redon C., et al. (2002). Histone H2A variants H2AX and H2AZ. Curr. Opin. Genet. Dev., 12, 162–169 [DOI] [PubMed] [Google Scholar]
- 20. Celeste A., et al. (2002). Genomic instability in mice lacking histone H2AX. Science, 296, 922–927 [DOI] [PMC free article] [PubMed] [Google Scholar]
- 21. Di Cristofano A., et al. (2001). Pten and p27KIP1 cooperate in prostate cancer tumor suppression in the mouse. Nat. Genet., 27, 222–224 [DOI] [PubMed] [Google Scholar]
- 22. Kim M.J., et al. (2002). Cooperativity of Nkx3.1 and Pten loss of function in a mouse model of prostate carcinogenesis. Proc. Natl Acad. Sci. USA, 99, 2884–2889 [DOI] [PMC free article] [PubMed] [Google Scholar]
- 23. Cordon-Cardo C., et al. (1998). Distinct altered patterns of p27KIP1 gene expression in benign prostatic hyperplasia and prostatic carcinoma. J. Natl Cancer Inst., 90, 1284–1291 [DOI] [PubMed] [Google Scholar]
- 24. Bhatia-Gaur R., et al. (1999). Roles for Nkx3.1 in prostate development and cancer. Genes Dev., 13, 966–977 [DOI] [PMC free article] [PubMed] [Google Scholar]
- 25. Inui S., et al. (1999). Induction of TR4 orphan receptor by retinoic acid in human HaCaT keratinocytes. J. Invest. Dermatol., 112, 426–431 [DOI] [PubMed] [Google Scholar]
- 26. Li G., et al. (2000). Effect of retinoic acid on apoptosis and DNA repair in human keratinocytes after UVB irradiation. J. Cutan. Med. Surg., 4, 2–7 [DOI] [PubMed] [Google Scholar]
- 27. Li G., et al. (2008). Oxidative stress stimulates testicular orphan receptor 4 through forkhead transcription factor forkhead box O3a. Endocrinology, 149, 3490–3499 [DOI] [PMC free article] [PubMed] [Google Scholar]
- 28. Brunet A., et al. (1999). Akt promotes cell survival by phosphorylating and inhibiting a Forkhead transcription factor. Cell, 96, 857–868 [DOI] [PubMed] [Google Scholar]
- 29. Hankey B.F., et al. (1999). Cancer surveillance series: interpreting trends in prostate cancer–part I: Evidence of the effects of screening in recent prostate cancer incidence, mortality, and survival rates. J. Natl Cancer Inst., 91, 1017–1024 [DOI] [PubMed] [Google Scholar]
- 30. Zhang H., et al. (1998). BRCA1, BRCA2, and DNA damage response: collision or collusion? Cell, 92, 433–436 [DOI] [PubMed] [Google Scholar]
- 31. Gallagher R.P., et al. (1998). Prostate cancer: 3. Individual risk factors. CMAJ, 159, 807–813 [PMC free article] [PubMed] [Google Scholar]
- 32. Ting H.J., et al. (2012). A positive feedback signaling loop between ATM and the vitamin D receptor is critical for cancer chemoprevention by vitamin D. Cancer Res., 72, 958–968 [DOI] [PMC free article] [PubMed] [Google Scholar]
- 33. Li J., et al. (1997). PTEN, a putative protein tyrosine phosphatase gene mutated in human brain, breast, and prostate cancer. Science, 275, 1943–1947 [DOI] [PubMed] [Google Scholar]
- 34. Shen W.H., et al. (2007). Essential role for nuclear PTEN in maintaining chromosomal integrity. Cell, 128, 157–170 [DOI] [PubMed] [Google Scholar]
Associated Data
This section collects any data citations, data availability statements, or supplementary materials included in this article.


