

Abstract
Brain structure varies between people in a markedly organized fashion. Communities of brain regions co-vary in their morphological properties. For example, cortical thickness in one region influences the thickness of structurally and functionally connected regions. Such networks of structural co-variance partially recapitulate the functional networks of healthy individuals and the foci of grey matter loss in neurodegenerative disease. This architecture is genetically heritable, is associated with behavioural and cognitive abilities and is changed systematically across the lifespan. The biological meaning of this structural co-variance remains controversial, but it appears to reflect developmental coordination or synchronized maturation between areas of the brain. This Review discusses the state of current research into brain structural co-variance, its underlying mechanisms and its potential value in the understanding of various neurological and psychiatric conditions.
There are marked inter-individual differences in the structure of cortical regions. For example, the between-subject variability in the volume of a specific gyrus is typically much greater than the between-subject variability in whole brain volume1. It has also been increasingly recognized that inter-individual differences in the structure of a brain region often covary with inter-individual differences in other brain regions — a phenomenon known as structural covariance. For example, individuals with greater cortical thickness of Broca’s area of the inferior frontal cortex typically also have greater thickness of Wernicke’s area of the superior temporal cortex2. In theory, inter-individual differences in regional volume, thickness and surface area could be driven by factors that affect each person and each region independently. However, the phenomenon of structural co-variance shows that inter-individual differences in regional structure are in fact coordinated within communities of brain regions that fluctuate together in size across the population. Post-mortem studies of visual3 and motor systems4 were among the first to demonstrate these structural correlations between anatomical regions of the human brain, but the advent of computer-automated analysis of high-resolution structural MRI has enabled the in vivo study of correlation patterns across the whole brain in thousands of individuals (BOX 1).
Box 1 | Measuring structural co-variance in human brain MRI data.
An MRI scan images the hydrogen in water molecules throughout the brain as pulses of energy alter their alignment with the scanner’s static magnetic field. The timing of these alterations depends on the specific kind of brain tissue and on magnetic gradients that are superimposed on the static magnetic field, enabling a three-dimensional picture of the brain. Analogous to a pixel in a two-dimensional digital photograph, the approximately cubic ‘voxel’ is the basic element of these images187. Further analysis of these brain images yields morphological information about regions of the brain, such as their volume, thickness and surface area.
Manual tracing of brain images by expert anatomists has given way to largely computer-automated analyses. In approaches such as voxel-based morphometry, voxels are segmented on the basis of their image intensity into one of three tissue classes: cerebrospinal fluid, white matter or grey matter. After registering all of the scans in a study into a common anatomical space, using an average brain as a template, the grey matter density (or ‘volume’) at each voxel can be compared across the brain and between subjects188–190. In contrast to these intensity-based approaches, surface-based analyses explicitly model the boundaries that separate the grey matter of the cerebral cortex from the deeper white matter and the surrounding cerebrospinal fluid191–194. This step enables the distinction between surface area and thickness contributions to cortical volume, which may have different genetic195 and developmental196 underpinnings. In addition, surface-based approaches can explicitly study cortical folding and curvature197.
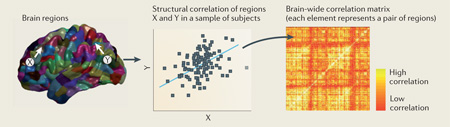
The simplest case of determining structural co-variance is to consider the relationship between the morphology of one brain region and that of another brain region, each measured in a large sample of human subjects (see the figure). Commonly, the linear dependence between these two datasets is indicated by the product–moment correlation coefficient, Pearson’s r. The terms co-variance and correlation are often used synonymously, but only the correlation coefficient is normalized by the variance of the individual datasets, which makes it possible to compare correlations between datasets of different scales. Alternative statistics offer increased robustness to statistical outliers198 and/or sensitivity to non-linear relationships199. Confounding variables that could affect correlation patterns within a sample, such as age and gender, can be corrected for by using partial correlation methods. Allometric relationships in the form of different brain regions scaling differently with total brain size200,201 can also be incorporated into statistical models.
Outstanding methodological problems exist in structural MRI analysis in general, and in structural co-variance analysis in particular. Issues with in-scanner subject motion, spatial normalization and MRI tissue contrast make the reliable and accurate extraction of morphological properties in paediatric samples a particular challenge202. The cellular interpretation of MRI-based morphological properties is also non-trivial and difficult to compare across experimental contexts. For example, ‘cortical thinning’ during adolescence could reflect synaptic pruning or increased myelination109, whereas it is associated with neuronal loss in neurodegenerative disease203.
Although measures of grey matter volume and cortical thickness have been the subject of most studies to date and are therefore the focus of this Review, studies have begun to look at the co-variance of other structural phenotypes, including surface area204, white matter volume150,205 and diffusion imaging measures of tissue integrity206. Co-variance patterns need not be the same across structural phenotypes, and differences have already been demonstrated between cortical thickness and surface area co-variance204. Co-variance methods are theoretically applicable to any structural or anatomical phenotype, and including a larger array of brain imaging measures is a major target for future research. The figure is modified, with permission, from REF. 32 © (2013) Society for Neuroscience.
In this article, we review the literature regarding structurally co-varying brain systems. We discuss details of the anatomical organization of these brain systems and show how this organization changes in normal development and healthy ageing. We highlight the role of genetic and environmental factors in structural co-variance, which have begun to be elucidated by twin studies and by studies of training-induced alterations in brain anatomy, and present evidence that various neurological and psychiatric conditions are associated with abnormal structural co-variance networks. Last, we assess the relationship between structural co-variance and other forms of brain connectivity, such as intrinsic activity and white matter networks, and discuss its future role in basic and clinical neuroscience.
The anatomy of structural co-variance
Organizational principles
Research and methodological developments over the past decade and a half have started to identify the organizational principles that govern the anatomy and topology of structural covariance networks (BOX 2). Brain areas that are highly correlated in size are often part of systems that are known to subserve particular behavioural or cognitive functions, highlighting the importance of known functional relationships between anatomical regions. For example, posterior and anterior language areas in the left hemisphere of the brain co-vary strongly in their cortical thickness2. The grey matter volume of the hippocampus co-varies mostly strongly with that of other regions known to be involved in the memory system, including the amygdala and parahippocampal, perirhinal, entorhinal and orbitofrontal cortices5. Motor, auditory, visual and other cognitive systems can also be discriminated on the basis of their patterns of anatomical co-variance6.
Box 2 | Structural co-variance networks.
Studies that reveal structural co-variance networks generally use one out of three experimental approaches: seed analysis, principal component analysis or graph analysis. These methods are not unique to structural co-variance analysis, and they have analogues in the analysis of other brain connectivity and correlational data. For example, in functional MRI (fMRI) functional connectivity analysis, if correlations in brain activity are calculated between regions over time, then similar network methods can be applied. Brain structures measured in multiple subjects have the same statistical role for structural co-variance analysis as brain activations measured at multiple time points do for functional connectivity analysis.
Possibly the most straightforward of these methods is seed analysis. Here, the morphology in one seed region is compared with the morphology in the rest of the brain to generate a whole-brain map of structural co-variance (see panel a of the figure, which shows maps resulting from two different seed regions on the left and the right, respectively, with non-cortical areas blacked out). Maps created from different seed regions or from samples taken from different patient populations can then be compared.
Principal component analysis reduces the inter-regional co-variance across people to a small number of factors that are easier to visualize and interpret (see panel b of the figure, which shows brain maps of three components, with non-cortical areas blacked out). The principal components are like anatomical patterns composed of highly correlated brain regions: the different patterns are more strongly expressed in some people and less strongly in others, but together they explain a large portion of the variation across people. In principal component analysis, these different patterns are orthogonal to each other (perpendicular in multidimensional space); in addition, the first component explains as much of the total variance as possible, the second component explains as much of the remaining variance as possible and so on. Stressing other properties of the components, such as their statistical independence, yields different techniques, such as independent component analysis.
The graph theoretical approach tries to summarize complex global and regional co-variance patterns into biologically meaningful properties. A graph is a model that describes some basic elements (nodes) and the relationships between them (edges). In this case, nodes are brain regions, and edges represent significant morphological correlations between them. Graphs whose edges tend to form triangles have high clustering; graphs with dispersed edges such that short paths exist between most nodes have high efficiency; and graphs composed of communities with many within-community edges and fewer between-community edges have high modularity (FIG. 1). When applied to assess structural co-variance (see panel c of the figure), graph analysis performs pairwise correlations between every brain region. Thresholds are then applied, resulting in a small number of important correlations in a graph model, whose topological properties (such as clustering, modularity and efficiency) are measured. The properties of brain structural co-variance networks diverge sharply from simulated networks in which edges are drawn at random between nodes15,207. There are important and unresolved questions about graph construction and analysis208–210.
One important point of difference between structural co-variance, fMRI and diffusion MRI networks is that fMRI and diffusion MRI networks can routinely be constructed from measures of inter-regional association or connectivity estimated for an individual image. By contrast, structural co-variance networks are constructed from inter-regional correlations estimated on the basis of a group of individual images. Methods for the construction of a network from an individual structural MR image have been reported211 but not yet widely applied. This limits the opportunity to link structural co-variance metrics to inter-individual differences, for example, in cognitive function. Panel c is modified, with permission, from REF. 32 © (2013) Society for Neuroscience.

Spatial proximity between brain regions is suggestive of the presence of white matter tracts between these regions7–9, is indicative of coupling of their intrinsic activity9–11 and generally implies higher-than-average structural co-variance between the regions. In general, there is an inverse relationship between the strength of structural co-variance and the physical distance between brain areas12. This parsimonious tendency to form stronger correlations over shorter anatomical distances may be linked to brain segregation and segregative network properties such as clustering and modularity13.
However, there are also long-distance correlations between brain regions. Such exceptions may reveal the influence of brain integration and integrative topological properties on the formation of structural co-variance networks11,14,15. Although particularly strong correlations exist within cortical lobes and within subcortical structures, there are also strong inter-lobar, thalamo–cortical and striato–cortical relationships16–20. Furthermore, strong, long-distance correlations exist between contralateral homologous regions21. The structural properties of a select minority of brain regions known as network hubs (in the association cortex) appear to disproportionately influence the structure of the rest of the brain, including spatially distant regions12,22,23, whereas other areas (for example, the primary visual cortex) show correlations limited to their anatomical neighbourhood12,21,22,24. Networks derived from white matter tracts or synchronous neuronal activity between brain regions have a similar group of network hubs, which contribute to global efficiency by establishing paths of communication between all brain regions through a relatively small number of connections25,26 (FIG. 1).
Figure 1. Schematics of network properties.

a | A simulated network is used to illustrate common terms in network analysis. Nodes are represented as circles, and edges are represented as lines. Networks with short paths between most nodes have high global efficiency. Networks with many triangular motifs tend to have high nodal clustering and local efficiency. A disproportionate number of paths between nodes pass through network hubs. Nodes within the same module are connected by many edges, whereas nodes in different modules are connected by relatively fewer edges. b | An example of a network with high clustering but low global efficiency is shown on the left, an example of a network with low clustering but high global efficiency is shown in the middle, and an example of an intermediate (small-world) network with both relatively high clustering and relatively high global efficiency is shown on the right220.
Does co-variance mean connectivity?
One of the key challenges in interpreting structural co-variance networks is the lack of clarity about what these patterns in imaging data represent at a cellular level. Owing to the scarcity of studies investigating the mechanisms of structural co-variance, questions remain as to its biological interpretation. To be specific, can we assume that structural covariance is influenced by synaptic connectivity between brain regions, and/or is structural co-variance influenced by genetic and developmental relationships between cell types and lamina?
A common interpretation of brain structural co-variance is that it indeed results from brain connectivity of some kind, such as the physical connectivity of white matter tracts or the functional connectivity of synchronous neuronal activation (BOX 3). Plausible mechanisms exist to support this notion. Synapses between neurons can have a mutually trophic and protective effect on subsequent neuronal development, possibly via glutamatergic NMDA pathways27, with large numbers of such connections possibly leading to co-variance at the macroanatomic level28. Moreover, synchronous firing can induce synaptogenesis between neurons29,30, suggesting the possibility of use-dependent coordinated growth. Studies that have begun to explicitly test these relationships31,32 reveal that white matter connectivity and functional connectivity can explain a substantial portion but not all of the inter-regional structural covariance measured in human populations (FIG. 2).
Box 3 | Anatomical and functional connectivities.
Neuroimaging experiments explore the connectivity between anatomic parcels of brain matter using various methodological approaches. Diffusion MRI targets water molecules that diffuse preferentially along white matter tracts, which are groups of axons that are encased in layers of insulation and carry electrical signals across the brain. Unlike post-mortem dissection, microscopy and chemical tracing, which remain the gold standard for the determination of axonal connections, diffusion MRI can gather information about white matter tracts across the entire brain of a living person in a matter of minutes. However, crucial methodological issues remain unresolved212–214.
By contrast, coordinated brain activity between regions is often labelled ‘functional’ connectivity. The magnetic properties of oxygenated blood, which fluctuate with regional brain activity215, allow correlations between regions to be determined over time using functional MRI (fMRI). Electroencepholography (EEG) and magnetoencepholography (MEG) measure electrical signals directly as opposed to the (much slower) vascular response, but the spatial resolution of these methods is much lower than that of fMRI. A causal relationship between brain regions (as opposed to merely synchronized activity) is sometimes termed ‘effective connectivity’216. Both functional and effective connectivity can be changed by cognitive, behavioural and emotional tasks, but ‘intrinsic’ inter-regional relationships may also exist132.
As has been said of consciousness217, brain connectivity is a mongrel concept: there are many different kinds of ‘connectivities’. Even the arguably simplest kind of brain connectivity — the synapse between two neurons — has vastly different electrical, chemical, morphological and functional subtypes. It is therefore important not to simply conflate morphological co-variance across subjects — which itself is often described as structural or anatomical connectivity — with other kinds of brain connectivity. Studies comparing white matter and functional connectivity provide a template for such comparisons. These studies have demonstrated that if two regions are linked by a white matter tract, they tend to have high functional connectivity; however, functional connectivity also exists in the absence of direct white matter links, owing to indirect or emergent properties of white matter networks34,35,218,219. The relationships between brain connectivities must be explicitly tested.
Figure 2. Co-variance may reflect connectivity.

a | Clustering of the left and right insula into subregions reveals similar regional boundaries when the clustering is based on resting-state functional MRI functional connectivity data (‘functional’) as when it is based on grey matter co-variance (‘structural’). The similarity of these ‘clusters’ (indicated by different colours in the figure) is consistent with the idea that functional connectivity influences patterns of structural co-variance. b | Pairs of regions that have both high cortical thickness co-variance (that is, structural co-variance) and white matter tract connectivity (based on diffusion MRI) in the same group of subjects are shown on a transparent rendering of the brain. Circles represent network nodes and lines indicate reliable convergence between diffusion MRI and structural co-variance. This convergence is stronger between regions that are close in anatomical space and weaker between regions separated by long distances, illustrating both similarities and differences between white matter connectivity and structural co-variance. c | Structural co-variance, which here is derived from inter-regional correlations in cross-sectional measurements of cortical thickness, may reflect ‘maturational coupling.’ Maturational coupling was defined via a two-step process: first, the linear rate of change in cortical thickness from the age of 9 to 22 years was estimated for a group of subjects with multiple longitudinal MRI scans; and second, inter-individual differences in these rates of change were correlated between regions across the cortex. The correlation between structural co-variance and maturational coupling (r = 0.37) — measured across all pairs of brain regions in the same group of subjects — indicates the inter-dependence of these measures (top panel). The brain maps (bottom panel) illustrate these correlations in a region-specific fashion, showing that the level of convergence (shown by the colour, a warmer colour indicating a stronger convergence) between maturational coupling and structural co-variance is anatomically heterogeneous (non-cortical areas are blacked out). Part a is modified, with permission, from REF. 38 © (2012) Elsevier. Part b is modified, with permission, from REF. 31 © (2012) Elsevier. Part c is modified, with permission, from REF. 32 © (2013) Society for Neuroscience.
Many regions that are directly connected through white matter tracts have been demonstrated to co-vary strongly in their morphology. For example, anterior and posterior language areas2, contralateral homologues in many areas of the cortex21 and the striatal–cortical–thalamic circuit33 all show convergent white matter connections and structural co-variance. Structural co-variance networks and white matter networks also have similar network properties: both consistently show non-random, clustered, efficient and modular properties. However, similar network properties are found in diverse social, physical and biological systems, so sharing these topological features does not prove the equivalence of the underlying networks. The only whole-brain study comparing white matter (diffusion imaging) connections with cortical thickness co-variance between regions on a pair-by-pair basis suggests that there is a substantial but incomplete overlap, with 30–40% of inter-regional co-variance occurring between regions that are connected by white matter tracts31 (FIG. 2b).
The pattern of inter-regional structural co-variance may be more akin to the pattern of functional connectivity than to that of physical white matter connections. This is not implausible, because although regions that are connected via white matter tracts are usually also functionally connected, strong functional connectivity can also arise in the absence of direct white matter connectivity34,35. Correlations between brain regions in intrinsic brain activity (which are measured using blood-oxygen-level-dependent (BOLD) functional MRI (fMRI) in a task-free setting) show striking overlap with population-based measurements of grey matter co-variance between those regions, at least for certain co-variance networks23,36–38 (FIG. 2a). As the first studies have only just begun to quantify the relationship between structural co-variance and functional connectivity across the entire brain32, the extent of this similarity currently remains provisional.
There are methodological hurdles in conclusively assessing the relationship between structural covariance and connectivity. Currently, the extraction of morphological features of interest from MRI scans remains imperfect (BOX 1). In addition, diffusion imaging methods have difficulty resolving crossing fibres, and many tracts are simply too small to be imaged at current scanning resolutions39. There are also unresolved methodological issues in measuring fMRI connectivity, as revealed by the recent concern over artefacts induced by in-scanner subject motion40. Technological improvements will allow increasingly accurate assessments of these relationships.
Coordinated neurodevelopment
The developmental significance of correlations between phenotypic traits, including the morphometry of anatomical structures, has been discussed in biological research outside neuroscience for many decades41–43: for example, regarding skeletal measurements of extinct pelycosaurian reptiles44, floral dimensions in botanical species45, human craniofacial anatomy46–48 and many other experimental contexts49. High phenotypic co-variance is generally interpreted as evidence of developmental coordination or integration, which occurs within modules with components that are subject to similar developmental processes; by contrast, the developmental processes that influence distinct modules are relatively autonomous, resulting in low correlations at the population level50–55.
Coordinated development may give rise to co-variance in various ways. Sharing a developmental precursor may result in co-variance between distinct parts of a mature organism56. Similarly, inductive signalling from one developing tissue to another or simultaneous exposure to signals from a third party may result in synchronized maturation and ultimately co-variation54,55,57. Shared genetic influences that are due to pleiotropy could underlie such coordinated development, as could correlational selection that is due to inter-related influences on adaptive fitness58–60. It has been demonstrated that anatomical co-variance is often linked to functional relationships: for example, covariance between bones that have the same muscular attachments61 or are involved in the mechanics of the same behaviour62–64. Coordinated development may also reflect inherited ancestral relationships between phenotypic traits, even if these traits no longer have a functional relationship53,65. Finally, common environmental factors may influence coordinated development and thus co-variance, with the relationship between genetic and environmental influences possibly varying on a case-by-case basis45,49.
These cross-disciplinary precedents suggest that structural co-variation between brain regions may result from coordinated neurodevelopment, and this hypothesis is indeed consistent with preliminary imaging studies. A longitudinal study has demonstrated overlap between pairs of regions whose local cortical volumes were correlated and pairs of regions whose rates of cortical change were correlated over a 5-year period66. In a set of studies that tracked over 100 subjects across adolescence with three or more longitudinal scans, areas that were structurally co-variant were also correlated in terms of the rate of change in cortical thickness during development32,67 (FIG. 2c). Both synchronized rates of change and cross-sectional structural co-variance appear to be maximal in the association cortex67. Although structural co-variance and fMRI functional connectivity (which was measured in a subset of the same subjects) showed a significant statistical relationship, brain-wide structural co-variance networks were more similar to networks of synchronized anatomical change32.
It is therefore probable that synchronized change during development underlies inter-regional structural co-variance. These developmental relationships are in turn influenced by direct white matter connections and functional co-activation and probably also by other genetic and environmental factors (see below). The basic idea that structural co-variance represents the outcome of a mutually trophic benefit to the co-varying regions over the course of their development echoes work on the incentives for relationships between pairs of people that lead to the formation of complex social networks68, suggesting that some of the principles of structural covariance network formation may be very general.
Genetics, cognition and behaviour
Genetics
Most of the variation in total brain size across human beings can be attributed to genetics69–71. Some striking examples are the single-gene disorders associated with specific alterations in brain structure and size72,73, and many of these same genes have functions in cell division and cellular development under normal circumstances74. In healthy individuals, it is possible that brain anatomy and general intelligence are influenced by the same genetic factors69,75. Exploiting the fact that fraternal twins have about one-half of the genetic similarity of identical twins but have shared environmental influences, twin analysis of single brain regions can quantify the extent to which genetic factors underlie inter-individual anatomical differences. Such analyses have shown that the influence of genetic factors varies across the brain, with some gyri demonstrating proportionally greater heritability than others76.
Although the genetic contributions to brain morphology could theoretically be driven by distinct genes operating on different brain areas, evidence suggests that genetic influences are themselves correlated. For example, there is preliminary evidence that structural co-variance between the amygdala and the anterior cingulate can vary depending on the presence of a polymorphism in the gene for a serotonin transporter77. Twin studies have been used to identify correlation patterns between regions that are specifically due to shared genetic influences: strongly positive, genetically driven correlations appear to exist across much of the brain, with shared genetic influences accounting for a large portion of the co-variance measured in human populations76,78,79.
However, these genetic correlations between brain regions are not all equal. Like brain networks derived from white matter connectivity or functional connectivity between brain regions, the network of genetically driven structural co-variance follows ‘small-world’ organizational principles76. Different genetic factors influence patterns of structural co-variance most strongly within different brain networks79–82; that is, there seem to be network-specific genetic influences. For example, regions that have strong genetic relationships with the anterior temporal cortex appear to be genetically unrelated to the primary visual cortex (and vice versa)81. Structural co-variance within the frontal–parietal network is particularly strongly determined by genetic factors76,80,81; frontal and temporal association areas, whose morphology is under relatively strong genetic control83, also show among the highest genetically driven correlations with the rest of the cortex78. Correlations between homologous contralateral regions appear to have stronger genetic underpinnings, both in the subcortex16 and cortex78, than do ipsilateral correlations.
Cognition, behaviour and plasticity
There is an extensive literature relating the morphology of individual brain regions or systems, including cortical thickness, grey matter density, volume and surface area, to performance on neuropsychological tasks. For example, the size of the amygdala varies with performance in memory tasks84, social phobia85 and also the size of one’s social network86. Morphological properties of diverse prefrontal regions are associated with performance in attentional and regulatory tasks87–89, parietal and primary sensory regions have been linked to spatial and perceptual abilities90,91 and intelligence has been associated with widespread variation in thickness across the cortical mantel75,92,93. Grey matter densities in the hippocampus and the caudate are correlated with different strategies used by subjects in a virtual navigation task, and these regions are negatively correlated with each other across the population5. Much if not all of the ‘unexplained’ variance in morphological properties across people is probably associated with behavioural and cognitive differences. Moreover, brain regions that co-vary with the same behavioural or cognitive variables could, in their accumulation, explain a substantial proportion of interregional co-variance patterns.
Indeed, behavioural and cognitive abilities are associated not only with regional morphometric properties but also with co-variance between regions. For example, people with a higher IQ have stronger correlations between the inferior frontal gyrus and thickness of other frontal and parietal brain areas than people with a lower IQ2. Musicians represent a particularly valuable ‘natural experiment’ of highly trained, skilled individuals who demonstrate alterations in their patterns of structural co-variance. For instance, trained pianists have reduced morphometric correlations between left and right sensorimotor areas compared with non-musicians, which may be related to bimanual coordination94. Musicians also have more localized (less diffuse) correlations between frontal and auditory cortical regions, possibly indicating an increased specificity of anatomical relationships95, and musicians with absolute pitch have particularly strong short-distance correlations between different cortical areas that are known to underlie language and auditory functions96.
The relationships between structural co-variance and behavioural or cognitive abilities could in theory be purely genetically mediated, but learning and training have been shown to alter brain morphology even in controlled experiments. A well-known series of studies showed that expert taxi drivers have larger hippocampal volumes that are proportional to their job experience97,98, even relative to bus drivers, who have more routinized spatial knowledge99. Musical training alters brain anatomy in an array of motor, language and auditory areas100–102 after as little as ~1 year of musical training in early childhood103. Individuals who learn to read for the first time have alterations in grey matter density in language areas compared with illiterate control subjects104,105, and learning to juggle over a period of months or even days is associated with thickening of movement-associated visual and posterior parietal cortex106,107. Clearly, experience and training can alter morphological properties of individual brain regions and probably also patterns of co-variance between regions, although the latter has not yet been directly shown.
Structural co-variance across the lifespan
Childhood and adolescence
Regional and global brain anatomy undergo profound alterations during childhood and adolescence. Total brain volume more than doubles from birth to the age of 2 years, at which point it is already 80–90% of adult size108. MRI data indicate decreases in total grey matter and increases in white matter through to the twentieth year of life, which are generally attributed to a combination of synaptic pruning and myelination (which, in the prefrontal cortex, is not completed until after the third decade of life)109. There is considerable regional heterogeneity in developmental change. From birth to young adulthood (18–24 years of age), the expansion of the lateral temporal, parietal and frontal cortices is almost double that of primary visual and medial temporal regions110. The developmental trajectories of thickness and surface area also vary across the cortical mantel, usually peaking before the age of 10 years and declining at varying rates during adolescence111–114.
During this period of major regional changes in neuroanatomy, the adult pattern of inter-regional correlations emerges. This maturation of brain structural co-variance involves a mixture of linear and non-linear alterations with age. In a study that tracked the growth trajectories of various seed-based networks in four age groups across childhood and adolescence, the youngest children generally showed the sparsest structural co-variance patterns, and these were limited to neighbouring areas and their contralateral homologues. Two alternative trajectories subsequently emerged: some networks showed progressive linear expansion across the age range, whereas others peaked in expansion in a middle age group (11–15-year-olds) before contracting in later adolescence6.
Such differences in maturational trajectories may reflect functional distinctions between brain systems. The co-variance networks that tended to expand linearly across childhood and adolescence included anatomical areas of the brain that are known to subserve attention, cognition and language functions (which is consistent with previous evidence for tighter correlations between anterior and posterior language areas in young adults relative to a paediatric sample2); by contrast, primary sensory and motor areas tended to be included in networks that followed the alternative trajectory of early expansion and contraction6 (FIG. 3a), suggesting that they develop earlier in terms of their structural co-variance with the rest of the brain, as compared with more protracted development in association and limbic areas6,115.
Figure 3. Structural co-variance networks change across the human lifespan.

a | In 5–18-year-olds, certain seed-based grey matter co-variance networks, such as the primary auditory network (top, coloured areas) seeded from right Heschl’s gyrus, peak during adolescence (in 12–14-year-olds) in terms of the total number of voxels, ipsilateral voxels and contralateral voxels that are correlated with the seed voxels. Other co-variance networks, such as the semantic language network (bottom) seeded from the left temporal pole, grow across the age range in terms of the number of other voxels correlated with the seed voxels. These different maturational trajectories may have functional significance, as primary sensory networks tend to peak in the number of voxels correlated with the seed voxels during adolescence, whereas many cognitive and language networks grow in the number of voxels correlated with the seed voxels through the eighteenth year of life. b | Correlations within the semantic language network and several other networks that tend to grow in strength from 5 to 18 years of age show a reversal in later years. For example, structural co-variance between the left lingual gyrus and the seed voxel of the semantic language network in the left temporal pole is positive in younger adults (18–24-year-olds) but not in older adults (60–84-year-olds). Part a is modified, with permission, from REF. 6 © (2010) National Academy of Sciences. Part b is modified, with permission, from REF. 128 © (2012) Elsevier.
Global network properties become established early in life, and the tension between segregation and integration is reflected in alterations across the lifespan. It is striking that even in neonates, weeks after birth, structural co-variance demonstrates the small-world hybrid of network efficiency and local clustering116, suggesting that these properties may in fact develop in utero. Infants also already display modular patterns consisting of communities of brain regions with relatively strong within-community structural co-variance. Subsequently, modularity, local efficiency and global efficiency all increase during the first 2 years of life, after which these network properties appear to exist at or near young adult levels116. Maturation between the ages of 5 and 18 years appears to be largely non-linear in nature, with a substantial but transient shift towards greater integration and less local segregation in late childhood115.
Healthy ageing
Ageing has long been associated with regional reductions in cortical grey matter, particularly in medial temporal and prefrontal areas of the brain. These anatomical changes have been linked to neurocognitive alterations, as shown by performance in memory and attention tasks117–120. Disruptions of white matter integrity measured with diffusion MRI suggest that the relationships between widespread brain regions may also be affected by ageing121,122, plausibly affecting structural co-variance patterns measured across the population.
Indeed, grey matter reductions in healthy ageing occur in brain areas with high inter-regional correlations in morphology, including in memory, cognition and language networks. Experimental methods based on principal component analysis (BOX 2), which reduce information about inter-subject co-variance into specific age-related patterns, have found correlated patterns of atrophy within frontal–temporal networks and within subcortical networks123–126. Initial analyses revealed particular patterns of correlated atrophy (‘components’) that were subsequently also found in other samples123,126— an example of successful experimental replication of brain imaging findings. The functional significance of age-related changes in structural co-variance networks is supported by their links with neuropsychological performance, as the strength of these brain-wide co-variance patterns is correlated with individuals’ scores on memory, attention and cognitive tests123,127 (even in healthy young subjects127).
The alterations in structural co-variance networks in the second half of life reverse-mirror some of the trends of childhood and adolescence (FIG. 3). Reduced structural co-variance has been found in ageing (60–84 years of age) relative to younger (18–35 years of age) adults in those cognitive and language networks128 within which co-variance tends to strengthen with age during childhood and adolescence6. By contrast, co-variance in sensorimotor networks peaks early in childhood6 but does not appear to differ between young and old adults128. In terms of global organization, the integrative properties of structural co-variance networks, as quantified by the global efficiency, strengthen from young to middle-aged adults, with parallel weakening of segregative properties129. In adults over the age of 60 years, however, these changes are partially reversed, so that the balance shifts to a more localized organization129,130. The modular covariance structure that is established early in life may also be altered in subjects over the age of 60 years129,131, for example, with fewer network edges involving prefrontal regions that comprise an ‘executive function’ module in young adults131.
Structural co-variance in brain disorders
Neurodegenerative disorders
The neuronal loss that is characteristic of neurodegenerative diseases is detectable by structural MRI in the form of decreased grey matter density and thinning of the cortical surface in affected brain regions: for example, the medial temporal lobes in Alzheimer’s disease. These regional morphological changes show potential as early predictors of disease-onset and prognosis, but theories of degenerative disease increasingly focus on brain networks as opposed to individual regions. For example, atrophy in Alzheimer’s disease may target regions of the default-mode network — a group of anatomical areas that are characterized by their relatively strong intrinsic activity when the brain is in a ‘default’ state132 — because these regions may be vulnerable owing to their high metabolic load133. Alternatively, pathogenic molecules may spread (and induce atrophy) via synaptic connections analogously to prion disease134,135. In contrast to anatomical studies of specific brain areas, imaging the correlation structure between regions has the potential to reveal the pathology of Alzheimer’s disease at the network level.
In fact, studies assessing such correlations have argued that neurodegenerative diseases target regions that, in healthy individuals, are particularly highly structurally correlated36, and inter-regional correlation patterns in patient populations are also altered compared with interregional correlation patterns in healthy populations136. For example, patterns of grey matter loss in five types of dementia, including Alzheimer’s disease, overlap with distinct networks of brain regions whose grey matter volumes strongly co-vary in the healthy population — networks that closely match patterns of intrinsic functional connectivity and are involved in the behavioural and cognitive functions affected by these diseases36 (FIG. 4a). Even in the healthy ageing population, regional brain atrophy is linked to the deposition of the Alzheimer’s disease-related protein amyloid-β, and the focus of this amyloid-related atrophy is part of a structural co-variance network that is associated with cognitive functioning137. Similar patterns of grey matter loss within networks of brain regions with high structural correlations can also be distinguished in cognitively normal young adults who are genetically at risk of developing Alzheimer’s disease138. The fact that atrophy occurs within structural co-variance networks both highlights their functional significance in healthy individuals and supports network interpretations of neurodegenerative disease.
Figure 4. Structural co-variance networks are altered in disease.

a | Seed-based structural co-variance networks (green) and intrinsic functional connectivity networks (yellow) in healthy individuals, using, as seed regions, the foci of grey matter loss in different samples of patients with five neurodegenerative diseases (blue). These include the right angular gyrus (R ANG) in Alzheimer’s disease (AD); right frontal insula (R FI) in behavioural variant frontotemporal dementia (bvFTD); left temporal pole (L TPO) in semantic dementia (SD); left inferior frontal gyrus (L IFG) in progressive non-fluent aphasia (PNFA); and the right premotor cortex (R PMC) in corticobasal syndrome (CBS). The pattern of grey matter loss in patients recapitulates the patterns of structural co-variance and functional MRI functional connectivity in healthy individuals. This suggests that these diseases may target structural co-variance networks and that these structural co-variance networks are also functionally significant in the healthy brain. b | Structural co-variance alterations in AD. The brain map (left) shows specific regions whose structural correlations are higher (red lines) or lower (blue lines) in patients with AD compared with control subjects. These regions include the paracentral lobule (PCL), superior parietal gyrus (SPG), posterior cingulate gyrus (PCG), anterior cingulate gyrus (ACG), olfactory cortex (OLF), inferior orbital cortex (ORBinf), superior medial orbital cortex (ORBsupmed), fusiform gyrus (FFG), parahippocampal gyrus (PHG), superior temporal pole (TPOsup) and middle temporal pole (TPOmid). At the network level (right), the AD network shows abnormally high clustering, indicating greater local agglomeration of connected nodes. c | Structural co-variance alterations in schizophrenia. The brain map (left) illustrates specific regions in which structural correlations are higher (red lines) or lower (blue lines) in patients with schizophrenia compared with control subjects. These regions include the postcentral cortex (PoC); supramarginal cortex (SM); inferior frontal cortex, orbital part (IFor); inferior frontal cortex, opercular part (IFop); caudal anterior cingulate (CAC); pallidum (Pal); and thalamus (Tha). At the network level (right), the average distance between connected nodes is longer in schizophrenia, suggesting that pairs of regions with the strongest structural co-variance are less close to each other in the patient group. Results are shown across a range of network ‘density’, which indicates the proportion of the strongest pairwise correlations included as edges in the graph models. Part a is modified, with permission, from REF. 36 © (2009) Cell Press. Part b (left) is modified from REF. 139. Part b (right) is modified, with permission, from REF. 136 © (2008) Society for Neuroscience. Part c (left) is modified, with permission, from REF. 157 © (2012) Elsevier. Part c (right) is modified, with permission, from REF. 22 © (2008) Society for Neuroscience.
In addition to neurodegeneration in Alzheimer’s disease coinciding with structural co-variance networks, patterns of structural co-variance themselves are altered by Alzheimer’s disease in various ways. The Alzheimer’s disease population shows decreased structural co-variance between certain regions compared with the healthy population — especially in long-distance and interhemispheric correlations — and increased correlations between some brain areas targeted by the disease136,139,140 (FIG. 4b). It is probable that there is more than one cause for these alterations, and disease-related changes in structural co-variance can be difficult to interpret. Attenuated correlations between brain regions may be suggestive of disconnectivity or of localized degeneration, if this degeneration affects just one region of a co-variance network. By contrast, strengthened correlations may indicate overconnectivity or correlated grey matter loss in regions targeted by the same neurodegenerative process. Although neither increased nor decreased pairwise correlations would necessarily influence the global organizational properties of structural co-variance, these properties also appear to be altered in Alzheimer’s disease in the form of heightened local clustering and inefficient paths between brain regions136,139. This suggests that, in patients with Alzheimer’s disease, the whole-brain network is more segregated and less integrated compared with that in healthy individuals.
Schizophrenia
Neurobiological research on schizophrenia used to focus on single brain regions, such as parts of the dorsolateral prefrontal cortex, that were thought to somehow ‘contain’ the cognitive and emotional functions disrupted by the disease. The focus has since shifted to the interactions between specific brain areas and, more recently, to the possibility of a global pathology affecting connections across the brain. Indeed, schizophrenia has come to be regarded more and more as a disease of disconnectivity. Discoveries about patterns of structural co-variance in schizophrenia17,22,141–160 complement studies that show disrupted white matter tracts161,162 and functional connectivity163–165 between brain regions in the disease.
Patients with schizophrenia show abnormalities in frontal–temporal and frontal–parietal correlations as well as in many other inter-regional correlations, as discussed below. Frontal–temporal correlations are of particular interest in schizophrenia because of the possibility that auditory hallucinations, which is one of the most common symptoms of the disease, could result from a disturbance in the relationship between auditory areas in the temporal cortex and higher cognitive areas in the dorsolateral prefrontal cortex. Indeed, there is evidence for a link between the strength of frontal–temporal co-variance and auditory hallucinations142, and early case–control studies found positive frontal–temporal correlations in the regional morphology of patients with schizophrenia that were absent from controls143–146. Subsequent larger studies have generally confirmed alterations in frontal–temporal correlations in schizophrenia147–151. The increased correlations in patients may indicate coordinated grey matter loss during neurodevelopment; indeed, frontal and temporal brain areas also show cortical thinning in schizophrenia113, possibly due to overpruning of synapses during adolescence166,167.
If altered frontal–temporal correlations are related to auditory hallucinations, then impaired cognitive ability — one of the most devastating symptoms of schizophrenia — may have its roots in other abnormal anatomical associations. The strength of cortico–thalamic141 and frontal–parietal correlations152 is associated with performance by patients on recall and working memory tasks, respectively, suggesting a link to cognitive symptoms. In case–control studies, correlations between the volumes of inferior parietal lobe and prefrontal cortical regions were increased in people with schizophrenia152–154 and in genetically at-risk non-psychotic individuals155 compared with healthy controls. Thalamo–cortical correlations are also altered in patients with schizophrenia17,141,156,157, predominantly in the form of attenuated correlations17,141,157. There are some inconsistencies between brain imaging studies of schizophrenia, which are perhaps due to heterogeneity in the patient population and the potential anatomical effects of different treatment regimens. Almost every region of the brain has been reported to be involved in altered patterns of structural co-variance in one or more case–control study of schizophrenia.
It is possible that specific alterations in inter-regional correlations reflect specific aspects of the constellation of symptoms of schizophrenia, but the widespread nature of these alterations may also indicate a kind of systemic alteration in the pattern of structural co-variance (FIG. 4c). Graph theoretical studies suggest that brain organizational principles may be disrupted in people with schizophrenia22,157,158 and in genetically at-risk neonates159. Specifically, structural co-variance networks show increased clustering and longer paths between brain regions157–159 in terms of both the physical distance between strongly correlated regions22,158,159 and the topological network efficiency157–159. The increased physical distance between strongly correlated brain regions is also supported by relatively increased inter-lobar and weakened intra-lobar correlations in patients150,151. In addition, it is mirrored by recent findings about functional connectivity networks in schizophrenia, which showed a focused weakening of functional connectivity over short distances and a relatively greater prominence of long-distant connections11. The identity of the nodes that are central to the network also appears to be altered in schizophrenia, with a shift away from the frontal and/or multimodal cortex towards the primary sensory and/or paralimbic cortex in the patient population22,157,158.
Other conditions
Although Alzheimer’s disease and schizophrenia have been the focus of a large portion of the research on structural co-variance, other neurological and psychiatric diseases are no less amenable to these methodological approaches. Studies in a wider range of patient populations are necessary to determine whether any changes in structural correlations between brain areas are disease-specific, or whether disruptions to the normative structure of correlations tend to have similar consequences across diseases. This research is at a preliminary stage, but pathological structural co-variance has been demonstrated in epilepsy, autism and various other conditions.
The hypersynchronized electrical activity that underlies epileptic seizures could alter structural co-variance patterns or reflect connectivity-related vulnerabilities that are observable at the level of population-wide correlations between regions. Patterns of atrophy in temporal lobe epilepsy, the most common drug-resistant epilepsy in adults, recapitulate patterns of structural co-variance and known white matter connections in healthy individuals168, a convergence similar to that observed in age-related neurodegenerative disease. It has been reported that the strength of positive inter-regional correlations is increased on average in temporal lobe epilepsy169. In addition, graph theoretical analysis of structural co-variance networks reveals decreased efficiency, increased clustering and an altered distribution of network hubs169. Longitudinal analysis suggests that network alterations become more apparent over time in the same group of patients169, indicating that inter-regional neuronal synchronization may progressively alter structural covariance networks.
Because the onset of autism occurs before the age of 3 years during a critical period of brain development that includes the maturation of structural co-variance, it is unsurprising that inter-regional correlations found in healthy individuals may be disrupted in autism. Parts of the brain related to social cognition and behaviours that are abnormal in people with autism and other autism spectrum disorders may be particularly targeted. For example, one study showed that the structural covariance between the fusiform gyrus and the amygdala is decreased in autism spectrum disorders170, which could relate to deficits in face processing, especially in social contexts. There appears to be a widespread disruption of positive inter-regional volume correlations in children with autism, particularly in brain regions that subserve social function171. This disruption could reflect an early developmental insult that prevents coordinated brain maturation of social cognition networks.
Various other disorders show altered patterns of structural co-variance, including but not limited to multiple sclerosis, chronic pain syndromes and mood disorders. Cortical thickness networks in multiple sclerosis are altered in proportion to the extent of white matter lesions172. Patients with chronic pain syndromes show altered spatial properties of structural co-variance, with a disruption of the inverse relationship between correlation strength and anatomical distance between brain regions that exists in healthy individuals173. Carriers of a 5-HTTLPR polymorphism that has been associated with increased risk of depression have decreased correlations between the amygdala and anterior cingulate cortex77. In addition, there is preliminary evidence for structural co-variance alterations in bipolar disorder174, Turner syndrome (usually associated with chromosome X monosomy)175, cancer survivors with chemotherapy-related cognitive impairment176, adolescents who had severely pre-term births177 and grapheme–colour synaesthesia178.
The variety of these conditions underscores the sensitivity of normative structural co-variance patterns to a range of developmental, genetic and environmental factors. However, it is difficult to interpret disease-related changes in structural co-variance, as we currently lack a clear understanding of the cellular and molecular mechanisms that normally drive the emergence of large-scale structural co-variance networks and their development during the life course.
Conclusions and future directions
Ongoing brain imaging research in animals should help to clarify the mechanisms underlying structural covariance and thereby contribute towards increasing the clinical utility of structural MRI for patients with neurological and psychiatric diseases and the capacity to test network hypotheses about disease mechanisms. When combined with the kind of controlled genetics and invasive experiments that are not possible in human subjects, animal brain imaging studies have the potential to yield a molecular and cellular understanding of inter-regional correlations in morphology179–183. Although few animal imaging studies to date have looked explicitly at covariance structure180–182, the feasibility of such research has been demonstrated in non-human primates and in rodents. For example, a study of ageing rhesus macaques found inter-regionally correlated changes in grey matter volume with age that predicted working memory performance182, which is consistent with studies of ageing in humans124,125. In addition, mice trained in different spatial navigation tasks showed task-specific alterations in grey matter density183 that echo differences in human populations5. These alterations in grey matter density correlated with immunohistochemical markers of neuronal remodelling but not with variation in the size or number of neurons or astrocytes183, suggesting the hypothesis that over time, synaptic changes can generate inter-regional structural correlations. In the future, animal models can be used to directly test such hypotheses.
Perhaps the holy grail of brain imaging is to increase its clinical utility for complex brain disorders such as schizophrenia and Alzheimer’s disease. Classification studies have attempted to find MRI signatures that are associated with particular diseases or outcomes and that could be useful in diagnosis or treatment planning. Here, the inter-dependence of the anatomy of brain regions is both a hurdle (because many classification techniques are optimized for datasets of independent features) and an opportunity (because deviations from expected co-variance patterns provide additional information), and successful preliminary studies have explicitly or implicitly incorporated brain co-variance structure into their predictive models184–186. The complex mixture of developmental, genetic and environmental factors that influence anatomical structure and inter-regional dependence even in healthy individuals may be one reason why the clinical utility of MRI in psychiatry has yet to meet expectations. As the mechanisms of structural co-variance become better understood, and methods for measuring deviations from expectations in single scans become more securely validated, MRI data on structural co-variance in an individual patient could yield more useful information for clinicians.
The phenomenon of structural co-variance allows the exploration of network hypotheses about disease mechanisms. For example, patterns of atrophy in neurodegenerative disease appear to be consistent with the transneuronal spread of pathology through white matter tracts135 and functional connectivity networks134 that were previously shown to closely match structural co-variance networks in the same patient populations36. The importance of more research into functional connectivity and diffusion imaging is widely acknowledged. However, studies that explicitly target brain connectomics can be prohibitively expensive, whereas structural MRI scans that are acquired for clinical purposes as part of many large studies often remain unanalysed. The application of network analysis to inter-regional co-variance patterns in existing datasets is a relatively untapped resource and could provide a window into the developmental relationships between different parts of the human brain.
Acknowledgements
The Child Psychiatry Branch, US National Institute of Mental Health, is supported by the US National Institutes of Health (NIH) Intramural Research Program. The Behavioural and Clinical Neuroscience Institute, University of Cambridge, is supported by the Wellcome Trust and the Medical Research Council (UK). A.A.-B. is supported by the NIH-Oxford-Cambridge Scholarship Program, the NIH MD/PhD Partnership Program and the UCLA Caltech Medical Scientist Training Program.
Abbreviations
- Correlation
When two sets of data are statistically inter-dependent or mutually predictive.
- Topology
The pattern of connections or relations between nodes within a network.
- Segregation
The existence, in the brain, of relatively distinct anatomical, physiological or functional units.
- Modularity
The concept that a network has a community structure and can be decomposed into a set of modules, with each module comprising nodes (brain regions) that are densely connected to each other and sparsely connected to nodes in other modules.
- Integration
The capacity of the brain to act as single, unified entity.
- Hubs
Topologically important or central nodes.
- Efficiency
A measure that is inversely proportional to the lengths of the shortest paths between nodes. In brain networks, the global efficiency is often used as a measure of the overall capacity for parallel information transfer and integrated processing.
- Pleiotropy
When a single gene influences many phenotypic traits.
Footnotes
Competing interests statement
E.B. declares competing financial interests. See Web version for details. The other authors declare no competing financial interests.
FURTHER INFORMATION
Aaron Alexander-Bloch’s homepage: http://community.frontiersin.org/people/Alexander-BlochAaron/13470
ALL LINKS ARE ACTIVE IN THE ONLINE PDF
References
- 1.Kennedy DN, et al. Gyri of the human neocortex: an MRI-based analysis of volume and variance. Cereb. Cortex. 1998;8:372–384. doi: 10.1093/cercor/8.4.372. [DOI] [PubMed] [Google Scholar]
- 2. Lerch JP, et al. Mapping anatomical correlations across cerebral cortex (MACACC) using cortical thickness from MRI. Neuroimage. 2006;31:993–1003. doi: 10.1016/j.neuroimage.2006.01.042. This is the first study to look at the co-variance of thickness across the cortex and the development of structural co-variance during childhood and adolescence, introducing several key methodological approaches.
- 3. Andrews TJ, Halpern SD, Purves D. Correlated size variations in human visual cortex, lateral geniculate nucleus, and optic tract. J. Neurosci. 1997;17:2859–2868. doi: 10.1523/JNEUROSCI.17-08-02859.1997. A post-mortem anatomical study showing correlations between the sizes of different areas of the visual system.
- 4.White LE, et al. Structure of the human sensorimotor system. II: Lateral symmetry. Cereb. Cortex. 1997;7:31–47. doi: 10.1093/cercor/7.1.31. [DOI] [PubMed] [Google Scholar]
- 5.Bohbot VD, Lerch J, Thorndycraft B, Iaria G, Zijdenbos AP. Gray matter differences correlate with spontaneous strategies in a human virtual navigation task. J. Neurosci. 2007;27:10078–10083. doi: 10.1523/JNEUROSCI.1763-07.2007. [DOI] [PMC free article] [PubMed] [Google Scholar]
- 6. Zielinski BA, Gennatas ED, Zhou J, Seeley WW. Network-level structural covariance in the developing brain. Proc. Natl Acad. Sci. USA. 2010;107:18191–18196. doi: 10.1073/pnas.1003109107. This paper tracks the development of seed-based structural co-variance networks from 5 to18 years of age.
- 7.Kaiser M, Hilgetag CC, van Ooyen A. A simple rule for axon outgrowth and synaptic competition generates realistic connection lengths and filling fractions. Cereb. Cortex. 2009;19:3001–3010. doi: 10.1093/cercor/bhp071. [DOI] [PubMed] [Google Scholar]
- 8.Kaiser M, Hilgetag CC. Nonoptimal component placement, but short processing paths, due to long-distance projections in neural systems. PLoS Comput. Biol. 2006;2:e95. doi: 10.1371/journal.pcbi.0020095. [DOI] [PMC free article] [PubMed] [Google Scholar]
- 9.Honey CJ, et al. Predicting human resting-state functional connectivity from structural connectivity. Proc. Natl Acad. Sci. USA. 2009;106:2035–2040. doi: 10.1073/pnas.0811168106. [DOI] [PMC free article] [PubMed] [Google Scholar]
- 10.Salvador R, Suckling J, Schwarzbauer C, Bullmore E. Undirected graphs of frequency-dependent functional connectivity in whole brain networks. Phil. Trans. R. Soc. B. 2005;360:937–946. doi: 10.1098/rstb.2005.1645. [DOI] [PMC free article] [PubMed] [Google Scholar]
- 11.Alexander-Bloch AF, et al. The anatomical distance of functional connections predicts brain network topology in health and schizophrenia. Cereb. Cortex. 2013;23:127–138. doi: 10.1093/cercor/bhr388. [DOI] [PMC free article] [PubMed] [Google Scholar]
- 12. He Y, Chen ZJ, Evans AC. Small-world anatomical networks in the human brain revealed by cortical thickness from MRI. Cereb. Cortex. 2007;17:2407–2419. doi: 10.1093/cercor/bhl149. This is the first graph analytic study of brain-wide structural co-variance, showing similar network properties to functional and white matter networks.
- 13.Chen ZJ, He Y, Rosa-Neto P, Germann J, Evans AC. Revealing modular architecture of human brain structural networks by using cortical thickness from MRI. Cereb. Cortex. 2008;18:2374–2381. doi: 10.1093/cercor/bhn003. [DOI] [PMC free article] [PubMed] [Google Scholar]
- 14.Vértes PE, et al. Simple models of human brain functional networks. Proc. Natl Acad. Sci. USA. 2012;109:5868–5873. doi: 10.1073/pnas.1111738109. [DOI] [PMC free article] [PubMed] [Google Scholar]
- 15.Bullmore E, Sporns O. The economy of brain network organization. Nature Rev. Neurosci. 2012;13:336–349. doi: 10.1038/nrn3214. [DOI] [PubMed] [Google Scholar]
- 16.Eyler LT, et al. Genetic patterns of correlation among subcortical volumes in humans: results from a magnetic resonance imaging twin study. Hum. Brain Mapp. 2011;32:641–653. doi: 10.1002/hbm.21054. [DOI] [PMC free article] [PubMed] [Google Scholar]
- 17.Mitelman SA, et al. Correlations between MRI-assessed volumes of the thalamus and cortical Brodmann’s areas in schizophrenia. Schizophr. Res. 2005;75:265–281. doi: 10.1016/j.schres.2004.10.014. [DOI] [PubMed] [Google Scholar]
- 18.Mitelman SA, et al. Metabolic thalamocortical correlations during a verbal learning task and their comparison with correlations among regional volumes. Brain Res. 2006;1114:125–137. doi: 10.1016/j.brainres.2006.07.043. [DOI] [PubMed] [Google Scholar]
- 19.Soriano-Mas C, et al. Structural covariance of the neostriatum with regional gray matter volumes. Brain Struct. Funct. 2012 May 11; doi: 10.1007/s00429-012-0422-5. [DOI] [PubMed] [Google Scholar]
- 20.Herbert MR, et al. Dissociations of cerebral cortex, subcortical and cerebral white matter volumes in autistic boys. Brain. 2003;126:1182–1192. doi: 10.1093/brain/awg110. [DOI] [PubMed] [Google Scholar]
- 21. Mechelli A, Friston KJ, Frackowiak RS, Price CJ. Structural covariance in the human cortex. J. Neurosci. 2005;25:8303–8310. doi: 10.1523/JNEUROSCI.0357-05.2005. This is one of the first comprehensive studies of grey matter co-variance between regions across the brain in healthy individuals.
- 22. Bassett DS, et al. Hierarchical organization of human cortical networks in health and schizophrenia. J. Neurosci. 2008;28:9239–9248. doi: 10.1523/JNEUROSCI.1929-08.2008. This is a study of structural co-variance network alterations in schizophrenia, which also explains permutation testing for comparisons between groups.
- 23.Segall JM, et al. Correspondence between structure and function in the human brain at rest. Front. Neuroinform. 2012;6:10. doi: 10.3389/fninf.2012.00010. [DOI] [PMC free article] [PubMed] [Google Scholar]
- 24.Allen JS, Damasio H, Grabowski TJ. Normal neuroanatomical variation in the human brain: an MRI-volumetric study. Am. J. Phys. Anthropol. 2002;118:341–358. doi: 10.1002/ajpa.10092. [DOI] [PubMed] [Google Scholar]
- 25.Achard S, Salvador R, Whitcher B, Suckling J, Bullmore E. A resilient, low-frequency, small-world human brain functional network with highly connected association cortical hubs. J. Neurosci. 2006;26:63–72. doi: 10.1523/JNEUROSCI.3874-05.2006. [DOI] [PMC free article] [PubMed] [Google Scholar]
- 26.van den Heuvel MP, Sporns O. Rich-club organization of the human connectome. J. Neurosci. 2011;31:15775–15786. doi: 10.1523/JNEUROSCI.3539-11.2011. [DOI] [PMC free article] [PubMed] [Google Scholar]
- 27.Burgoyne RD, Graham ME, Cambray-Deakin M. Neurotrophic effects of NMDA receptor activation on developing cerebellar granule cells. J. Neurocytol. 1993;22:689–695. doi: 10.1007/BF01181314. [DOI] [PubMed] [Google Scholar]
- 28.Bullmore ET, Frangou S, Murray RM. The dysplastic net hypothesis: an integration of developmental and dysconnectivity theories of schizophrenia. Schizophr. Res. 1997;28:143–156. doi: 10.1016/s0920-9964(97)00114-x. [DOI] [PubMed] [Google Scholar]
- 29.Katz LC, Shatz CJ. Synaptic activity and the construction of cortical circuits. Science. 1996;274:1133–1138. doi: 10.1126/science.274.5290.1133. [DOI] [PubMed] [Google Scholar]
- 30.Bi G, Poo M. Distributed synaptic modification in neural networks induced by patterned stimulation. Nature. 1999;401:792–796. doi: 10.1038/44573. [DOI] [PubMed] [Google Scholar]
- 31.Gong G, He Y, Chen ZJ, Evans AC. Convergence and divergence of thickness correlations with diffusion connections across the human cerebral cortex. Neuroimage. 2012;59:1239–1248. doi: 10.1016/j.neuroimage.2011.08.017. [DOI] [PubMed] [Google Scholar]
- 32. Alexander-Bloch AF, Raznahan A, Giedd J, Bullmore ET. The convergence of maturational change and structural covariance in human cortical networks. J. Neurosci. 2013;33:2889–2899. doi: 10.1523/JNEUROSCI.3554-12.2013. This paper compares structural co-variance networks with functional connectivity networks and with networks of synchronized anatomical change during adolescence.
- 33.Colibazzi T, et al. Latent volumetric structure of the human brain: exploratory factor analysis and structural equation modeling of gray matter volumes in healthy children and adults. Hum. Brain Mapp. 2008;29:1302–1312. doi: 10.1002/hbm.20466. [DOI] [PMC free article] [PubMed] [Google Scholar]
- 34.Honey CJ, Thivierge J-P, Sporns O. Can structure predict function in the human brain? Neuroimage. 2010;52:766–776. doi: 10.1016/j.neuroimage.2010.01.071. [DOI] [PubMed] [Google Scholar]
- 35.Adachi Y, et al. Functional connectivity between anatomically unconnected areas is shaped by collective network-level effects in the macaque cortex. Cereb. Cortex. 2012;22:1586–1592. doi: 10.1093/cercor/bhr234. [DOI] [PubMed] [Google Scholar]
- 36. Seeley WW, Crawford RK, Zhou J, Miller BL, Greicius MD. Neurodegenerative diseases target large-scale human brain networks. Neuron. 2009;62:42–52. doi: 10.1016/j.neuron.2009.03.024. The authors of this article argue that grey matter loss in neurodegenerative disease recapitulates structural co-variance and functional connectivity networks in healthy individuals.
- 37.Zhang Z, et al. Resting-state brain organization revealed by functional covariance networks. PLoS ONE. 2011;6:e28817. doi: 10.1371/journal.pone.0028817. [DOI] [PMC free article] [PubMed] [Google Scholar]
- 38.Kelly C, et al. A convergent functional architecture of the insula emerges across imaging modalities. Neuroimage. 2012;61:1129–1142. doi: 10.1016/j.neuroimage.2012.03.021. [DOI] [PMC free article] [PubMed] [Google Scholar]
- 39.Jones DK, Knösche TR, Turner R. White matter integrity, fiber count, and other fallacies: the do’s and don’ts of diffusion MRI. Neuroimage. 2013;73:239–254. doi: 10.1016/j.neuroimage.2012.06.081. [DOI] [PubMed] [Google Scholar]
- 40.Satterthwaite TD, et al. Impact of in-scanner head motion on multiple measures of functional connectivity: relevance for studies of neurodevelopment in youth. Neuroimage. 2012;60:623–632. doi: 10.1016/j.neuroimage.2011.12.063. [DOI] [PMC free article] [PubMed] [Google Scholar]
- 41.Olson EC, Miller RL. Morphological Integration. Univ. Chicago Press; 1958. [Google Scholar]
- 42.Berg RL. The ecological significance of correlation pleiades. Evolution. 1960;14:171–180. [Google Scholar]
- 43.Clausen J, Hiesey WM. The balance between coherence and variation in evolution. Proc. Natl Acad. Sci. USA. 1960;46:494–506. doi: 10.1073/pnas.46.4.494. [DOI] [PMC free article] [PubMed] [Google Scholar]
- 44.Gould SJ. Evolutionary patterns in Pelycosaurian reptiles: a factor-analytic study. Evolution. 1967;21:385–401. doi: 10.1111/j.1558-5646.1967.tb00166.x. [DOI] [PubMed] [Google Scholar]
- 45.Waitt DE, Levin DA. Genetic and phenotypic correlations in plants: a botanical test of Cheverud’s conjecture. Heredity. 1998;80:310–319. [Google Scholar]
- 46.Bastir M, Rosas A. Hierarchical nature of morphological integration and modularity in the human posterior face. Am. J. Phys. Anthropol. 2005;128:26–34. doi: 10.1002/ajpa.20191. [DOI] [PubMed] [Google Scholar]
- 47.Bastir M, Rosas A, O’higgins P. Craniofacial levels and the morphological maturation of the human skull. J. Anat. 2006;209:637–654. doi: 10.1111/j.1469-7580.2006.00644.x. [DOI] [PMC free article] [PubMed] [Google Scholar]
- 48.Bruner E. Cranial shape and size variation in human evolution: structural and functional perspectives. Childs Nerv. Syst. 2007;23:1357–1365. doi: 10.1007/s00381-007-0434-2. [DOI] [PubMed] [Google Scholar]
- 49.Cheverud JM. A comparison of genetic and phenotypic correlations. Evolution. 1988;42:958–968. doi: 10.1111/j.1558-5646.1988.tb02514.x. [DOI] [PubMed] [Google Scholar]
- 50.Magwene PM. New tools for studying integration and modularity. Evolution. 2001;55:1734–1745. doi: 10.1111/j.0014-3820.2001.tb00823.x. [DOI] [PubMed] [Google Scholar]
- 51.Pigliucci M. Phenotypic integration: studying the ecology and evolution of complex phenotypes. Ecol. Lett. 2003;6:265–272. [Google Scholar]
- 52.Klingenberg CP. In: Developmental Instability: Causes and Consequences. Polak M, editor. Oxford Univ. Press; 2003. pp. 427–442. [Google Scholar]
- 53.Breuker CJ, Debat V, Klingenberg CP. Functional evo-devo. Trends Ecol. Evol. 2006;21:488–492. doi: 10.1016/j.tree.2006.06.003. [DOI] [PubMed] [Google Scholar]
- 54.Klingenberg CP. Morphological integration and developmental modularity. Annu. Rev. Ecol. Evol. Syst. 2008;39:115–132. [Google Scholar]
- 55.Mitteroecker P, Gunz P, Neubauer S, Müller G. How to explore morphological integration in human evolution and development? Evol. Biol. 2012;39:536–553. [Google Scholar]
- 56.Riska B. Some models for development, growth, and morphometric correlation. Evolution. 1986;40:1303–1311. doi: 10.1111/j.1558-5646.1986.tb05753.x. [DOI] [PubMed] [Google Scholar]
- 57.Klingenberg CP. In: Variation: A Central Concept in Biology. Hallgrimsson B, Hall BK, editors. Elsevier; 2005. pp. 219–247. [Google Scholar]
- 58.Sinervo B, Svensson E. Correlational selection and the evolution of genomic architecture. Heredity. 2002;89:329–338. doi: 10.1038/sj.hdy.6800148. [DOI] [PubMed] [Google Scholar]
- 59.Walsh B, Blows MW. Abundant genetic variation + strong selection = multivariate genetic constraints: a geometric view of adaptation. Annu. Rev. Ecol. Evol. Syst. 2009;40:41–59. [Google Scholar]
- 60.Roff DA, Fairbairn DJ. A test of the hypothesis that correlational selection generates genetic correlations. Evolution. 2012;66:2953–2960. doi: 10.1111/j.1558-5646.2012.01656.x. [DOI] [PubMed] [Google Scholar]
- 61.Badyaev AV, Foresman KR, Young RL. Evolution of morphological integration: developmental accommodation of stress-induced variation. Am. Nat. 2005;166:382–395. doi: 10.1086/432559. [DOI] [PubMed] [Google Scholar]
- 62.Kingsolver JG, Huey RB. Introduction: the evolution of morphology, performance, and fitness. Integr. Comp. Biol. 2003;43:361–366. doi: 10.1093/icb/43.3.361. [DOI] [PubMed] [Google Scholar]
- 63.Arnold SJ. Performance surfaces and adaptive landscapes. Integr. Comp. Biol. 2003;43:367–375. doi: 10.1093/icb/43.3.367. [DOI] [PubMed] [Google Scholar]
- 64.Albertson RC, Streelman JT, Kocher TD, Yelick PC. Integration and evolution of the cichlid mandible: the molecular basis of alternate feeding strategies. Proc. Natl Acad. Sci. USA. 2005;102:16287–16292. doi: 10.1073/pnas.0506649102. [DOI] [PMC free article] [PubMed] [Google Scholar]
- 65.Kirschner M, Gerhart J. Evolvability. Proc. Natl Acad. Sci. USA. 1998;95:8420–8427. doi: 10.1073/pnas.95.15.8420. [DOI] [PMC free article] [PubMed] [Google Scholar]
- 66.Raz N, et al. Regional brain changes in aging healthy adults: general trends, individual differences and modifiers. Cereb. Cortex. 2005;15:1676–1689. doi: 10.1093/cercor/bhi044. [DOI] [PubMed] [Google Scholar]
- 67. Raznahan A, et al. Patterns of coordinated anatomical change in human cortical development: a longitudinal neuroimaging study of maturational coupling. Neuron. 2011;72:873–884. doi: 10.1016/j.neuron.2011.09.028. This article introduces the concept of maturational coupling between brain regions that grow together during childhood and adolescence.
- 68.Jackson MO. Social and Economic Networks. Princeton Univ. Press; 2010. [Google Scholar]
- 69.Pennington BF, et al. A twin MRI study of size variations in human brain. J. Cogn. Neurosci. 2000;12:223–232. doi: 10.1162/089892900561850. [DOI] [PubMed] [Google Scholar]
- 70.Baaré WF, et al. Quantitative genetic modeling of variation in human brain morphology. Cereb. Cortex. 2001;11:816–824. doi: 10.1093/cercor/11.9.816. [DOI] [PubMed] [Google Scholar]
- 71.Posthuma D, et al. Multivariate genetic analysis of brain structure in an extended twin design. Behav. Genet. 2000;30:311–319. doi: 10.1023/a:1026501501434. [DOI] [PubMed] [Google Scholar]
- 72.Gaitanis JN, Walsh CA. Genetics of disorders of cortical development. Neuroimaging Clin. N. Am. 2004;14:219–229. doi: 10.1016/j.nic.2004.03.007. [DOI] [PubMed] [Google Scholar]
- 73.Guerrini R, Marini C. Genetic malformations of cortical development. Exp. Brain Res. 2006;173:322–333. doi: 10.1007/s00221-006-0501-z. [DOI] [PubMed] [Google Scholar]
- 74.Chae TH, Walsh CA. In: Cortical Development: Genes and Genetic Abnormalities. Bock G, Goode J, editors. John Wiley & Sons; 2007. pp. 79–95. [Google Scholar]
- 75.Hulshoff Pol HE, et al. Genetic contributions to human brain morphology and intelligence. J. Neurosci. 2006;26:10235–10242. doi: 10.1523/JNEUROSCI.1312-06.2006. [DOI] [PMC free article] [PubMed] [Google Scholar]
- 76. Schmitt JE, et al. Identification of genetically mediated cortical networks: a multivariate study of pediatric twins and siblings. Cereb. Cortex. 2008;18:1737–1747. doi: 10.1093/cercor/bhm211. This paper demonstrates genetic influences on structural co-variance networks using structural equation modelling.
- 77.Pezawas L, et al. 5-HTTLPR polymorphism impacts human cingulate–amygdala interactions: a genetic susceptibility mechanism for depression. Nature Neurosci. 2005;8:828–834. doi: 10.1038/nn1463. [DOI] [PubMed] [Google Scholar]
- 78.Schmitt JE, et al. Variance decomposition of MRI-based covariance maps using genetically informative samples and structural equation modeling. Neuroimage. 2009;47:56–64. doi: 10.1016/j.neuroimage.2008.06.039. [DOI] [PMC free article] [PubMed] [Google Scholar]
- 79.Schmitt JE, et al. A twin study of intracerebral volumetric relationships. Behav. Genet. 2010;40:114–124. doi: 10.1007/s10519-010-9332-6. [DOI] [PMC free article] [PubMed] [Google Scholar]
- 80.Wright IC, Sham P, Murray RM, Weinberger DR, Bullmore ET. Genetic contributions to regional variability in human brain structure: methods and preliminary results. Neuroimage. 2002;17:256–271. doi: 10.1006/nimg.2002.1163. [DOI] [PubMed] [Google Scholar]
- 81.Rimol LM, et al. Cortical thickness is influenced by regionally specific genetic factors. Biol. Psychiatry. 2010;67:493–499. doi: 10.1016/j.biopsych.2009.09.032. [DOI] [PMC free article] [PubMed] [Google Scholar]
- 82.Chen C-H, et al. Hierarchical genetic organization of human cortical surface area. Science. 2012;335:1634–1636. doi: 10.1126/science.1215330. [DOI] [PMC free article] [PubMed] [Google Scholar]
- 83.Thompson PM, Cannon TD, Narr KL. Genetic influences on brain structure. Nature Neurosci. 2001;4:1253–1258. doi: 10.1038/nn758. [DOI] [PubMed] [Google Scholar]
- 84.Weniger G, Lange C, Irle E. Abnormal size of the amygdala predicts impaired emotional memory in major depressive disorder. J. Affect. Disord. 2006;94:219–229. doi: 10.1016/j.jad.2006.04.017. [DOI] [PubMed] [Google Scholar]
- 85.Irle E, et al. Reduced amygdalar and hippocampal size in adults with generalized social phobia. J. Psychiatry Neurosci. 2010;35:126–131. doi: 10.1503/jpn.090041. [DOI] [PMC free article] [PubMed] [Google Scholar]
- 86.Bickart KC, Wright CI, Dautoff RJ, Dickerson BC, Barrett LF. Amygdala volume and social network size in humans. Nature Neurosci. 2011;14:163–164. doi: 10.1038/nn.2724. [DOI] [PMC free article] [PubMed] [Google Scholar]
- 87.Westlye LT, Grydeland H, Walhovd KB, Fjell AM. Associations between regional cortical thickness and attentional networks as measured by the attention network test. Cereb. Cortex. 2011;21:345–356. doi: 10.1093/cercor/bhq101. [DOI] [PubMed] [Google Scholar]
- 88.Matsuo K, et al. A voxel-based morphometry study of frontal gray matter correlates of impulsivity. Hum. Brain Mapp. 2009;30:1188–1195. doi: 10.1002/hbm.20588. [DOI] [PMC free article] [PubMed] [Google Scholar]
- 89.Welborn BL, et al. Variation in orbitofrontal cortex volume: relation to sex, emotion regulation and affect. Soc. Cogn. Affect. Neurosci. 2009;4:328–339. doi: 10.1093/scan/nsp028. [DOI] [PMC free article] [PubMed] [Google Scholar]
- 90.Kanai R, Bahrami B, Rees G. Human parietal cortex structure predicts individual differences in perceptual rivalry. Curr. Biol. 2010;20:1626–1630. doi: 10.1016/j.cub.2010.07.027. [DOI] [PMC free article] [PubMed] [Google Scholar]
- 91.Schwarzkopf DS, Song C, Rees G. The surface area of human V1 predicts the subjective experience of object size. Nature Neurosci. 2011;14:28–30. doi: 10.1038/nn.2706. [DOI] [PMC free article] [PubMed] [Google Scholar]
- 92.Narr KL, et al. Relationships between IQ and regional cortical gray matter thickness in healthy adults. Cereb. Cortex. 2006;17:2163–2171. doi: 10.1093/cercor/bhl125. [DOI] [PubMed] [Google Scholar]
- 93.Karama S, et al. Positive association between cognitive ability and cortical thickness in a representative US sample of healthy 6 to 18 year-olds. Intelligence. 2009;37:145–155. doi: 10.1016/j.intell.2008.09.006. [DOI] [PMC free article] [PubMed] [Google Scholar]
- 94.Lv Y-T, et al. Correlations in spontaneous activity and gray matter density between left and right sensoritmotor areas of pianists. Neuroreport. 2008;19:631–634. doi: 10.1097/WNR.0b013e3282fa6da0. [DOI] [PubMed] [Google Scholar]
- 95.Bermudez P, Lerch JP, Evans AC, Zatorre RJ. Neuroanatomical correlates of musicianship as revealed by cortical thickness and voxel-based morphometry. Cereb. Cortex. 2009;19:1583–1596. doi: 10.1093/cercor/bhn196. [DOI] [PubMed] [Google Scholar]
- 96.Jäncke L, Langer N, Hänggi J. Diminished whole-brain but enhanced peri-sylvian connectivity in absolute pitch musicians. J. Cogn. Neurosci. 2012;24:1447–1461. doi: 10.1162/jocn_a_00227. [DOI] [PubMed] [Google Scholar]
- 97.Maguire EA, et al. Navigation-related structural change in the hippocampi of taxi drivers. Proc. Natl Acad. Sci. USA. 2000;97:4398–4403. doi: 10.1073/pnas.070039597. [DOI] [PMC free article] [PubMed] [Google Scholar]
- 98.Maguire EA, et al. Navigation expertise and the human hippocampus: a structural brain imaging analysis. Hippocampus. 2003;13:250–259. doi: 10.1002/hipo.10087. [DOI] [PubMed] [Google Scholar]
- 99.Maguire EA, Woollett K, Spiers HJ. London taxi drivers and bus drivers: a structural MRI and neuropsychological analysis. Hippocampus. 2006;16:1091–1101. doi: 10.1002/hipo.20233. [DOI] [PubMed] [Google Scholar]
- 100.Gaser C, Schlaug G. Brain structures differ between musicians and non-musicians. J. Neurosci. 2003;23:9240–9245. doi: 10.1523/JNEUROSCI.23-27-09240.2003. [DOI] [PMC free article] [PubMed] [Google Scholar]
- 101.Gaser C, Schlaug G. Gray matter differences between musicians and nonmusicians. Ann. NY Acad. Sci. 2003;999:514–517. doi: 10.1196/annals.1284.062. [DOI] [PubMed] [Google Scholar]
- 102.Schneider P, Scherg M, Dosch HG. Morphology of Heschl’s gyrus reflects enhanced activation in the auditory cortex of musicians. Nature Neurosci. 2002;5:688–694. doi: 10.1038/nn871. [DOI] [PubMed] [Google Scholar]
- 103.Hyde KL, et al. Musical training shapes structural brain development. J. Neurosci. 2009;29:3019–3025. doi: 10.1523/JNEUROSCI.5118-08.2009. [DOI] [PMC free article] [PubMed] [Google Scholar]
- 104.Carreiras M, et al. An anatomical signature for literacy. Nature. 2009;461:983–986. doi: 10.1038/nature08461. [DOI] [PubMed] [Google Scholar]
- 105.Dehaene S, et al. How learning to read changes the cortical networks for vision and language. Science. 2010;330:1359–1364. doi: 10.1126/science.1194140. [DOI] [PubMed] [Google Scholar]
- 106.Draganski B, et al. Neuroplasticity: changes in grey matter induced by training. Nature. 2004;427:311–312. doi: 10.1038/427311a. [DOI] [PubMed] [Google Scholar]
- 107.Driemeyer J, Boyke J, Gaser C, Büchel C, May A. Changes in gray matter induced by learning — revisited. PLoS ONE. 2008;3:e2669. doi: 10.1371/journal.pone.0002669. [DOI] [PMC free article] [PubMed] [Google Scholar]
- 108.Knickmeyer RC, et al. A structural MRI study of human brain development from birth to 2 years. J. Neurosci. 2008;28:12176–12182. doi: 10.1523/JNEUROSCI.3479-08.2008. [DOI] [PMC free article] [PubMed] [Google Scholar]
- 109.Paus T, Keshavan M, Giedd JN. Why do many psychiatric disorders emerge during adolescence? Nature Rev. Neurosci. 2008;9:947–957. doi: 10.1038/nrn2513. [DOI] [PMC free article] [PubMed] [Google Scholar]
- 110.Hill J, et al. Similar patterns of cortical expansion during human development and evolution. Proc. Natl Acad. Sci. USA. 2010;107:13135–13140. doi: 10.1073/pnas.1001229107. [DOI] [PMC free article] [PubMed] [Google Scholar]
- 111.Sowell ER, et al. Longitudinal mapping of cortical thickness and brain growth in normal children. J. Neurosci. 2004;24:8223–8231. doi: 10.1523/JNEUROSCI.1798-04.2004. [DOI] [PMC free article] [PubMed] [Google Scholar]
- 112.Shaw P, et al. Neurodevelopmental trajectories of the human cerebral cortex. J. Neurosci. 2008;28:3586–3594. doi: 10.1523/JNEUROSCI.5309-07.2008. [DOI] [PMC free article] [PubMed] [Google Scholar]
- 113.Gogtay N, et al. Dynamic mapping of human cortical development during childhood through early adulthood. Proc. Natl Acad. Sci. USA. 2004;101:8174–8179. doi: 10.1073/pnas.0402680101. [DOI] [PMC free article] [PubMed] [Google Scholar]
- 114.Giedd JN, et al. Brain development during childhood and adolescence: a longitudinal MRI study. Nature Neurosci. 1999;2:861–863. doi: 10.1038/13158. [DOI] [PubMed] [Google Scholar]
- 115.Khundrakpam BS, et al. Developmental changes in organization of structural brain networks. Cereb. Cortex. 2012 Jul 10; doi: 10.1093/cercor/bhs187. [DOI] [PMC free article] [PubMed] [Google Scholar]
- 116.Fan Y, et al. Brain anatomical networks in early human brain development. Neuroimage. 2011;54:1862–1871. doi: 10.1016/j.neuroimage.2010.07.025. [DOI] [PMC free article] [PubMed] [Google Scholar]
- 117.Bartzokis G, et al. Age-related changes in frontal and temporal lobe volumes in men: a magnetic resonance imaging study. Arch. Gen. Psychiatry. 2001;58:461–465. doi: 10.1001/archpsyc.58.5.461. [DOI] [PubMed] [Google Scholar]
- 118.Good CD, et al. A voxel-based morphometric study of ageing in 465 normal adult human brains. Neuroimage. 2001;14:21–36. doi: 10.1006/nimg.2001.0786. [DOI] [PubMed] [Google Scholar]
- 119.Tisserand DJ, et al. Regional frontal cortical volumes decrease differentially in aging: an MRI study to compare volumetric approaches and voxel-based morphometry. Neuroimage. 2002;17:657–669. [PubMed] [Google Scholar]
- 120.Buckner RL. Memory and executive function in aging and AD: multiple factors that cause decline and reserve factors that compensate. Neuron. 2004;44:195–208. doi: 10.1016/j.neuron.2004.09.006. [DOI] [PubMed] [Google Scholar]
- 121.Benedetti B, et al. Influence of aging on brain gray and white matter changes assessed by conventional, MT, and DT MRI. Neurology. 2006;66:535–539. doi: 10.1212/01.wnl.0000198510.73363.c6. [DOI] [PubMed] [Google Scholar]
- 122.Pagani E, Agosta F, Rocca MA, Caputo D, Filippi M. Voxel-based analysis derived from fractional anisotropy images of white matter volume changes with aging. Neuroimage. 2008;41:657–667. doi: 10.1016/j.neuroimage.2008.03.021. [DOI] [PubMed] [Google Scholar]
- 123.Brickman AM, Habeck C, Ramos MA, Scarmeas N, Stern Y. A forward application of age associated gray and white matter networks. Hum. Brain Mapp. 2008;29:1139–1146. doi: 10.1002/hbm.20452. [DOI] [PMC free article] [PubMed] [Google Scholar]
- 124.Brickman AM, Habeck C, Zarahn E, Flynn J, Stern Y. Structural MRI covariance patterns associated with normal aging and neuropsychological functioning. Neurobiol. Aging. 2007;28:284–295. doi: 10.1016/j.neurobiolaging.2005.12.016. [DOI] [PubMed] [Google Scholar]
- 125.Alexander GE, et al. Regional network of magnetic resonance imaging gray matter volume in healthy aging. Neuroreport. 2006;17:951–956. doi: 10.1097/01.wnr.0000220135.16844.b6. [DOI] [PubMed] [Google Scholar]
- 126.Bergfield KL, et al. Age-related networks of regional covariance in MRI gray matter: reproducible multivariate patterns in healthy aging. Neuroimage. 2010;49:1750–1759. doi: 10.1016/j.neuroimage.2009.09.051. [DOI] [PMC free article] [PubMed] [Google Scholar]
- 127.Steffener J, Brickman AM, Habeck CG, Salthouse TA, Stern Y. Cerebral blood flow and gray matter volume covariance patterns of cognition in aging. Hum. Brain Mapp. 2012 Jul 17; doi: 10.1002/hbm.22142. [DOI] [PMC free article] [PubMed] [Google Scholar]
- 128.Montembeault M, et al. The impact of aging on gray matter structural covariance networks. Neuroimage. 2012;63:754–759. doi: 10.1016/j.neuroimage.2012.06.052. [DOI] [PubMed] [Google Scholar]
- 129.Wu K, et al. Age-related changes in topological organization of structural brain networks in healthy individuals. Hum. Brain Mapp. 2012;33:552–568. doi: 10.1002/hbm.21232. [DOI] [PMC free article] [PubMed] [Google Scholar]
- 130.Zhu W, et al. Changing topological patterns in normal aging using large-scale structural networks. Neurobiol. Aging. 2012;33:899–913. doi: 10.1016/j.neurobiolaging.2010.06.022. [DOI] [PubMed] [Google Scholar]
- 131.Chen ZJ, He Y, Rosa-Neto P, Gong G, Evans AC. Age-related alterations in the modular organization of structural cortical network by using cortical thickness from MRI. Neuroimage. 2011;56:235–245. doi: 10.1016/j.neuroimage.2011.01.010. [DOI] [PubMed] [Google Scholar]
- 132.Raichle ME. The restless brain. Brain Connect. 2011;1:3–12. doi: 10.1089/brain.2011.0019. [DOI] [PMC free article] [PubMed] [Google Scholar]
- 133.Buckner RL, et al. Molecular, structural, and functional characterization of Alzheimer’s disease: evidence for a relationship between default activity, amyloid, and memory. J. Neurosci. 2005;25:7709–7717. doi: 10.1523/JNEUROSCI.2177-05.2005. [DOI] [PMC free article] [PubMed] [Google Scholar]
- 134.Zhou J, Gennatas ED, Kramer JH, Miller BL, Seeley WW. Predicting regional neurodegeneration from the healthy brain functional connectome. Neuron. 2012;73:1216–1227. doi: 10.1016/j.neuron.2012.03.004. [DOI] [PMC free article] [PubMed] [Google Scholar]
- 135.Raj A, Kuceyeski A, Weiner M. A network diffusion model of disease progression in dementia. Neuron. 2012;73:1204–1215. doi: 10.1016/j.neuron.2011.12.040. [DOI] [PMC free article] [PubMed] [Google Scholar]
- 136.He Y, Chen Z, Evans A. Structural insights into aberrant topological patterns of large-scale cortical networks in Alzheimer’s disease. J. Neurosci. 2008;28:4756–4766. doi: 10.1523/JNEUROSCI.0141-08.2008. [DOI] [PMC free article] [PubMed] [Google Scholar]
- 137.Oh H, et al. β-Amyloid affects frontal and posterior brain networks in normal aging. Neuroimage. 2011;54:1887–1895. doi: 10.1016/j.neuroimage.2010.10.027. [DOI] [PMC free article] [PubMed] [Google Scholar]
- 138.Alexander GE, et al. Gray matter network associated with risk for Alzheimer’s disease in young to middle-aged adults. Neurobiol. Aging. 2012;33:2723–2732. doi: 10.1016/j.neurobiolaging.2012.01.014. [DOI] [PMC free article] [PubMed] [Google Scholar]
- 139.Yao Z, et al. Abnormal cortical networks in mild cognitive impairment and Alzheimer’s disease. PLoS Comput. Biol. 2010;6:e1001006. doi: 10.1371/journal.pcbi.1001006. [DOI] [PMC free article] [PubMed] [Google Scholar]
- 140.Desikan RS, et al. Selective disruption of the cerebral neocortex in Alzheimer’s disease. PLoS ONE. 2010;5:e12853. doi: 10.1371/journal.pone.0012853. [DOI] [PMC free article] [PubMed] [Google Scholar]
- 141.Mitelman SA, Byne W, Kemether EM, Hazlett EA, Buchsbaum MS. Correlations between volumes of the pulvinar, centromedian, and mediodorsal nuclei and cortical Brodmann’s areas in schizophrenia. Neurosci. Lett. 2006;392:16–21. doi: 10.1016/j.neulet.2005.08.056. [DOI] [PubMed] [Google Scholar]
- 142.Modinos G, et al. Structural covariance in the hallucinating brain: a voxel-based morphometry study. J. Psychiatry Neurosci. 2009;34:465–469. [PMC free article] [PubMed] [Google Scholar]
- 143.Wible CG, et al. Prefrontal cortex and schizophrenia: a quantitative magnetic resonance imaging study. Arch. Gen. Psychiatry. 1995;52:279–288. doi: 10.1001/archpsyc.1995.03950160029007. [DOI] [PubMed] [Google Scholar]
- 144.Breier A, et al. Brain morphology and schizophrenia. A magnetic resonance imaging study of limbic, prefrontal cortex, and caudate structures. Arch. Gen. Psychiatry. 1992;49:921–926. doi: 10.1001/archpsyc.1992.01820120009003. [DOI] [PubMed] [Google Scholar]
- 145.Wible CG, et al. Prefrontal cortex, negative symptoms, and schizophrenia: an MRI study. Psychiatry Res. 2001;108:65–78. doi: 10.1016/s0925-4927(01)00109-3. [DOI] [PMC free article] [PubMed] [Google Scholar]
- 146.Shenton ME, et al. Abnormalities of the left temporal lobe and thought disorder in schizophrenia. A quantitative magnetic resonance imaging study. N. Engl. J. Med. 1992;327:604–612. doi: 10.1056/NEJM199208273270905. [DOI] [PubMed] [Google Scholar]
- 147.Wright IC, et al. Supra-regional brain systems and the neuropathology of schizophrenia. Cereb. Cortex. 1999;9:366–378. doi: 10.1093/cercor/9.4.366. [DOI] [PubMed] [Google Scholar]
- 148. Bullmore ET, et al. Does dysplasia cause anatomical dysconnectivity in schizophrenia? Schizophr. Res. 1998;30:127–135. doi: 10.1016/s0920-9964(97)00141-2. This is an early principal component analysis study of grey matter co-variance in schizophrenia.
- 149.Woodruff PW, et al. Structural brain abnormalities in male schizophrenics reflect fronto-temporal dissociation. Psychol. Med. 1997;27:1257–1266. doi: 10.1017/s0033291797005229. [DOI] [PubMed] [Google Scholar]
- 150.Mitelman SA, Buchsbaum MS, Brickman AM, Shihabuddin L. Cortical intercorrelations of frontal area volumes in schizophrenia. Neuroimage. 2005;27:753–770. doi: 10.1016/j.neuroimage.2005.05.024. [DOI] [PubMed] [Google Scholar]
- 151.Mitelman SA, Shihabuddin L, Brickman AM, Buchsbaum MS. Cortical intercorrelations of temporal area volumes in schizophrenia. Schizophr. Res. 2005;76:207–229. doi: 10.1016/j.schres.2005.01.010. [DOI] [PubMed] [Google Scholar]
- 152.Abbs B, et al. Covariance modeling of MRI brain volumes in memory circuitry in schizophrenia: sex differences are critical. Neuroimage. 2011;56:1865–1874. doi: 10.1016/j.neuroimage.2011.03.079. [DOI] [PMC free article] [PubMed] [Google Scholar]
- 153.Buchanan RW, et al. Morphometric assessment of the heteromodal association cortex in schizophrenia. Am. J. Psychiatry. 2004;161:322–331. doi: 10.1176/appi.ajp.161.2.322. [DOI] [PubMed] [Google Scholar]
- 154.Niznikiewicz M, et al. Abnormal angular gyrus asymmetry in schizophrenia. Am. J. Psychiatry. 2000;157:428–437. doi: 10.1176/appi.ajp.157.3.428. [DOI] [PMC free article] [PubMed] [Google Scholar]
- 155.Bhojraj TS, et al. Do inter-regional gray-matter volumetric correlations reflect altered functional connectivity in high-risk offspring of schizophrenia patients? Schizophr. Res. 2010;118:62–68. doi: 10.1016/j.schres.2010.01.019. [DOI] [PMC free article] [PubMed] [Google Scholar]
- 156.Portas CM, et al. Volumetric evaluation of the thalamus in schizophrenic male patients using magnetic resonance imaging. Biol. Psychiatry. 1998;43:649–659. doi: 10.1016/s0006-3223(97)00339-9. [DOI] [PubMed] [Google Scholar]
- 157.Collin G, et al. Disturbed grey matter coupling in schizophrenia. Eur. Neuropsychopharmacol. 2012;23:46–54. doi: 10.1016/j.euroneuro.2012.09.001. [DOI] [PubMed] [Google Scholar]
- 158.Zhang Y, et al. Abnormal topological organization of structural brain networks in schizophrenia. Schizophr. Res. 2012;141:109–118. doi: 10.1016/j.schres.2012.08.021. [DOI] [PubMed] [Google Scholar]
- 159.Shi F, et al. Altered structural connectivity in neonates at genetic risk for schizophrenia: a combined study using morphological and white matter networks. Neuroimage. 2012;62:1622–1633. doi: 10.1016/j.neuroimage.2012.05.026. [DOI] [PMC free article] [PubMed] [Google Scholar]
- 160.Corradi-Dell’Acqua C, et al. Thalamic-insular dysconnectivity in schizophrenia: evidence from structural equation modeling. Hum. Brain Mapp. 2012;33:740–752. doi: 10.1002/hbm.21246. [DOI] [PMC free article] [PubMed] [Google Scholar]
- 161.van den Heuvel MP, Mandl RCW, Stam CJ, Kahn RS, Hulshoff Pol HE. Aberrant frontal and temporal complex network structure in schizophrenia: a graph theoretical analysis. J. Neurosci. 2010;30:15915–15926. doi: 10.1523/JNEUROSCI.2874-10.2010. [DOI] [PMC free article] [PubMed] [Google Scholar]
- 162.Zalesky A, et al. Disrupted axonal fiber connectivity in schizophrenia. Biol. Psychiatry. 2011;69:80–89. doi: 10.1016/j.biopsych.2010.08.022. [DOI] [PMC free article] [PubMed] [Google Scholar]
- 163.Lynall M-E, et al. Functional connectivity and brain networks in schizophrenia. J. Neurosci. 2010;30:9477–9487. doi: 10.1523/JNEUROSCI.0333-10.2010. [DOI] [PMC free article] [PubMed] [Google Scholar]
- 164.Liu Y, et al. Disrupted small-world networks in schizophrenia. Brain. 2008;131:945–961. doi: 10.1093/brain/awn018. [DOI] [PubMed] [Google Scholar]
- 165.Alexander-Bloch AF, et al. Disrupted modularity and local connectivity of brain functional networks in childhood-onset schizophrenia. Front. Syst. Neurosci. 2010;4:147. doi: 10.3389/fnsys.2010.00147. [DOI] [PMC free article] [PubMed] [Google Scholar]
- 166.Gogtay N, Vyas NS, Testa R, Wood SJ, Pantelis C. Age of onset of schizophrenia: perspectives from structural neuroimaging studies. Schizophr. Bull. 2011;37:504–513. doi: 10.1093/schbul/sbr030. [DOI] [PMC free article] [PubMed] [Google Scholar]
- 167.McGlashan TH, Hoffman RE. Schizophrenia as a disorder of developmentally reduced synaptic connectivity. Arch. Gen. Psychiatry. 2000;57:637–648. doi: 10.1001/archpsyc.57.7.637. [DOI] [PubMed] [Google Scholar]
- 168.Bernhardt BC, et al. Mapping limbic network organization in temporal lobe epilepsy using morphometric correlations: insights on the relation between mesiotemporal connectivity and cortical atrophy. Neuroimage. 2008;42:515–524. doi: 10.1016/j.neuroimage.2008.04.261. [DOI] [PubMed] [Google Scholar]
- 169.Bernhardt BC, Chen Z, He Y, Evans AC, Bernasconi N. Graph-theoretical analysis reveals disrupted small-world organization of cortical thickness correlation networks in temporal lobe epilepsy. Cereb. Cortex. 2011;21:2147–2157. doi: 10.1093/cercor/bhq291. [DOI] [PubMed] [Google Scholar]
- 170.Dziobek I, Bahnemann M, Convit A, Heekeren HR. The role of the fusiform-amygdala system in the pathophysiology of autism. Arch. Gen. Psychiatry. 2010;67:397–405. doi: 10.1001/archgenpsychiatry.2010.31. [DOI] [PubMed] [Google Scholar]
- 171.McAlonan GM, et al. Mapping the brain in autism. A voxel-based MRI study of volumetric differences and intercorrelations in autism. Brain. 2005;128:268–276. doi: 10.1093/brain/awh332. [DOI] [PubMed] [Google Scholar]
- 172.He Y, et al. Impaired small-world efficiency in structural cortical networks in multiple sclerosis associated with white matter lesion load. Brain. 2009;132:3366–3379. doi: 10.1093/brain/awp089. [DOI] [PMC free article] [PubMed] [Google Scholar]
- 173.Baliki MN, Schnitzer TJ, Bauer WR, Apkarian AV. Brain morphological signatures for chronic pain. PLoS ONE. 2011;6:e26010. doi: 10.1371/journal.pone.0026010. [DOI] [PMC free article] [PubMed] [Google Scholar]
- 174.Yeh P-H, et al. Structural equation modeling and principal component analysis of gray matter volumes in major depressive and bipolar disorders: differences in latent volumetric structure. Psychiatry Res. 2010;184:177–185. doi: 10.1016/j.pscychresns.2010.07.007. [DOI] [PMC free article] [PubMed] [Google Scholar]
- 175.Raznahan A, et al. Cortical anatomy in human X monosomy. Neuroimage. 2010;49:2915–2923. doi: 10.1016/j.neuroimage.2009.11.057. [DOI] [PMC free article] [PubMed] [Google Scholar]
- 176.Hosseini SMH, Koovakkattu D, Kesler SR. Altered small-world properties of gray matter networks in breast cancer. BMC Neurol. 2012;12:28. doi: 10.1186/1471-2377-12-28. [DOI] [PMC free article] [PubMed] [Google Scholar]
- 177.Nosarti C, et al. Structural covariance in the cortex of very preterm adolescents: a voxel-based morphometry study. Hum. Brain Mapp. 2011;32:1615–1625. doi: 10.1002/hbm.21133. [DOI] [PMC free article] [PubMed] [Google Scholar]
- 178.Hänggi J, Wotruba D, Jäncke L. Globally altered structural brain network topology in grapheme-color synesthesia. J. Neurosci. 2011;31:5816–5828. doi: 10.1523/JNEUROSCI.0964-10.2011. [DOI] [PMC free article] [PubMed] [Google Scholar]
- 179.de Winter W, Oxnard CE. Evolutionary radiations and convergences in the structural organization of mammalian brains. Nature. 2001;409:710–714. doi: 10.1038/35055547. [DOI] [PubMed] [Google Scholar]
- 180.Shamy JL, et al. Volumetric correlates of spatiotemporal working and recognition memory impairment in aged rhesus monkeys. Cereb. Cortex. 2011;21:1559–1573. doi: 10.1093/cercor/bhq210. [DOI] [PMC free article] [PubMed] [Google Scholar]
- 181.Spocter MA, et al. Wernicke’s area homologue in chimpanzees (Pan troglodytes) and its relation to the appearance of modern human language. Proc. Biol. Sci. 2010;277:2165–2174. doi: 10.1098/rspb.2010.0011. [DOI] [PMC free article] [PubMed] [Google Scholar]
- 182.Alexander GE, et al. Age-related regional network of magnetic resonance imaging gray matter in the rhesus macaque. J. Neurosci. 2008;28:2710–2718. doi: 10.1523/JNEUROSCI.1852-07.2008. [DOI] [PMC free article] [PubMed] [Google Scholar]
- 183.Lerch JP, et al. Maze training in mice induces MRI-detectable brain shape changes specific to the type of learning. Neuroimage. 2011;54:2086–2095. doi: 10.1016/j.neuroimage.2010.09.086. [DOI] [PubMed] [Google Scholar]
- 184.Whitwell JL, et al. Neuroimaging signatures of frontotemporal dementia genetics: C9ORF72, tau, progranulin and sporadics. Brain. 2012;135:794–806. doi: 10.1093/brain/aws001. [DOI] [PMC free article] [PubMed] [Google Scholar]
- 185.Ziegler G, Dahnke R, Gaser C The Alzheimer’s Disease Neuroimaging Initiative. Models of the aging brain structure and individual decline. Front. Neuroinform. 2012;6:3. doi: 10.3389/fninf.2012.00003. [DOI] [PMC free article] [PubMed] [Google Scholar]
- 186.Su L, et al. Sparse representation of brain aging: extracting covariance patterns from structural MRI. PLoS ONE. 2012;7:e36147. doi: 10.1371/journal.pone.0036147. [DOI] [PMC free article] [PubMed] [Google Scholar]
- 187.Bushong SC. Magnetic Resonance Imaging. Mosby Inc.; 2003. [Google Scholar]
- 188.Ashburner J, Friston KJ. Voxel-based morphometry — the methods. Neuroimage. 2000;11:805–821. doi: 10.1006/nimg.2000.0582. [DOI] [PubMed] [Google Scholar]
- 189.Mechelli A, Price CJ, Friston KJ, Ashburner J. Voxel-based morphometry of the human brain: methods and applications. Curr. Med. Imaging Rev. 2005;1:105–113. [Google Scholar]
- 190.Whitwell JL. Voxel-based morphometry: an automated technique for assessing structural changes in the brain. J. Neurosci. 2009;29:9661–9664. doi: 10.1523/JNEUROSCI.2160-09.2009. [DOI] [PMC free article] [PubMed] [Google Scholar]
- 191.Dale AM, Fischl B, Sereno MI. Cortical surface-based analysis. I. Segmentation and surface reconstruction. Neuroimage. 1999;9:179–194. doi: 10.1006/nimg.1998.0395. [DOI] [PubMed] [Google Scholar]
- 192.Fischl B, Sereno MI, Dale AM. Cortical surface-based analysis. II: Inflation, flattening, and a surface-based coordinate system. Neuroimage. 1999;9:195–207. doi: 10.1006/nimg.1998.0396. [DOI] [PubMed] [Google Scholar]
- 193.Kim JS, et al. Automated 3D extraction and evaluation of the inner and outer cortical surfaces using a Laplacian map and partial volume effect classification. Neuroimage. 2005;27:210–221. doi: 10.1016/j.neuroimage.2005.03.036. [DOI] [PubMed] [Google Scholar]
- 194.MacDonald D, Kabani N, Avis D, Evans AC. Automated 3D extraction of inner and outer surfaces of cerebral cortex from MRI. Neuroimage. 2000;12:340–356. doi: 10.1006/nimg.1999.0534. [DOI] [PubMed] [Google Scholar]
- 195.Panizzon MS, et al. Distinct genetic influences on cortical surface area and cortical thickness. Cereb. Cortex. 2009;19:2728–2735. doi: 10.1093/cercor/bhp026. [DOI] [PMC free article] [PubMed] [Google Scholar]
- 196.Raznahan A, et al. How does your cortex grow? J. Neurosci. 2011;31:7174–7177. doi: 10.1523/JNEUROSCI.0054-11.2011. [DOI] [PMC free article] [PubMed] [Google Scholar]
- 197.Ronan L, et al. Intrinsic curvature: a marker of millimeter-scale tangential cortico-cortical connectivity? Int. J. Neural Syst. 2011;21:351–366. doi: 10.1142/S0129065711002948. [DOI] [PMC free article] [PubMed] [Google Scholar]
- 198.Wilcox RR. Introduction to Robust Estimation and Hypothesis Testing. Academic Press; 2012. [Google Scholar]
- 199.Cover TM, Thomas JA. Elements of Information Theory. Wiley-Interscience; 2006. [Google Scholar]
- 200.Gould SJ. Allometry in primates, with emphasis on scaling and the evolution of the brain. Contrib. Primatol. 1975;5:244–292. [PubMed] [Google Scholar]
- 201.Toro R, et al. Brain size and folding of the human cerebral cortex. Cereb. Cortex. 2008;18:2352–2357. doi: 10.1093/cercor/bhm261. [DOI] [PubMed] [Google Scholar]
- 202.Barkovich AJ, Raybaud C. Pediatric Neuroimaging. Lippincott Williams & Wilkins; 2012. [Google Scholar]
- 203.Frisoni GB, Fox NC, Jack CR, Scheltens P, Thompson PM. The clinical use of structural MRI in Alzheimer disease. Nature Rev. Neurol. 2010;6:67–77. doi: 10.1038/nrneurol.2009.215. [DOI] [PMC free article] [PubMed] [Google Scholar]
- 204.Sanabria-Diaz G, et al. Surface area and cortical thickness descriptors reveal different attributes of the structural human brain networks. Neuroimage. 2010;50:1497–1510. doi: 10.1016/j.neuroimage.2010.01.028. [DOI] [PubMed] [Google Scholar]
- 205.Hulshoff Pol HE, et al. Focal white matter density changes in schizophrenia: reduced inter-hemispheric connectivity. Neuroimage. 2004;21:27–35. doi: 10.1016/j.neuroimage.2003.09.026. [DOI] [PubMed] [Google Scholar]
- 206.Avants BB, Cook PA, Ungar L, Gee JC, Grossman M. Dementia induces correlated reductions in white matter integrity and cortical thickness: a multivariate neuroimaging study with sparse canonical correlation analysis. Neuroimage. 2010;50:1004–1016. doi: 10.1016/j.neuroimage.2010.01.041. [DOI] [PMC free article] [PubMed] [Google Scholar]
- 207.Bullmore E, Sporns O. Complex brain networks: graph theoretical analysis of structural and functional systems. Nature Rev. Neurosci. 2009;10:186–198. doi: 10.1038/nrn2575. [DOI] [PubMed] [Google Scholar]
- 208.Romero-Garcia R, Atienza M, Clemmensen LH, Cantero JL. Effects of network resolution on topological properties of human neocortex. Neuroimage. 2012;59:3522–3532. doi: 10.1016/j.neuroimage.2011.10.086. [DOI] [PubMed] [Google Scholar]
- 209.Bullmore ET, Bassett DS. Brain graphs: graphical models of the human brain connectome. Annu. Rev. Clin. Psychol. 2011;7:113–140. doi: 10.1146/annurev-clinpsy-040510-143934. [DOI] [PubMed] [Google Scholar]
- 210.Tohka J, He Y, Evans AC. The impact of sampling density upon cortical network analysis: regions or points. Magn. Reson. Imaging. 2012;30:978–992. doi: 10.1016/j.mri.2012.02.029. [DOI] [PubMed] [Google Scholar]
- 211.Tijms BM, Seriès P, Willshaw DJ, Lawrie SM. Similarity-based extraction of individual networks from gray matter MRI scans. Cereb. Cortex. 2012;22:1530–1541. doi: 10.1093/cercor/bhr221. [DOI] [PubMed] [Google Scholar]
- 212.Mesulam M. The evolving landscape of human cortical connectivity: facts and inferences. Neuroimage. 2011;62:2182–2189. doi: 10.1016/j.neuroimage.2011.12.033. [DOI] [PMC free article] [PubMed] [Google Scholar]
- 213.Van Essen DC, Ugurbil K. The future of the human connectome. Neuroimage. 2012;62:1299–1310. doi: 10.1016/j.neuroimage.2012.01.032. [DOI] [PMC free article] [PubMed] [Google Scholar]
- 214.Jbabdi S, Johansen-Berg H. Tractography: where do we go from here? Brain Connect. 2011;1:169–183. doi: 10.1089/brain.2011.0033. [DOI] [PMC free article] [PubMed] [Google Scholar]
- 215.Logothetis NK, Pauls J, Augath M, Trinath T, Oeltermann A. Neurophysiological investigation of the basis of the fMRI signal. Nature. 2001;412:150–157. doi: 10.1038/35084005. [DOI] [PubMed] [Google Scholar]
- 216.Friston KJ. Functional and effective connectivity: a review. Brain Connect. 2011;1:13–36. doi: 10.1089/brain.2011.0008. [DOI] [PubMed] [Google Scholar]
- 217.Block N. On a confusion about a function of consciousness. Behav. Brain Sci. 1995;15:227–247. [Google Scholar]
- 218.Rykhlevskaia E, Gratton G, Fabiani M. Combining structural and functional neuroimaging data for studying brain connectivity: a review. Psychophysiology. 2008;45:173–187. doi: 10.1111/j.1469-8986.2007.00621.x. [DOI] [PubMed] [Google Scholar]
- 219.Damoiseaux JS, Greicius MD. Greater than the sum of its parts: a review of studies combining structural connectivity and resting-state functional connectivity. Brain Struct. Funct. 2009;213:525–533. doi: 10.1007/s00429-009-0208-6. [DOI] [PubMed] [Google Scholar]
- 220.Watts DJ, Strogatz SH. Collective dynamics of ‘small-world’ networks. Nature. 1998;393:440–442. doi: 10.1038/30918. [DOI] [PubMed] [Google Scholar]