Abstract
Glutathione redox balance ― defined as the ratio GSH/GSSG ― is a critical regulator of cellular redox state, and declines in this ratio are closely associated with oxidative stress and disease. However, little is known about the impact of genetic variation on this trait. Previous mouse studies suggest that tissue GSH/GSSG is regulated by genetic background and is therefore heritable. In this study, we measured glutathione concentrations and GSH/GSSG in liver and kidney of 30 genetically-diverse inbred mouse strains. Genetic background caused an approximately three-fold difference in hepatic and renal GSH/GSSG between the most disparate strains. Haplotype association mapping determined the loci associated with hepatic and renal glutathione phenotypes. We narrowed the number of significant loci by focusing on those located within protein-coding genes, which we now consider to be candidate genes for glutathione homeostasis. No candidate genes were associated with both hepatic and renal GSH/GSSG, suggesting that genetic regulation of GSH/GSSG occurs predominantly in a tissue-specific manner. This is the first quantitative trait loci study to examine the genetic regulation of glutathione concentrations and redox balance in mammals. We identified novel candidate genes that have the potential to redefine our knowledge of redox biochemistry, its regulation, and inform future therapeutic applications.
Keywords: glutathione, genetics, redox, mice
INTRODUCTION
Glutathione is an essential cellular antioxidant. This tripeptide, which is composed of cysteine, glutamate, and glycine, exists predominantly in its reduced form, GSH. GSH is utilized for a broad range of functions, including peroxide clearance and xenobiotic metabolism (6). Utilization of GSH by antioxidant enzymes generates the oxidized, dimer form of glutathione: GSSG. GSSG must then be converted back to two molecules of GSH through endogenous recycling mechanisms. Glutathione redox balance ― the ratio of GSH/GSSG ― is a useful measure of cellular redox state. An increase in GSH/GSSG is indicative of augmented antioxidant capacity, while a decrease is suggestive of oxidative stress and diminished antioxidant defenses. Changes in GSH/GSSG are closely associated with cellular processes like proliferation and apoptosis (1) as well as progression of conditions like diabetes and liver disease (6). GSH/GSSG is therefore critically tied to the fate of the cell in health and disease.
Studying the role of genetic variation in regulation of GSH/GSSG is essential to better understand disease processes. Several studies have shown a relationship between inbred strain and tissue GSH/GSSG in mice. Rebrin, Forster, and Sohal demonstrated that brain and erythrocyte GSH/GSSG differ between the inbred strains C57BL/6J (B6) and DBA/2J (D2)(15, 16). In a panel of 14 inbred strains, Tsuchiya et al. provided evidence that a strain effect occurs for hepatic GSH/GSSG as well (20). These findings suggest natural genetic variation regulates GSH/GSSG, as with other oxidative stress-related phenotypes like lipid peroxidation (7) and resistance to stressors like hyperoxia (4), paraquat (9), and MPTP (5). Since these oxidative stress-related traits are heritable, finding the genes and alleles responsible for their regulation will define the genetic basis of susceptibility to oxidative stress and disease.
In this study, we measured GSH and GSSG concentrations in the liver and kidneys of mice from 30 inbred mouse strains representing three mouse subspecies. Natural genetic variation is associated with up to a three-fold difference in hepatic and renal GSH/GSSG among strains. Haplotype association mapping (HAM) identified loci and candidate genes that regulate hepatic and renal GSH/GSSG. Our findings support the hypothesis that variation in distinct genes regulates GSH/GSSG in different tissues.
MATERIALS AND METHODS
Mouse strains
Female 129S1/SvImJ (129; JAX® #002448), A/J (AJ; JAX® #000646), AKR/J (AKR; JAX® #000648), ALR/J (ALR; JAX® #003070), BALB/cByJ (BALB; JAX® #001026), BTBR T+ Itpr3tf/J (BTBR; JAX® #002282), C3H/HeJ (C3H; JAX® #000659), C57BL/6J (B6; JAX® #000664), C57BL/10J (B10; JAX® #000665), C57BLKS/J (BLKS; JAX® #000662), C57L/J (C57L; JAX® #000668), CAST/EiJ (CAST; JAX® #000928), CBA/J (CBA; JAX® #000656), DBA/1J (D1; JAX® #000670), DBA/2J (D2; JAX® #000671), FVB/NJ (FVB; JAX® #001800), LP/J (LP; JAX® #000676), MRL/MpJ (MRL; JAX® #000486), NOD/ShiLtJ (NOD; JAX® #001976), NON/ShiLtJ (NON; JAX® #002423), NOR/LtJ (NOR; JAX® #002050), NZB/BINJ (NZB; JAX® #000684), NZO/HILtJ (NZO; JAX® #002105), NZW/LacJ (NZW; JAX® #001058), PL/J (PL; JAX® #000680), PWK/PhJ (PWK; JAX® #003715), SJL/J (SJL; JAX® #000686), SM/J (SM; JAX® #000687), SWR/J (SWR; JAX® #000689), and WSB/EiJ (WSB; JAX® #001145) mice were bred and housed at The Jackson Laboratory, Bar Harbor, ME USA. Mice were house in a 12-hour light/dark cycles and at 3–4 months of age, mice were humanely euthanized by cervical dislocation (ACUC approved procedure LAH93-26).
Assessment of GSH/GSSG
Liver and kidneys were removed and diced in ice-cold PBS, blotted on paper towel, and flash frozen. Tissues were homogenized on ice in PBS containing 10 mM DTPA (12). An equal volume of 10% perchloric acid containing 1 mM DTPA was added and samples were centrifuged at 16,000g for 7 minutes at 4°C. Acidified supernatants were transferred to another tube, flash frozen in liquid nitrogen, and stored at −80°C. GSH and GSSG were quantified by the enzymatic recycling method (14) on a SpectraMax microplate reader (Molecular Devices, Sunnyvale, CA USA). All reagents and glutathione standards were purchased from Sigma-Aldrich, St. Louis, MO USA. Total homogenate protein was quantified by Pierce BCA Protein Assay (Thermo Fisher Scientific, Rockford, IL, USA).
Statistical analysis
All analyses were conducted using SAS 9.3. Before performing any analysis on the data, the normality of hepatic and renal GSH/GSSG and median lifespan were checked visually in order to meet the assumptions of later statistical modeling. Hepatic GSH/GSSG ratios were normally distributed while renal ratios were skewed to the right. A Box-Cox analysis suggested that a natural log transformation was appropriate for renal ratios; hence, the variable used for all analyses was ln(renal GSH/GSSG). The distribution of median lifespan was skewed to the left and hence a square transformation was performed on median lifespan.
We used ANOVA to determine the role of genetic background in the regulation of GSH/GSSG. The model used for hepatic GSH/GSSG was
where μ is the overall mean of hepatic GSH/GSSG, Straini is the effect of the ith strain, εij is the error for mouse j from strain i and follows a normal distribution with mean zero and variance σ2, and ni is the number of mice from strain i. The ANOVA table and analysis results are as follows:
| Source | DF | Sum of Squares |
Mean Square | F Value | P- value |
|---|---|---|---|---|---|
| Model | 29 | 51840.78 | 1787.61 | 11.67 | <.001 |
| Error | 167 | 25587.69 | 153.220 | ||
| Corrected Total | 196 | 77428.47 |
| R-Square | Root MSE |
| 0.670 | 12.378 |
Similarly, the ANOVA table and analysis results for ln(renal GSH/GSSG) are:
| Source | DF | Sum of Squares |
Mean Square | F Value | P- value |
|---|---|---|---|---|---|
| Model | 29 | 17.30 | 0.60 | 11.30 | <.001 |
| Error | 167 | 8.81 | 0.053 | ||
| Corrected Total | 196 | 2444.65 |
| R-Square | Root MSE |
|---|---|
| 0.662 | 0.230 |
The Pearson Correlation Coefficient between average hepatic GSH/GSSG and average ln(renal GSH/GSSG) was calculated by first averaging the hepatic and natural-log transformed GSH/GSSG measures within each strain, for a total of 30 pairs of measures (one per strain). The correlation was then calculated for the thirty pairs of measures.
We also performed an ANCOVA to test whether the relationship between hepatic and renal GSH/GSSG within strains is different across strains. The model is:
where μ is the overall mean of ln(renal GSH/GSSG), Straini is the effect of the ith strain, α is the average coefficient for hepatic GSH/GSSG across strains, βi is the change in the coefficient for hepatic GSH/GSSG with strain i, εij is the error for mouse j from strain i and follows a normal distribution with mean zero and variance σ2, and ni is the number of mice from strain i:
| Source | DF | Sum of Squares |
Mean Square | F Value | P- value |
|---|---|---|---|---|---|
| Model | 59 | 20.19 | 0.34 | 7.91 | <.001 |
| Error | 137 | 5.92 | 0.04 | ||
| Corrected Total | 196 | 26.11 |
| R-Square | Root MSE |
|---|---|
| 0.773 | 0.208 |
| Source | DF | Type III SS | Mean Square | F Value | P- value |
|---|---|---|---|---|---|
| LiverGlutathione | 1 | 0.73 | 0.73 | 16.85 | <.001 |
| Strain | 29 | 3.02 | 0.10 | 2.41 | <.001 |
| LiverGlutathi*Strain | 29 | 2.29 | 0.08 | 1.82 | 0.012 |
The Pearson Correlation Coefficients between average hepatic GSH/GSSG and (median lifespan)2, and between average ln(renal GSH/GSSG) and (median lifespan)2 were calculated by first averaging the hepatic and natural-log transformed GSH/GSSG measures within each strain for 25 strains. Then, the Pearson Correlation between average hepatic GSH/GSSG and (median lifespan)2 was calculated by using 25 pairs of average and (median lifespan)2. The correlation between ln(renal GSH/GSSG) and (median lifespan)2 was calculated in the same way.
Haplotype Association Mapping
GSH and GSSG concentrations, and GSH/GSSG, were collected and the data transformed (log10 or square-root) to maintain normal distribution. Values were imported into EMMA and tested for associations with 132,000 SNPs on file for 29 of our 30 strains. ALR/LtJ was not an available option and was therefore excluded from EMMA analysis. SNPs with p values less than 10−5 were selected by the program to be significant. The Mouse Genome Informatics Database (http://www.informatics.jax.org/) was searched by the location of significant SNPs to identify the protein coding genes or known QTLs covering corresponding SNPs.
RESULTS
Genetic Background Regulates Glutathione Concentrations and Redox Balance
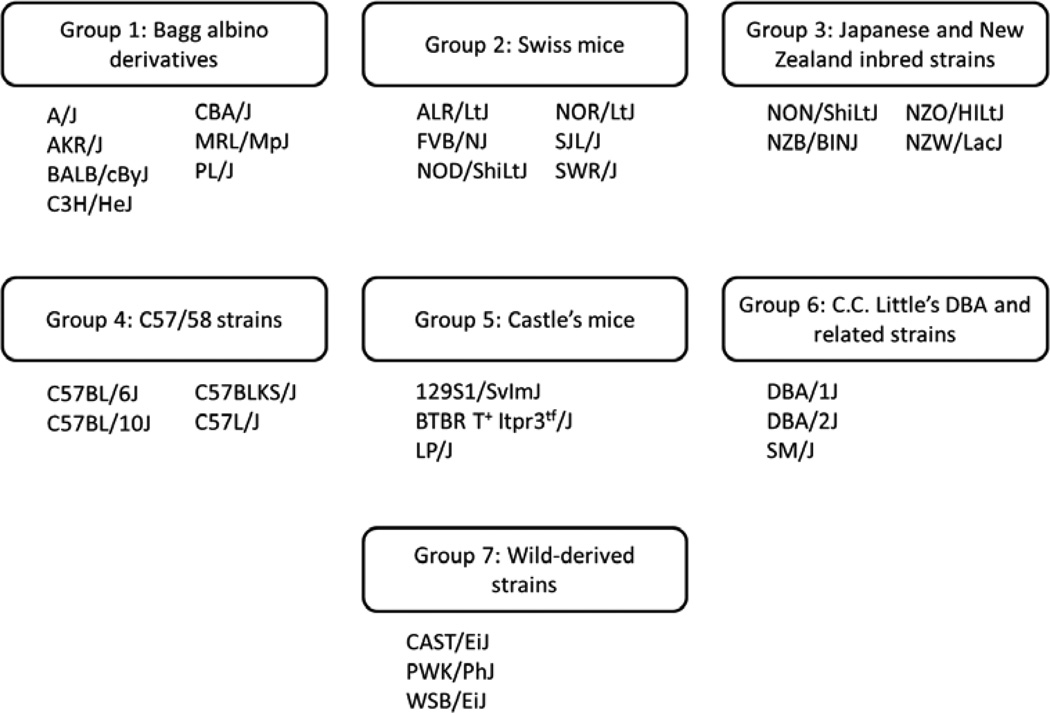
To analyze the relationship between genetic background and GSH/GSSG, a panel of 30 inbred mouse strains was constructed to reflect the genetic diversity in the mouse genome. Petkov et al. assembled a mouse phylogenetic tree wherein inbred mouse strains were separated into seven groups (Fig. 1) (13); individual groups share a general lineage as follows: Group 1 – Bagg albino derivatives; Group 2 – Swiss mice; Group 3 – Japanese and New Zealand inbred strains; Group 4 – C57/58 strains; Group 5 – Castle’s mice; Group 6 – C.C. Little’s DBA and related strains; and Group 7 – wild-derived strains (heterogeneous group). Each group is represented by at least three strains in our panel.
Figure 1. Genetic relatedness of inbred mouse strains.
The 30 inbred strains employed in this study were separated into their genetic groups as proposed by Petkov, et al (13). Each group is represented by at least three strains in our panel.
Liver is frequently utilized for the measurement of GSH/GSSG as hepatic glutathione concentrations are higher than those in other organs, likely due to the role of the liver in xenobiotic metabolism. We hypothesized that if genetic background has a significant influence on GSH/GSSG, this will most likely manifest in the liver. To test if our trends were specific to liver or were indicative of genes and alleles that regulate GSH/GSSG in the whole organism, we tested renal GSH/GSSG as well.
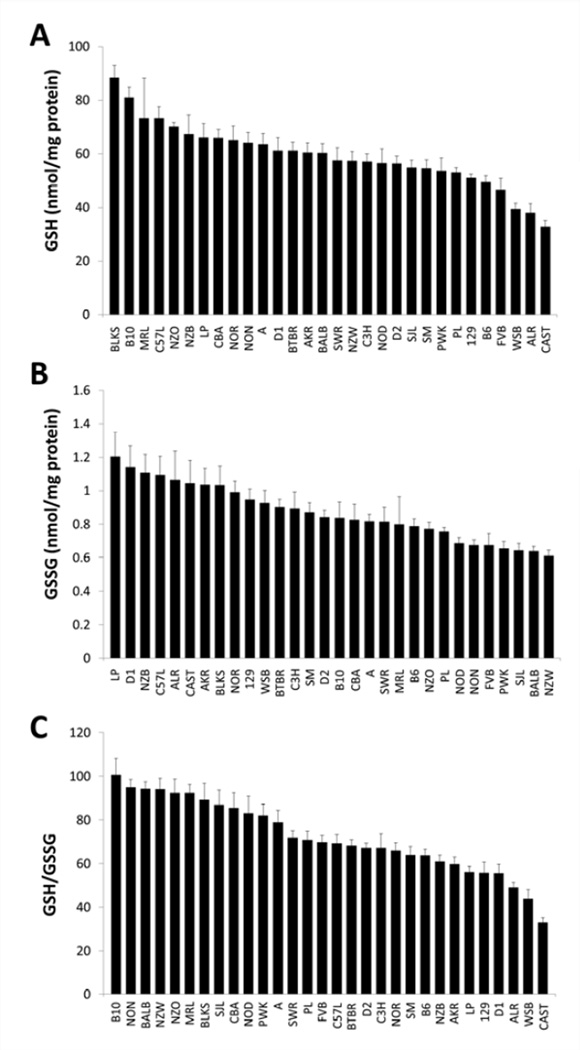
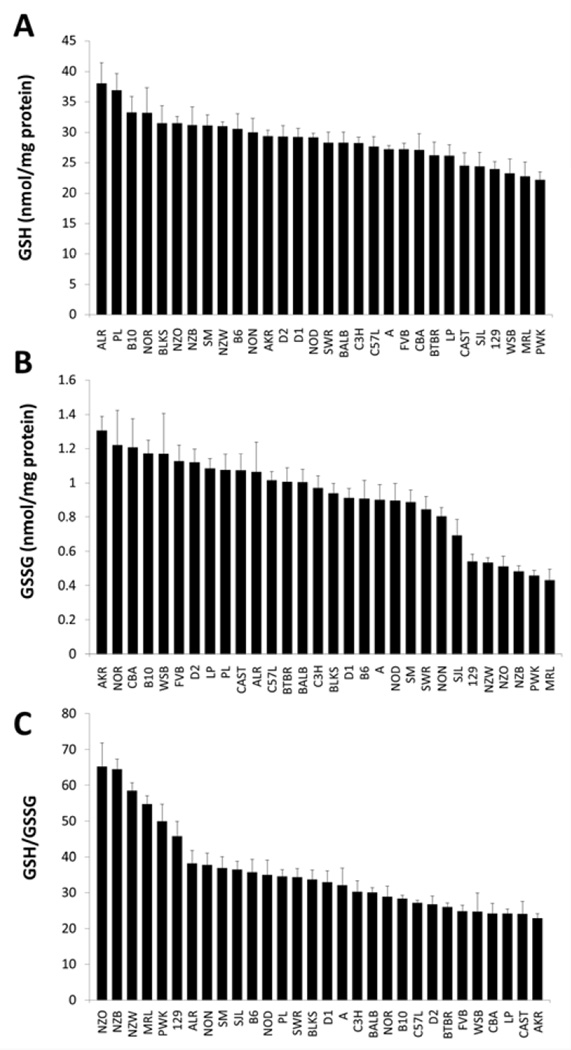
In a panel of 30 genetically-diverse inbred mouse strains, genetic background had a significant effect on both hepatic and log transformed renal GSH/GSSG (p < 0. 001 for both). A three-fold difference was observed in hepatic GSH/GSSG between the strains with the lowest (CAST; 33.01 ± 2.13) and highest (B10; 100.73 ± 7.38) phenotypes (Fig. 2). Interestingly, renal GSH/GSSG was also shown to have a similar three-fold difference between the two most disparate strains (22.83 ± 1.28 in AKR versus 65.27 ± 6.62 in NZO; Fig 3). These results provide definitive new data to guide the design of future genetic studies.
Figure 2. Liver GSH concentrations, GSSG, concentrations, and GSH/GSSG ratio in 30 inbred mouse strains.
The livers of female mice (n = 6–10) representing 30 inbred strains were analyzed for GSH and GSSG concentrations, which were normalized to total protein and calculated as a ratio. Data are presented as mean ± S.E.
Figure 3. Kidney GSH concentrations, GSSG, concentrations, and GSH/GSSG ratio in 30 inbred mouse strains.
The kidneys of female mice (n = 6–10) representing 30 inbred strains were analyzed for GSH and GSSG concentrations, which were normalized to total protein and calculated as a ratio. Data are presented as mean ± S.E
Strains that belong to group 3 on the mouse family tree are of special interest as we map the genes responsible for GSH/GSSG. NZO and NZW had very high renal and hepatic GSH/GSSG (Fig. 2 and Fig. 3). NZB had a high renal GSH/GSSG, while NON was shown to have high hepatic GSH/GSSG. Shared alleles in this group may lead to the inheritance of a predisposition for high tissue GSH/GSSG, a hypothesis that will be tested in future investigations.
Lifespan is an inherited trait that may be influenced by oxidative stress and antioxidant capacity. The lifespans for most of the inbred mouse strains in our study have been previously reported by Yuan et al. (23). We tested for correlations between median lifespans and GSH/GSSG; neither hepatic nor renal GSH/GSSG was associated with the square of median lifespan (r2 = 0.000, p = 0.999 and r2 = 0.001, p = 0.898 respectively). Glutathione redox balance of young mice apparently does not influence overall longevity.
Some Wild-derived Alleles May Negatively Influence GSH/GSSG
The inbred strains CAST, PWK, and WSB are subspecies that originate from mice captured in the wild. These mice increase the amount of genetic diversity in our study because most classical inbred strains originate from domesticated mice bred by mouse fanciers, which limited genetic diversity. Because wild-derived mouse strains were inbred without domestication, they retain many genetic differences from domesticated mice. The considerable genetic differences between classical inbred strains and wild-derived inbred strains are useful for the analysis of quantitative traits and follow-up mapping studies.
In this study, our three wild-derived strains represent three mouse subspecies: Mus musculus musculus (PWK/PhJ), Mus musculus castaneus (CAST/EiJ), and Mus musculus domesticus (WSB/EiJ). The inclusion of these strains demonstrates the influence of wildderived alleles on GSH/GSSG. While tissue GSH/GSSG ratios in PWK were higher than many of the classical inbred strains, WSB and CAST had the two lowest hepatic GSH/GSSG ratios in the entire panel. These two strains also had very low renal GSH/GSSG (Fig. 2 and Fig. 3). Our data suggest that an association exists between some, but perhaps not all, wild-derived alleles and GSH/GSSG.
Hepatic and Renal GSH/GSSG are Correlated
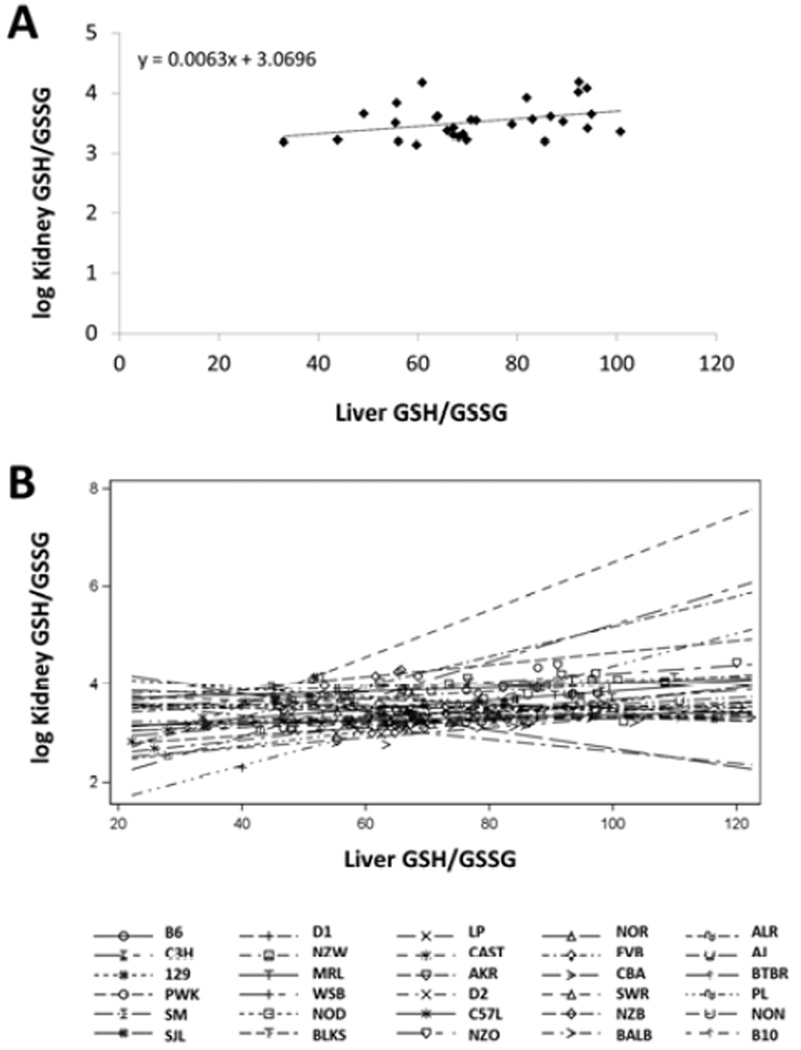
We first tested the significance of the Pearson Correlation between average hepatic and renal GSH/GSSG across the averages of the 30 strains (note that renal measures were natural log transformed due to skewness). The two measures were significantly correlated (r2 = 0.148, p = 0.036), so that 14.8% of variability in renal and hepatic GSH/GSSG is related. We then performed an analysis of covariance (ANCOVA) to test whether the relationship between hepatic and renal GSH/GSSG within strains is different across strains. A significant interaction between strain and hepatic GSH/GSSG indicates that the strength of the relationship between hepatic and renal GSH/GSSG is different for each strain (p = 0.012; Fig. 4). This indicates that the variations in renal and kidney GSH/GSSG due to non-genetic sources and random differences are more strongly linked in some strains than in others.
Figure 4. Relationship between liver and kidney GSH/GSSG ratio.
A) Plot of liver versus log kidney GSH/GSSG for 30 inbred mouse strains. B) Correlation between liver and log kidney GSH/GSSG for each inbred strain separately. The relationship between liver and kidney GSH/GSSG depends on genetic background.
Identification of Novel Candidate Genes in Regulation of Glutathione Redox Balance
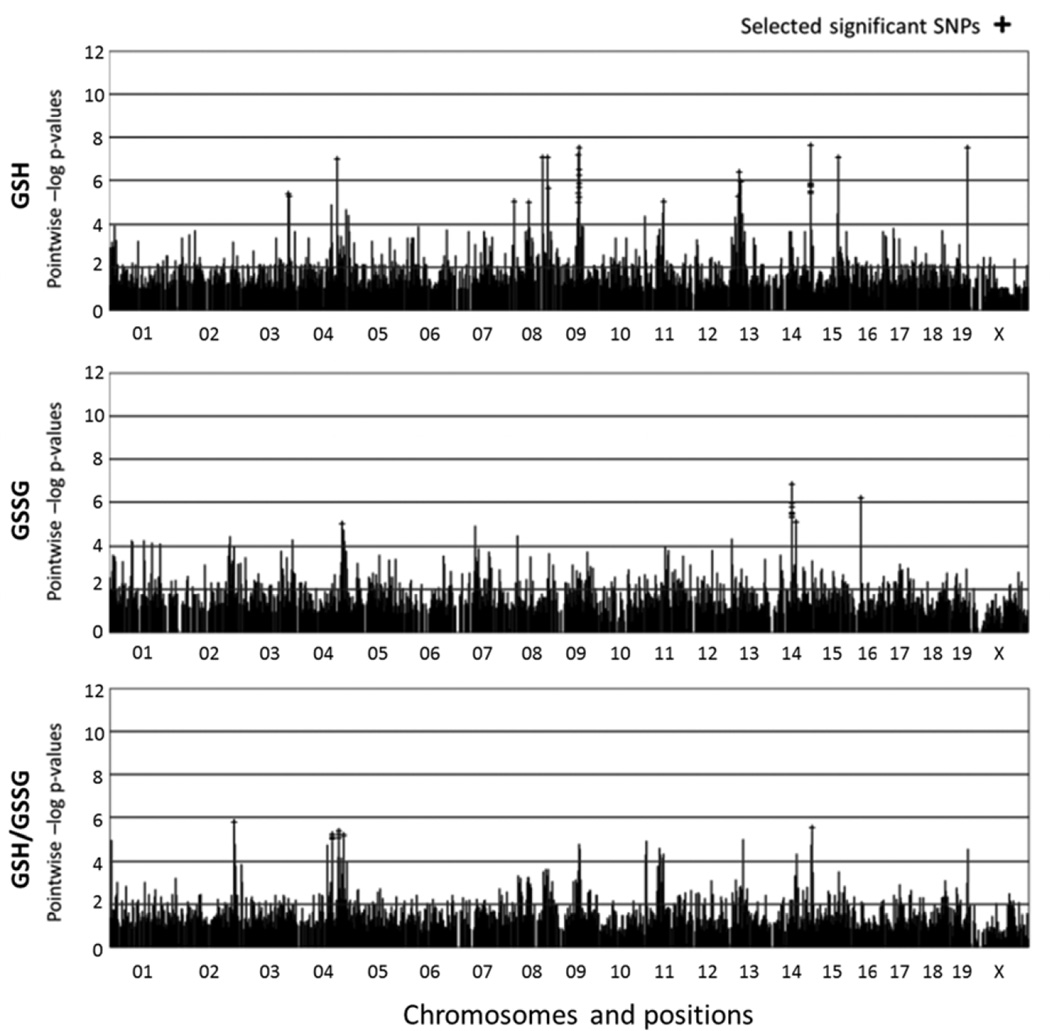
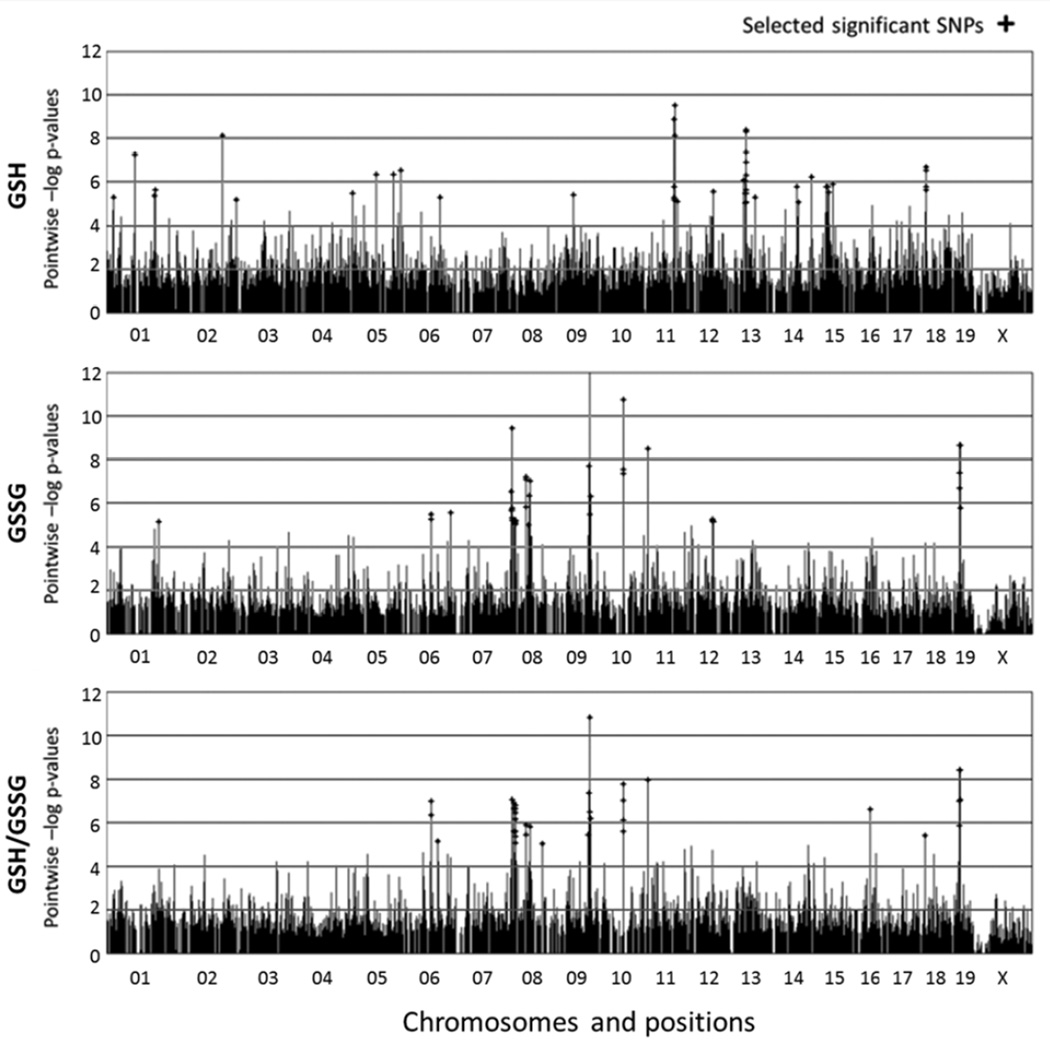
Efficient Mixed-Model Association (EMMA) was used to assess the relationship between glutathione phenotypes and 132,000 SNPs (2, 10). SNPs with p-values less than 10−5 were selected as significant (Fig. 5 and Fig. 6). Significant SNPs were further narrowed by selecting those that are found within protein-coding genes (Mouse Genome Informatics Database, http://www.informatics.jax.org), which we considered candidate genes for glutathione regulation (Table 1 and Table 2). We also discovered significant overlap between the genes that regulate GSSG concentrations and GSH/GSSG in kidney (Table 2). This suggests that renal GSH concentrations are not regulated by the genes and alleles that regulate glutathione redox balance.
Figure 5. HAM genome scan for liver GSH and GSSG concentrations, as well as GSH/GSSG ratio.
The labeling on the x-axis notes the chromosomes in the mouse genome and the y-axis represents HAM score, which is –log p-value. Peaks with cross shape indicates significant SNPs.
Figure 6. HAM genome scan for kidney GSH and GSSG concentrations, as well as GSH/GSSG ratio.
The labeling on the x-axis notes the chromosomes in the mouse genome and the y-axis represents HAM score, which is –log p-value. Peaks with cross shape indicates significant SNPs.
Table 1.
HAM peaks and protein-coding genes associated with liver glutathione phenotypes
| Phenotype | Chromosome | Locus (bp) | Number of SNPs |
Protein-coding Genes in Interval |
|---|---|---|---|---|
| GSH | 3 | 137227778–137559816 | 2 | Emcn, Gm4861, Gm567 |
| GSH | 8 | 14761415 | 1 | Dlgap2 |
| GSH | 8 | 56109297 | 1 | Glra3 |
| GSH | 8 | 110469117 | 1 | Hydin |
| GSH | 8 | 111471007 | 1 | Wdr59 |
| GSH | 9 | 68901235 | 1 | Rora |
| GSH | 14 | 117019508–117381589 | 9 | Gpc6 |
| GSSG | 4 | 130724603 | 1 | Pum1 |
| GSSG | 14 | 62215307–62285021 | 3 | Dleu7 |
| GSSG | 16 | 32783263 | 1 | Muc20 |
| GSH/GSSG | 2 | 160594981 | 1 | Gm14221 |
| GSH/GSSG | 4 | 99947162 | 1 | Pgm2 |
| GSH/GSSG | 4 | 100256660–100031636 | 2 | Ror1 |
| GSH/GSSG | 4 | 118045081–118097145 | 3 | St3gal3 |
| GSH/GSSG | 14 | 117572316 | 1 | Gpc6 |
Table 2.
HAM peaks and protein-coding genes associated with kidney glutathione phenotypes
| Phenotype | Chromosome | Locus (bp) | Number of SNPs |
Protein-coding Genes in Interval |
|---|---|---|---|---|
| GSH | 1 | 20598463 | 1 | Pkhd1 |
| GSH | 1 | 81080496 | 1 | Nyap2 |
| GSH | 1 | 138111815 | 1 | Ptprc |
| GSH | 5 | 75003877 | 1 | Chic2 |
| GSH | 5 | 123504936 | 1 | Lrrc43 |
| GSH | 5 | 144959470 | 1 | Smurf1 |
| GSH | 11 | 82722506 | 1 | Cct6b |
| GSH | 11 | 82765715 | 1 | Zfp830 |
| GSH | 11 | 86178368–86193392 | 3 | Brip1 |
| GSH | 11 | 93177374 | 1 | Car10 |
| GSH | 13 | 37903516 | 1 | Rreb1 |
| GSH | 13 | 43624914 | 1 | Rnf182 |
| GSH | 13 | 44730456–44798929 | 3 | Jarid2 |
| GSH | 14 | 70791410 | 1 | Adamts16 |
| GSH | 14 | 70629808 | 1 | Dmtn |
| GSH | 15 | 27663667 | 1 | Fam105a |
| GSH | 15 | 27746793 | 1 | Trio |
| GSH | 18 | 14645957 | 1 | Ss18 |
| GSH | 18 | 14883202–14887645 | 2 | Taf4b |
| GSH | 18 | 16605612 | 1 | Cdh2 |
| GSSG | 6 | 134119453 | 1 | Etv6 |
| GSSG | 8 | 11244537 | 1 | Col4a1 |
| GSSG | 8 | 15953204–16860830 | 16 | Csmd1 |
| GSSG | 8 | 47982037–47988542 | 2 | Wwc2 |
| GSSG | 8 | 48244906 | 1 | Tenm3 |
| GSSG | 8 | 54793602 | 1 | Wdr17 |
| GSSG | 8 | 55416311 | 1 | Gm392 |
| GSSG | 12 | 73752989 | 1 | Prkch |
| GSSG | 19 | 21397909 | 1 | Gda |
| GSSG | 19 | 22148587–22457228 | 2 | Trpm3 |
| GSH/GSSG | 8 | 11206425–11244537 | 2 | Col4a1 |
| GSH/GSSG | 8 | 15953204–16860830 | 19 | Csmd1 |
| GSH/GSSG | 8 | 47982037 | 1 | Wwc2 |
| GSH/GSSG | 8 | 48244906 | 1 | Tenm3 |
| GSH/GSSG | 18 | 12293017 | 1 | Ankrd29 |
| GSH/GSSG | 19 | 21397909 | 1 | Gda |
| GSH/GSSG | 19 | 22148587–22457228 | 2 | Trpm3 |
DISCUSSION
Glutathione concentrations and redox balance are regulated by genetic background. Previous studies in mice have shown a strain effect on glutathione-related phenotypes (15, 16, 20). However, these studies discovered the relationships during investigations into calorie restriction and alcohol-induced liver injury. We reasoned that glutathione concentrations and redox balance are quantitative traits, and like other quantitative traits, these phenotypes can be mapped. Our approach would provide essential information regarding individual susceptibility to disease, as well as highlight potential new therapeutic targets to prolong or improve tissue function in disease. Here, we present the first putative QTLs ― and candidate genes ― that regulate mammalian tissue glutathione concentrations and redox balance.
In this study, we found a three-fold difference in both liver and kidney GSH/GSSG among 30 inbred mouse strains. A weak correlation exists between liver and kidney GSH/GSSG. If liver and kidney were regulated exclusively by the same genes, the correlation should be more significant. To explain these findings, we propose a model to help address this correlation. Here we designate Ratio GSH/GSSG (liver) as RL and Ratio GSH/GSSG ratio (kidney) as RK. We then consider that there may be some genes expressed in both the liver and kidney. We classify these genes as G. Those only expressed in the liver and which regulate GSH/GSSG are classified as GL, and similarly those in the kidney are classified as GK. Non-genetic sources of variability are classified as NG, though these non-genetic sources of variability may be influenced by genetic background. Mathematically, we suppose the following two equations: RL=f(G, GL, NG, NGL) + ε, RK= f(G, GK, NG, NGK) +ε,(ε represents noise). The significant correlation between liver and kidney GSH/GSSG argues for the role of G genes expressed in both organs simultaneously. However, other genes, GL and GK, may regulate this phenotype in a tissue-specific manner, and could be partially responsible for the approximate 85% of variability that renal and hepatic GSH/GSSG do not share. These equations represent our hypotheses to explain the weak correlation between liver and kidney GSH/GSSG. These hypotheses will be tested in future genetics studies utilizing outbred mouse populations.
Our HAM results revealed no protein-coding genes that regulate both liver and kidney GSH/GSSG, yet we still discovered a weak association between these phenotypes. To explain these findings, we predict that the sequences of G genes in our model, which are expressed both in liver and kidney, might be largely conserved and therefore contribute to the weak association between liver and kidney GSH/GSSG without being detected by HAM analysis. One possible example of this is glutamate-cysteine ligase catalytic subunit (GCLC), which is responsible for glutathione biosynthesis. We searched for SNPs within this gene among the genomes of 25 inbred strains included in our study (informatics.jax.org). We found no nonsynonymous coding SNPs. Instead, we discovered several synonymous coding SNPs and the large number of remaining SNPs were located within introns. GCLC is therefore less likely to be listed as a candidate gene by our methods since non-synonymous coding SNPs are not present to cause an amino acid sequence alteration. The role of variation in genes like GCLC will be tested in future studies.
We also found evidence that some of the novel genes uncovered by HAM analysis may directly impact glutathione redox balance. Among them, RAR-related orphan receptor alpha (Rora) was associated with hepatic GSH concentration, and a previous study demonstrated that Rora controls expression of the rate-limiting enzyme for GSH biosynthesis as a repressor (21). In another example, we found Brip1 to be associated with renal GSH. Brip1 is essential to DNA repair responses to stressors like ochratoxin A (8) that also deplete GSH (18). Our next study will determine whether candidate genes like Rora and Brip1 have real associations with GSH in liver and kidney, respectively.
HAM is a powerful approach that has been used to identify candidate genes involved in the regulation of a wide array of phenotypes in mice, including red blood cell count (RBC) and high density lipoprotein cholesterol (HDL) (3) and albuminuria (19). However, this approach is not without limitations, as it has also been proposed that this method may lack the power to find QTLs for some phenotypes (11). HAM also has a high rate of false positives, often requiring experimental crosses to validate loci (3). Our future studies will generate outcrossed mice derived from strains with high tissue GSH/GSSG and strains with low GSH/GSSG. These studies will verify the validity of glutathione-associated genes and test if additional genes and alleles regulate glutathione phenotypes.
Glutathione redox balance ― GSH/GSSG ― is a regulator of a multitude of cellular processes and is associated with the development of many diseases. To our knowledge, this study is the first to map the genes that regulate glutathione concentrations and redox balance in mammalian tissues. Our study focuses on variation within the nuclear genome that is associated with glutathione homeostasis, which complements previous efforts that revealed different alleles within the mitochondrial genome can influence glutathione redox state in mice (17). Genetic regulation of GSH/GSSG in mice has significant clinical importance. A recently reported study conducted in human subjects provides data suggesting that red blood cell GSH/GSSG may be heritable in humans as well (22), but genetic effects in humans have not been tested in liver and kidney. Findings that support a relationship between genetics and oxidative stress-related phenotypes like GSH/GSSG create remarkable promise for disease treatments. The next stages of this research ― the validation of genes and alleles that regulate GSH/GSSG ― will contribute to the development of the field of personalized medicine, as well as highlight potential therapeutic targets to ameliorate oxidative stress in clinical disease.
HIGHLIGHTS.
The relationship between genetic variation and redox state is not well-defined.
We measured GSH/GSSG in liver and kidney of 30 diverse inbred mouse strains.
Genetic background is associated with a three-fold range in tissue GSH/GSSG.
We performed first QTL mapping of glutathione homeostasis in mammals.
Novel glutathione homeostasis candidate genes were discovered.
ACKNOWLEDGMENTS
The authors gratefully acknowledge Dr. Lynn Bailey, Dr. Kathrine Weeks, and Ms. Bev Hull for reviewing this manuscript, as well as Mike Astle, Vicki Ingalls, Nelson Durgin, Dr. Rick Lewis, and Jessica Joan Smith for their assistance with this project. This work was supported by the following grants: GM101723 (R.P.) and AG032333 (D.E.H.).
LIST OF ABBREVIATIONS
- 129
129S1/SvImJ
- AJ
A/J
- AKR
AKR/J
- ALR
ALR/J
- ANCOVA
Analysis of covariance
- B6
C57BL/6J
- B10
C57BL/10J
- BALB
BALB/cByJ
- BLKS
C57BLKS/J
- BTBR
BTBR T+ Itpr3tf/J
- C3H
C3H/HeJ
- C57L
C57L/J
- CAST
CAST/EiJ
- CBA
CBA/J
- D1
DBA/1J
- D2
DBA/2J
- DTPA
diethylenetriaminepentaacetic acid
- FVB
FVB/NJ
- GSH
reduced glutathione
- GSSG
oxidized glutathione
- HAM
Haplotype association mapping
- LP
LP/J
- MRL
MRL/MpJ
- NOD
NOD/ShiLtJ
- NON
NON/ShiLtJ
- NOR
NOR/LtJ
- NZB
NZB/BINJ
- NZO
NZO/HILtJ
- NZW
NZW/LacJ
- PL
PL/J
- PWK
PWK/PhJ
- QTL
quantitative trait loci
- SJL
SJL/J
- SM
SM/J
- SWR
SWR/J
- WSB
WSB/EiJ
Footnotes
Publisher's Disclaimer: This is a PDF file of an unedited manuscript that has been accepted for publication. As a service to our customers we are providing this early version of the manuscript. The manuscript will undergo copyediting, typesetting, and review of the resulting proof before it is published in its final citable form. Please note that during the production process errors may be discovered which could affect the content, and all legal disclaimers that apply to the journal pertain.
Author disclosure statement: The authors have no conflicts of interest to disclose.
REFERENCES
- 1.Aw TY. Cellular redox: a modulator of intestinal epithelial cell proliferation. News Physiol Sci. 2003;18:201–204. doi: 10.1152/nips.01448.2003. [DOI] [PubMed] [Google Scholar]
- 2.Bennett BJ, Farber CR, Orozco L, Kang HM, Ghazalpour A, Siemers N, Neubauer M, Neuhaus I, Yordanova R, Guan B, Truong A, Yang WP, He A, Kayne P, Gargalovic P, Kirchgessner T, Pan C, Castellani LW, Kostem E, Furlotte N, Drake TA, Eskin E, Lusis AJ. A high-resolution association mapping panel for the dissection of complex traits in mice. Genome Res. 2010;20:281–290. doi: 10.1101/gr.099234.109. [DOI] [PMC free article] [PubMed] [Google Scholar]
- 3.Burgess-Herbert SL, Tsaih SW, Stylianou IM, Walsh K, Cox AJ, Paigen B. An experimental assessment of in silico haplotype association mapping in laboratory mice. BMC Genet. 2009;10:81. doi: 10.1186/1471-2156-10-81. [DOI] [PMC free article] [PubMed] [Google Scholar]
- 4.Cho HY, Jedlicka AE, Reddy SP, Zhang LY, Kensler TW, Kleeberger SR. Linkage analysis of susceptibility to hyperoxia. Nrf2 is a candidate gene. Am J Respir Cell Mol Biol. 2002;26:42–51. doi: 10.1165/ajrcmb.26.1.4536. [DOI] [PubMed] [Google Scholar]
- 5.Cook R, Lu L, Gu J, Williams RW, Smeyne RJ. Identification of a single QTL, Mptp1, for susceptibility to MPTP-induced substantia nigra pars compacta neuron loss in mice. Brain Res Mol Brain Res. 2003;110:279–288. doi: 10.1016/s0169-328x(02)00659-9. [DOI] [PubMed] [Google Scholar]
- 6.Franco R, Schoneveld OJ, Pappa A, Panayiotidis MI. The central role of glutathione in the pathophysiology of human diseases. Arch Physiol Biochem. 2007;113:234–258. doi: 10.1080/13813450701661198. [DOI] [PubMed] [Google Scholar]
- 7.Gerhard GS, Kaufmann EJ, Wang X, Erikson KM, Abraham J, Grundy M, Beard JL, Chorney MJ. Genetic differences in hepatic lipid peroxidation potential and iron levels in mice. Mech Ageing Dev. 2002;123:167–176. doi: 10.1016/s0047-6374(01)00329-3. [DOI] [PubMed] [Google Scholar]
- 8.Hibi D, Kijima A, Kuroda K, Suzuki Y, Ishii Y, Jin M, Nakajima M, Sugita-Konishi Y, Yanai T, Nohmi T, Nishikawa A, Umemura T. Molecular mechanisms underlying ochratoxin A-induced genotoxicity: global gene expression analysis suggests induction of DNA double-strand breaks and cell cycle progression. J Toxicol Sci. 2013;38:57–69. doi: 10.2131/jts.38.57. [DOI] [PubMed] [Google Scholar]
- 9.Jiao Y, Lu L, Williams RW, Smeyne RJ. Genetic dissection of strain dependent paraquat-induced neurodegeneration in the substantia nigra pars compacta. PLoS One. 2012;7:e29447. doi: 10.1371/journal.pone.0029447. [DOI] [PMC free article] [PubMed] [Google Scholar]
- 10.Kang HM, Zaitlen NA, Wade CM, Kirby A, Heckerman D, Daly MJ, Eskin E. Efficient control of population structure in model organism association mapping. Genetics. 2008;178:1709–1723. doi: 10.1534/genetics.107.080101. [DOI] [PMC free article] [PubMed] [Google Scholar]
- 11.Mhyre TR, Chesler EJ, Thiruchelvam M, Lungu C, Cory-Slechta DA, Fry JD, Richfield EK. Heritability, correlations and in silico mapping of locomotor behavior and neurochemistry in inbred strains of mice. Genes Brain Behav. 2005;4:209–228. doi: 10.1111/j.1601-183X.2004.00102.x. [DOI] [PubMed] [Google Scholar]
- 12.Park HJ, Mah E, Bruno RS. Validation of high-performance liquid chromatographyboron-doped diamond detection for assessing hepatic glutathione redox status. Anal Biochem. 2010;407:151–159. doi: 10.1016/j.ab.2010.08.012. [DOI] [PubMed] [Google Scholar]
- 13.Petkov PM, Ding Y, Cassell MA, Zhang W, Wagner G, Sargent EE, Asquith S, Crew V, Johnson KA, Robinson P, Scott VE, Wiles MV. An efficient SNP system for mouse genome scanning and elucidating strain relationships. Genome Res. 2004;14:1806–1811. doi: 10.1101/gr.2825804. [DOI] [PMC free article] [PubMed] [Google Scholar]
- 14.Rahman I, Kode A, Biswas SK. Assay for quantitative determination of glutathione and glutathione disulfide levels using enzymatic recycling method. Nat Protoc. 2006;1:3159–3165. doi: 10.1038/nprot.2006.378. [DOI] [PubMed] [Google Scholar]
- 15.Rebrin I, Forster MJ, Sohal RS. Effects of age and caloric intake on glutathione redox state in different brain regions of C57BL/6 and DBA/2 mice. Brain Res. 2007;1127:10–18. doi: 10.1016/j.brainres.2006.10.040. [DOI] [PMC free article] [PubMed] [Google Scholar]
- 16.Rebrin I, Forster MJ, Sohal RS. Association between life-span extension by caloric restriction and thiol redox state in two different strains of mice. Free Radic Biol Med. 2011;51:225–233. doi: 10.1016/j.freeradbiomed.2011.04.006. [DOI] [PMC free article] [PubMed] [Google Scholar]
- 17.Ronchi JA, Figueira TR, Ravagnani FG, Oliveira HC, Vercesi AE, Castilho RF. A spontaneous mutation in the nicotinamide nucleotide transhydrogenase gene of C57BL/6J mice results in mitochondrial redox abnormalities. Free Radic Biol Med. 2013;63:446–456. doi: 10.1016/j.freeradbiomed.2013.05.049. [DOI] [PubMed] [Google Scholar]
- 18.Schaaf GJ, Nijmeijer SM, Maas RF, Roestenberg P, de Groene EM, Fink-Gremmels J. The role of oxidative stress in the ochratoxin A-mediated toxicity in proximal tubular cells. Biochim Biophys Acta. 2002;1588:149–158. doi: 10.1016/s0925-4439(02)00159-x. [DOI] [PubMed] [Google Scholar]
- 19.Tsaih SW, Pezzolesi MG, Yuan R, Warram JH, Krolewski AS, Korstanje R. Genetic analysis of albuminuria in aging mice and concordance with loci for human diabetic nephropathy found in a genome-wide association scan. Kidney Int. 2010;77:201–210. doi: 10.1038/ki.2009.434. [DOI] [PMC free article] [PubMed] [Google Scholar]
- 20.Tsuchiya M, Ji C, Kosyk O, Shymonyak S, Melnyk S, Kono H, Tryndyak V, Muskhelishvili L, Pogribny IP, Kaplowitz N, Rusyn I. Interstrain differences in liver injury and one-carbon metabolism in alcohol-fed mice. Hepatology. 2012;56:130–139. doi: 10.1002/hep.25641. [DOI] [PMC free article] [PubMed] [Google Scholar]
- 21.Urata Y, Honma S, Goto S, Todoroki S, Iida T, Cho S, Honma K, Kondo T. Melatonin induces gamma-glutamylcysteine synthetase mediated by activator protein-1 in human vascular endothelial cells. Free Radic Biol Med. 1999;27:838–847. doi: 10.1016/s0891-5849(99)00131-8. [DOI] [PubMed] [Google Scholar]
- 22.van 't Erve TJ, Wagner BA, Ryckman KK, Raife TJ, Buettner GR. The concentration of glutathione in human erythrocytes is a heritable trait. Free Radic Biol Med. 2013 doi: 10.1016/j.freeradbiomed.2013.08.002. [DOI] [PMC free article] [PubMed] [Google Scholar]
- 23.Yuan R, Tsaih SW, Petkova SB, Marin de Evsikova C, Xing S, Marion MA, Bogue MA, Mills KD, Peters LL, Bult CJ, Rosen CJ, Sundberg JP, Harrison DE, Churchill GA, Paigen B. Aging in inbred strains of mice: study design and interim report on median lifespans and circulating IGF1 levels. Aging Cell. 2009;8:277–287. doi: 10.1111/j.1474-9726.2009.00478.x. [DOI] [PMC free article] [PubMed] [Google Scholar]


